. 2023 Mar 7;14(1):1267.
doi: 10.1038/s41467-023-36735-2.

SOX11 regulates SWI/SNF complex components as member of the adrenergic neuroblastoma core regulatory circuitry

Affiliations

SOX11 regulates SWI/SNF complex components as member of the adrenergic neuroblastoma core regulatory circuitry

Bieke Decaesteker et al. Nat Commun. .

Abstract

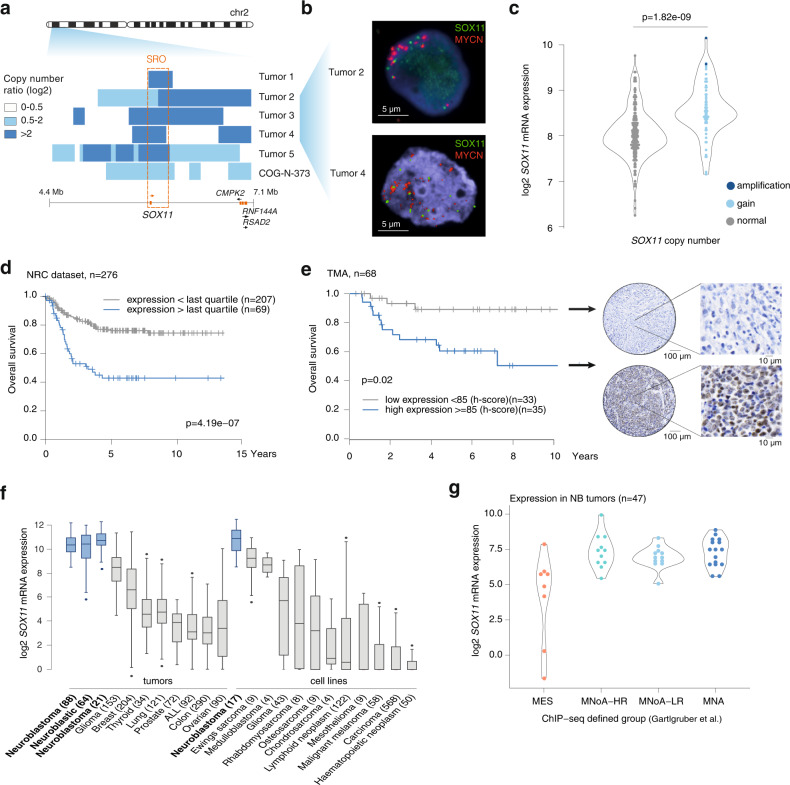
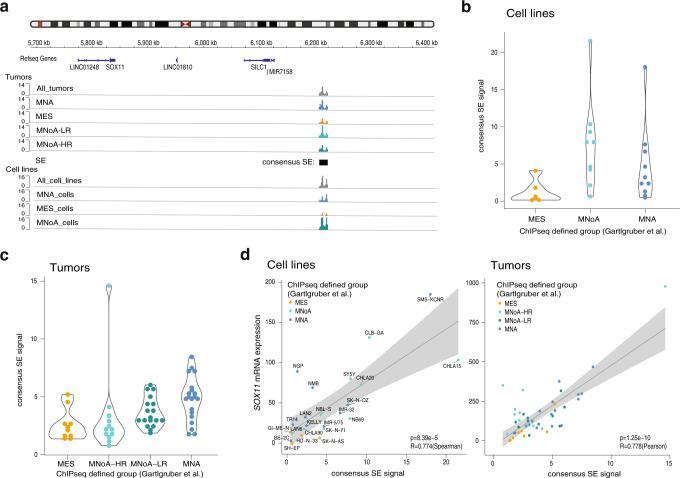
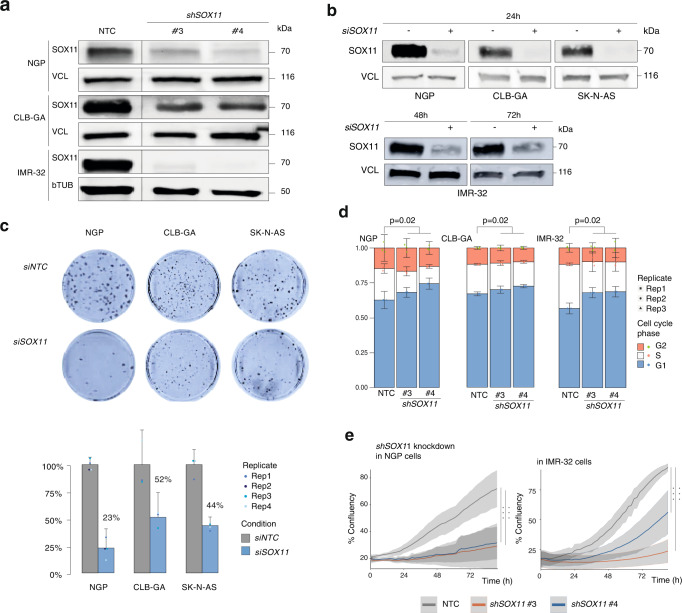
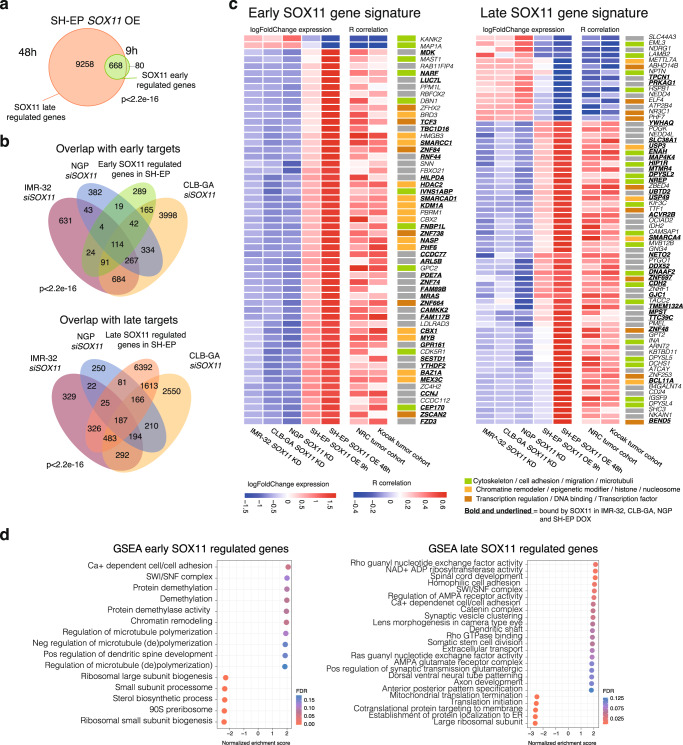
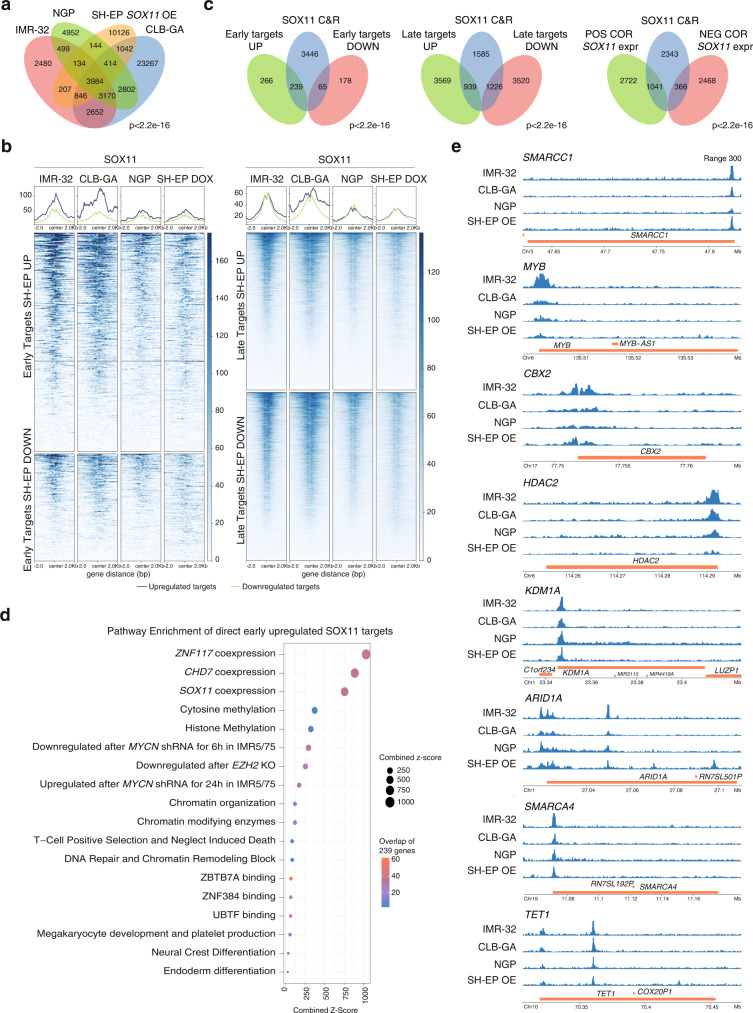
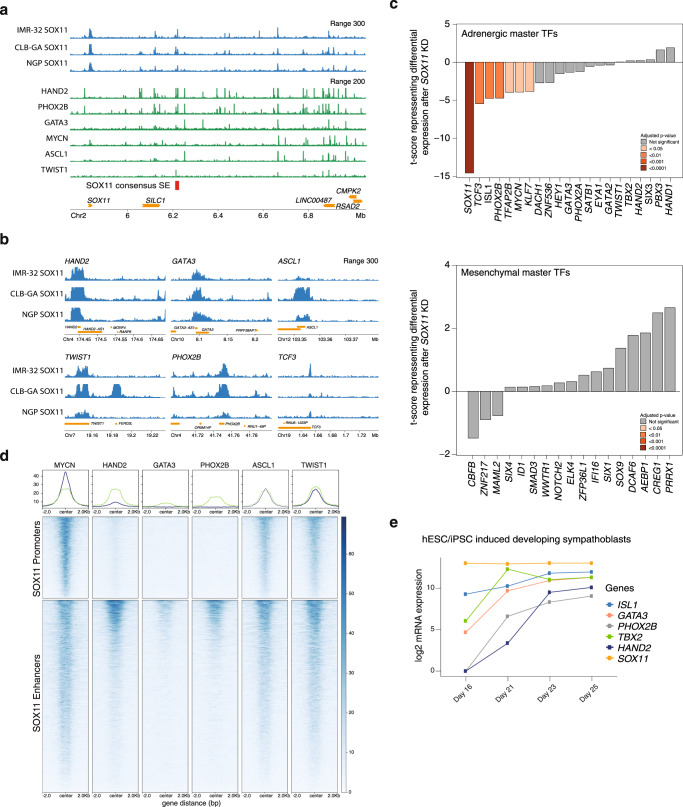
The pediatric extra-cranial tumor neuroblastoma displays a low mutational burden while recurrent copy number alterations are present in most high-risk cases. Here, we identify SOX11 as a dependency transcription factor in adrenergic neuroblastoma based on recurrent chromosome 2p focal gains and amplifications, specific expression in the normal sympatho-adrenal lineage and adrenergic neuroblastoma, regulation by multiple adrenergic specific (super-)enhancers and strong dependency on high SOX11 expression in adrenergic neuroblastomas. SOX11 regulated direct targets include genes implicated in epigenetic control, cytoskeleton and neurodevelopment. Most notably, SOX11 controls chromatin regulatory complexes, including 10 SWI/SNF core components among which SMARCC1, SMARCA4/BRG1 and ARID1A. Additionally, the histone deacetylase HDAC2, PRC1 complex component CBX2, chromatin-modifying enzyme KDM1A/LSD1 and pioneer factor c-MYB are regulated by SOX11. Finally, SOX11 is identified as a core transcription factor of the core regulatory circuitry (CRC) in adrenergic high-risk neuroblastoma with a potential role as epigenetic master regulator upstream of the CRC.


Conflict of interest statement

The authors declare no competing interests.

Figures

Fig. 1
Fig. 1. Rare focal amplifications and lineage-specific expression of SOX11 in NB.
a Log2 copy number ratio on chromosome 2p (4.4–7.1 Mb, hg19) showing shortest region of overlap (SRO) (chr2:5,828,671-6,098,736; hg19) for high-level focal 2p gains (log2ratio > 0.5) and amplification (log2ratio > 2) in 5 NB tumors and 1 NB cell line encompassing the SOX11 locus (GSE103123). Tumor 1 is evaluated by arrayCGH, tumor 5 by whole genome sequencing, and tumor 2, 3, 4 and the cell line by shallow whole genome sequencing. b FISH analysis performed on two tumor cases with SOX11 amplification from Fig. 1a (asterix) showing independent amplification of SOX11 (green) and MYCN (red). Scalebar represents 5 µm. c SOX11 (log2) mRNA levels according to copy number status (amplification (log2ratio > 2), gain (log2ratio > 0.3); normal) in cohort of 276 patients (NRC cohort, GSE85047) (two-tailed T-test, p = 1.82e-09). The samples with SOX11 amplification are tumor 4 and 5 from Fig. 1a. d Kaplan–Meier analysis (overall survival) of 276 neuroblastoma patients (NRC cohort, GSE85047) with high (69) or low (207) SOX11 (log2) expression (highest quartile cut-off) (p = 4.19e-07, Kaplan–Meier). e Immunohistochemical staining for SOX11 on tissue micro-array (TMA) of 68 NB tumors and correlation of high (35) or low (33) SOX11 protein levels (median cut-off of H-score = 85, see Methods) with overall worse survival (p = 0.02, Kaplan–Meier). For each group, a representative immunohistochemical staining is depicted. Scalebar represents 10 µm. f SOX11 expression (log2) in NB tumors and cell lines (blue) compared to other entities (details see DATA availability). Boxplots show 1st quartile to 3rd quartile and median. Whiskers represent outer two quartiles maximized at 1.5 times the size of the box. If values outside of the whiskers are present, this is indicated with a single dot. Indicated in brackets are number of replicates per entity. g. SOX11 (log2) expression in four H3K27ac profiling based groups identified in NB tumors: MYCN-amplified (MNA), high-risk MYCN non-amplified (MNoA-HR), low-risk MYCN non-amplified group (MNoA-LR) and mesenchymal (MES). SOX11 is higher expressed in MNoA-HR, MNoA-LR and MNA groups as compared to MES group (ANOVA and two-tailed post-tukey test, significant comparisons: MNoA-HR vs MES p = 4e-04, MNoA-LR vs MES p = 2e-03, MNA vs MES p = 2e-04) (GSE136209). For Fig. 1c–g, source data are provided as Source Data file.
Fig. 2
Fig. 2. SOX11 is flanked by multiple cis-interacting adrenergic specific enhancers.
a Super-enhancer calling (present in at least 2 samples and not overlapping with H3K4me3 5 kb from transcription start site) downstream of the SOX11 locus in NB tumors (MNA = adrenergic MYCN amplified, MES = mesenchymal, MNoA-LR = adrenergic MYCN non-amplified low-risk, MNoA-HR = adrenergic MYCN non-amplified high-risk) and NB cell lines (MNA = adrenergic MYCN amplified, MES = mesenchymal, MNoA = adrenergic MYCN non-amplified) (GSE136209). b Violin plot showing super-enhancer signal for each individual NB cell line colored by their ChIP-seq signature defined subgroup (GSE136209). c Violin plot showing super-enhancer signal for each individual NB tumors colored by their ChIP-seq signature defined subgroup (GSE136209). d (Left) Correlation of SOX11 expression with super-enhancer signal of the consensus super-enhancer in a dataset of 25 NB cell lines, colored by their ChIP-seq signature defined subgroup (p-value = 8.39e-5, R-value = 0.774, two-tailed Spearman correlation). (Right) Correlation of SOX11 expression with super-enhancer signal of the consensus super-enhancer in a dataset of 47 NB tumors, colored by their ChIP-seq signature defined subgroup (p-value = 1.25e-10, R-value = 0.778, two-tailed Pearson correlation) (GSE136209). Trend line is shown with 95% confidence interval. For Fig. 2b–d, source data are provided as Source Data file.
Fig. 3
Fig. 3. SOX11 is a dependency factor in adrenergic NB cells.
a SOX11 protein levels 6 days upon shSOX11 treatment in NGP, CLB-GA and IMR-32 cells with 2 different shRNAs and one non-targeting control (NTC). Vinculin (VCL) and β-tubulin (bTUB) were used as loading control. NTC and shRNA samples were run on the same blot. Blots for NGP and CLB-GA have been repeated three time with similar results. Blot for IMR-32 has been repeated once. b SOX11 protein levels 24 h upon siRNA treatment in NGP, CLB-GA and SK-N-AS cells (dharmafect transfection). SOX11 protein levels 48 h and 72 h upon siSOX11 treatment in IMR-32 (nucleofection). Vinculin (VCL) is used as loading control. Blot for IMR-32 for 48 h has been repeated four times with similar results, rest once. c Reduction in colony formation capacity for NGP, CLB-GA and SK-N-AS cells, 14 days upon siRNA SOX11 treatment (dharmafect transfection) as compared to non-targeting control (siNTC). Data were generated in triplicate for each cell line, and quantification was done using ImageJ. Data-points were mean-centered and scaled to the siNTC condition. Barplot represents the mean for each condition with error bars representing the standard deviation of the three biological replicates. d Cell cycle analysis 6 days upon shRNA SOX11 treatment in the IMR-32, NGP and CLB-GA cell line. G1 cell cycle arrest upon SOX11 knockdown as compared to the non-targeting control (NTC). The two-tailed Mann–Whitney statistical test is based on G1 phase percentage (shSOX11 vs NTC: NGP p-value = 0.2, CLB-GA p-value = 0.2, IMR-32 p-value = 0.2). Data-points were mean-centered and auto scaled. Error bars represent the 95% CI of three biological replicates (rep) for every cell line. e Reduced proliferation (% confluence) over time upon prolonged SOX11 knockdown with 2 different shRNAs for 4 days as compared to non-targeting control (NTC) in NGP and IMR-32 cells. Trend line represents the mean and error marks represent the 95% CI of 3 biological replicates. ANOVA test followed by Tukey post-hoc test (NGP: sh3 vs NTC p = 4.51e-14, sh4 vs NTC p = 5.06e-14; IMR-32: sh3 vs NTC p = 2.16e-14, sh4 vs NTC p = 2.74e-06). For Fig. 3a–e, source data are provided as Source Data file.
Fig. 4
Fig. 4. The SOX11 regulated transcriptome is involved in epigenetic control, cytoskeleton and neurodevelopment.
a Overlap of genes perturbated in SH-EP upon SOX11 overexpression (OE) for 48 h and 9 h (adj p value <0.05) with differential genes upon 9 h overexpression being the SOX11 early regulated genes and differential genes upon 48 h but not 9 h overexpression being the SOX11 late regulated genes (one-tailed fisher test p-value <2.2e−16). b Overlap of genes perturbated in IMR-32, CLB-GA and NGP upon SOX11 knockdown for 48 h (adj p value <0.05) with respectively the SOX11 early and late regulated genes in SH-EP (one-tailed fisher test p-value <2.2e−16). c SOX11 early and late genes signature obtained by the overlap of differentially expressed genes upon SOX11 knockdown in IMR-32, CLB-GA and NGP with the early and late SOX11 regulated genes in SH-EP (adj p value <0.05, log FC > 0.5 or < −0.5) as well as with genes correlation with SOX11 expression in 2 different NB tumor cohorts (NRC GSE85047, Kocak GSE45547, p-value <0.05). A color next to each gene represents the involved pathways. Bold and underlined represents genes that are bound by SOX11 in IMR-32, CLB-GA, NGP and SH-EP after SOX11 overexpression for 48 h. d Top enriched genesets after doing GSEA analysis (http://www.gsea-msigdb.org/gsea/index.jsp, ontology gene sets C5) for SOX11 early and SOX11 late regulated genes. Depicted is the normalized enrichment score (NES, x-axis) and the false discovery rate (FDR, color). For Fig. 4c–d source data are provided as Source Data file.
Fig. 5
Fig. 5. SOX11 directly regulates multiple major modulators of the epigenome including the SWI/SNF remodeling complex.
a Overlap (min. overlap = 20 bp) of the SOX11 CUT&RUN peaks (MACS2 peakcalling qval < 0.05) in IMR-32, CLB-GA, NGP cells and SH-EP cells after SOX11 overexpression (OE) for 48 h (one-tailed fisher test p-value<2.2e-16). b Heatmap profiles −2 kb and +2 kb around the transcription start site of early and late SOX11 targets in SH-EP, subdivided in upregulated and downregulated genes. On these regions the SOX11 CUT&RUN data in IMR-32, CLB-GA, NGP and SH-EP cells after SOX11 overexpression (SH-EP DOX) for 48 h are mapped and ranked according to the sums of the peak scores across all datasets in the heatmap. c Overlap of common SOX11 CUN&RUN peaks (common peaks in IMR-32, CLB-GA, NGP cells and SH-EP cells after SOX11 overexpression for 48 h) and early and late up- and downregulated genes in SH-EP after SOX11 overexpression for 48 h (adj p value <0.05, log FC > 0.5 or < −0.5) and overlap of common SOX11 CUT&RUN peaks with genes positively (POS COR) and negatively (NEG COR) correlated with SOX11 expression in NB tumor cohort (n  =  283, GSE85047, p-value<0.05, one-tailed fisher test p-value<2.2e-16). d EnrichR analysis for overlap of common SOX11 CUT&RUN peaks (common peaks in IMR-32, CLB-GA, NGP cells and SH-EP cells after SOX11 overexpression for 48 h) and early upregulated genes in SH-EP after SOX11 overexpression for 48 h. Depicted is the combined Z-score which is computed by taking the log of the p-value from the Fisher exact test and multiplying that with the z-score of the deviation from the expected rank (size), as well as the number of genes that overlap with the enriched genesets (color). e. Binding of SOX11 at c-MYB, SMARCC1, CBX2, KDM1A, SMARCA4, HDAC2, ARID1A and TET1 in IMR-32, CLB-GA, NGP and SH-EP cells after SOX11 overexpression for 48 h. Signal represents log likelihood ratio for the ChIP signal compared to input signal (RPM normalised). All peaks are called by MACS2 (q < 0.05). For Fig. 5d source data are provided as Source Data file.
Fig. 6
Fig. 6. SOX11 is a core regulatory circuitry transcription factor in adrenergic NB.
a Binding of SOX11 (CUT&RUN), HAND2, PHOX2B, GATA3 (GSE90683), MYCN, TWIST1 (GSE94822) and ASCL1 (GSE159613) and at the SOX11 locus and downstream enhancer landscape. Signal represents log likelihood ratio for the ChIP and CUT&RUN signal compared to input signal (RPM normalised). Super-enhancers of CLB-GA are annotated using ROSE (red bar) showing the SOX11 consensus super-enhancer (SE). b Binding of SOX11 to the PHOX2B, HAND2, GATA3, ASCL1, TCF3 and TWIST1 locus. Signal represents log likelihood ratio for the ChIP and CUT&RUN signal compared to input signal (RPM normalised). c Tscore representing differential expression of MES and ADRN core regulatory circuitry transcription factors (TFs) in RNA-sequencing data after SOX11 knockdown (KD) in IMR-32, CLB-GA and NGP. Significant adjusted p-values are indicated with coloured bars. Statistical testing was done using the empirical Bayes quasi-likelihood F-test. d Heatmap profiles −2 kb and +2 kb around the summit of SOX11 CUT&RUN peaks in IMR-32, grouped for promoters or enhancers (homer annotation). On these regions HAND2, PHOX2B, GATA3 (GSE90683), MYCN, TWIST1 (GSE94822) and ASCL1 (GSE159613) ChIP data is mapped and ranked according to the sums of the peak scores across all datasets in the heatmap. e ISL1, GATA3, PHOX2B, TBX2, HAND2 and SOX11 (log2) expression during induced differentiation of hPSC cells along the sympatho-adrenal lineage. Expression levels depicted starting from day 16, upon sorting the cells for SOX10 expression indicating cells committed to truncal neural crest cells, and followed-up during sympatho-adrenal development until day 25. For Fig. 6c and e source data are provided as Source Data file.

References

    1. Matthay KK, et al. Neuroblastoma. Nat. Rev. Dis. Prim. 2016;2:16078. doi: 10.1038/nrdp.2016.78. - DOI - PubMed
    1. Shendy NAM, Zimmerman MW, Abraham BJ, Durbin AD. Intrinsic transcriptional heterogeneity in neuroblastoma guides mechanistic and therapeutic insights. Cell Rep. Med. 2022;3:100632. doi: 10.1016/j.xcrm.2022.100632. - DOI - PMC - PubMed
    1. van Groningen T, et al. Neuroblastoma is composed of two super-enhancer-associated differentiation states. Nat. Genet. 2017;49:1261–1266. doi: 10.1038/ng.3899. - DOI - PubMed
    1. Boeva V, et al. Heterogeneity of neuroblastoma cell identity defined by transcriptional circuitries. Nat. Genet. 2017;49:1408–1413. doi: 10.1038/ng.3921. - DOI - PubMed
    1. Garraway LA, Sellers WR. Lineage dependency and lineage-survival oncogenes in human cancer. Nat. Rev. Cancer. 2006;6:593–602. doi: 10.1038/nrc1947. - DOI - PubMed

Publication types