. 2023 May;33(5):341-354.
doi: 10.1038/s41422-023-00789-0. Epub 2023 Mar 8.

Tuning charge density of chimeric antigen receptor optimizes tonic signaling and CAR-T cell fitness

Affiliations

Tuning charge density of chimeric antigen receptor optimizes tonic signaling and CAR-T cell fitness

Jian Chen et al. Cell Res. 2023 May.

Abstract

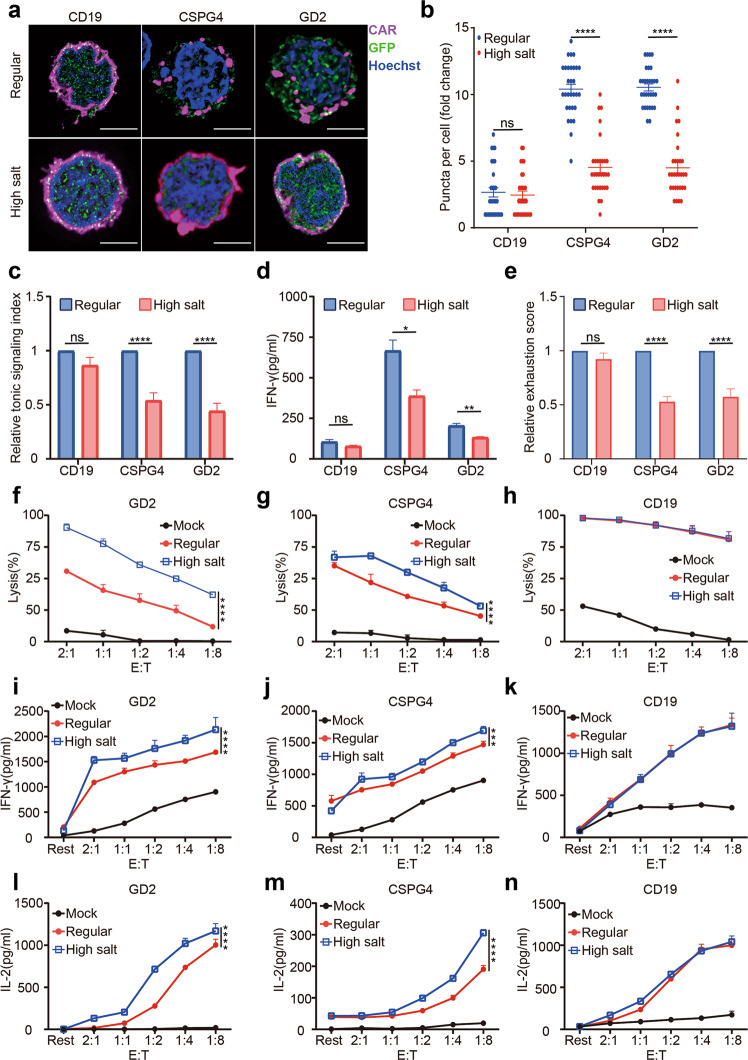
Tonic signaling of chimeric antigen receptor (CAR), i.e., the spontaneous CAR activation in the absence of tumor antigen stimulation, is considered to be a pivotal event controlling CAR-T efficacy. However, the molecular mechanism underlying the spontaneous CAR signals remains elusive. Here, we unveil that positively charged patches (PCPs) on the surface of the CAR antigen-binding domain mediate CAR clustering and result in CAR tonic signaling. For CARs with high tonic signaling (e.g., GD2.CAR and CSPG4.CAR), reducing PCPs on CARs or boosting ionic strength in the culture medium during ex vivo CAR-T cell expansion minimizes spontaneous CAR activation and alleviates CAR-T cell exhaustion. In contrast, introducing PCPs into the CAR with weak tonic signaling, such as CD19.CAR, results in improved in vivo persistence and superior antitumor function. These results demonstrate that CAR tonic signaling is induced and maintained by PCP-mediated CAR clustering. Notably, the mutations we generated to alter the PCPs maintain the antigen-binding affinity and specificity of the CAR. Therefore, our findings suggest that the rational tuning of PCPs to optimize tonic signaling and in vivo fitness of CAR-T cells is a promising design strategy for the next-generation CAR.


Conflict of interest statement

Several patent applications have been submitted based on results presented in this manuscript. J.C., S.Q. and H. Wang are listed as the inventors. The authors declare no competing interests.

Figures

Fig. 1
Fig. 1. CAR-T exhaustion induced by high tonic signaling of many commonly used CARs.
a FACS analysis of CD69 expression level of Jurkat T cells expressing wild type and ITAM mutant CD19, CSPG4, and GD2.CARs. b CD69/GFP, defined as the tonic signaling index, of the three CARs shown in a. c The tonic signaling index of ten commonly used CARs. d The average expression of LAG3, TIM3 and PD-1 on CAR-T cells used to define the exhaustion score. e The exhaustion score of the CAR shown in c. f Correlation between the exhaustion score and the tonic signaling index in these CAR-T cells assessed by the Pearson method. Data are presented as means ± SEM. All comparisons were determined using Student’s t-tests; **P < 0.01; ****P < 0.0001.
Fig. 2
Fig. 2. PCPs on the antigen-binding domain surface determine CAR tonic signaling strengths.
a Electrostatics analysis of the ten CAR scFv constructs using APBS within UCSF Chimera. Blue, positively charged surface; red, negatively charged surface. b The electrostatic potential fields of the charged CAR scFv observed in the Swiss-PDBViewer software. c The top three largest patches containing continuous positive charged residues displayed by the BindUP web server tool. Dark blue, the first-largest PCP; medium blue, the second-largest PCP; light blue, the third-largest PCP. d The PCP score, which represents the sum of all residues within the top three largest PCPs, of the CAR scFvs shown in c. e Correlation between the PCP score and the tonic signaling index in these CAR-T cells, assessed by the Pearson method.
Fig. 3
Fig. 3. Adjusting ionic strength during ex vivo expansion to optimize CAR tonic signaling and CAR-T function.
a Imaging analysis of CAR clustering of Jurkat T cells expressing CD19, CSPG4, or GD2.CARs cultured from regular or H.S. medium without antigen stimulation. Pink, CAR; green, CAR-IRES EGFP; blue, Hoechst. Scale bars, 5 μm. b Analysis of the number of the CAR puncta per cell shown in a. c Jurkat T cells expressing indicated CAR were cultured in either regular or H.S. medium and CAR tonic signaling indexes normalized by the index of sample grown in regular medium were shown. d IFN-γ secretion levels of CD19, CSGP4, and GD2.CAR-T cells cultured in regular or H.S. medium without antigen stimulation. e Primary T cells expressing indicated CAR were cultured in either regular or H.S. medium and CAR exhaustion scores normalized by the score of samples grown in regular medium were shown. fh In vitro cytotoxicity assay of CAR-T cells expressing CD19, CSPG4, and GD2.CARs. Indicated CAR-T cells grown in regular or H.S. medium were harvested and co-incubated with their target tumor cells at the indicated E:T ratio overnight. Killing efficiency was analyzed by luciferase cytotoxicity assay. in Cytokine secretion assay of CAR-T cells after activation. Indicated CAR-T cells grown in regular or H.S. medium were harvested and co-incubated with their target tumor cells at the indicated E:T ratio. The levels of IL-2 and IFN-γ were determined by ELISA. Data are presented as means ± SEM. Comparisons were determined using unpaired Student’s t-tests (be) or two-way analysis of variance (fn); *P < 0.05; **P < 0.01; ***P < 0.001; ****P < 0.0001; ns, not significant.
Fig. 4
Fig. 4. Reducing PCPs on the CAR surface mitigates T cell exhaustion induced by high CAR signaling.
a The sequences of optimized GD2.CAR variants. b The top three largest PCPs on optimized GD2.CAR scFv surface displayed by the BindUP web server tool. Dark blue, the first-largest PCP; medium blue, the second-largest PCP; light blue, the third-largest PCP. c The calculation of PCP scores for the optimized GD2.CAR scFvs. d The calculation of relative tonic signaling indexes for the optimized GD2.CAR scFvs. e The calculation of relative exhaustion scores for the optimized GD2.CAR scFvs. f Imaging analysis of CAR clustering on GD2WT and GD2F4.CAR-T cells. Pink, CAR; green, CAR-IRES EGFP; blue, Hoechst. Scale bars, 5 μm. g In vitro killing assay against GD2+ neuroblastoma cell line CHLA-255 of WT and mutated GD2.CAR-T cells. h, i Cytokine secretion assay of CAR-T cells after activation. WT and optimized GD2.CAR-T cells were co-incubated with their target tumor cells at the indicated E:T ratio. The levels of IL-2 and IFN-γ were determined by ELISA. j Representative bioluminescence images of tumor burden after GD2WT and GD2F4.CAR-T infusion over time. k Quantifications of luciferase intensity, which reflets tumor burden, of each mouse shown in j using IVIS system. l Survival curves for the mice shown in j. Data are presented as means ± SEM; Comparisons were determined using unpaired Student’s t-tests (d, e), two-way analysis of variance (gi, k), and survival analysis (l); *P < 0.05; **P < 0.01; ***P < 0.001; ****P < 0.0001; ns, not significant.
Fig. 5
Fig. 5. Incorporating PCPs into CARs containing 41BB costimulation domain with hypo tonic signaling promotes CAR-T persistence.
a The sequences of optimized CD19.CAR variants. b The top three largest PCPs on modified CD19.CAR scFv surface displayed by the BindUP web server tool. Dark blue, the first-largest PCP; medium blue, the second-largest PCP; light blue, the third-largest PCP. c The calculation of PCP scores for the modified CD19.CAR scFvs. d Imaging analysis of the clustering of CD19WT and CD19M1.CAR. Pink, CAR; green, CAR-IRES EGFP; blue, Hoechst. Scale bars, 5 μm. e The calculation of relative tonic signaling indexes for the modified CD19.CAR scFvs. f In vitro proliferation assay of WT and mutated CD19.CAR-T cells. g In vitro killing assay of WT and mutated CD19.CAR-T cells. h Representative bioluminescence images of tumor burden after CD19WT and CD19M1.CAR-T infusion over time. i Survival curves for the tumor-bearing mice after CD19WT and CD19M1.CAR-T infusion. j Number of CD19WT and CD19M1.CAR-T cells in the spleen of tumor-bearing mice 1 month after CAR-T infusion. Data are presented as means ± SEM. Comparisons were determined using unpaired Student’s t-tests (e, j), two-way analysis of variance (f, g), and survival analysis (i); *P < 0.05; **P < 0.01; ***P < 0.001; ns, not significant.
Fig. 6
Fig. 6. The antigen-binding affinities and specificities of WT and PCP-modified CARs.
a Purified WT and PCP-modified antibodies stained with Coomassie Blue. HC, heavy chain; LC, light chain. b, c Antigen-binding activities of WT and PCP-modified antibodies measured by a cell-based FACS assay using antigen-positive cell lines. Nalm6 cells were used for CD19 antibodies (b), and GD2+Nalm6 cells were used for GD2 antibodies (c). EC50, half maximal effective concentration. Data are presented as means with 95% confidence intervals. d Binding activities of GD2WT and GD2F4 antibodies against 100 synthetic glycans detected using the glycan array. e Biotin-labeled surface proteins on CD19+K562 cells enriched by CD19 antibodies. Cell surface proteins were biotinylated and immunoprecipitated using CD19WT or CD19M1 antibodies, followed by detection via Streptavidin-HRP blot. WT K562 cells were included as a negative control. IP, immunoprecipitation. f Binding activities of WT and PCP-modified antibodies against a panel of human cells. MFI, Mean fluorescence intensity. g Schematic model illustrating rational improvement of tonic signaling strength and CAR-T cell fitness.

References

    1. Majzner RG, Mackall CL. Clinical lessons learned from the first leg of the CAR T cell journey. Nat. Med. 2019;25:1341–1355. doi: 10.1038/s41591-019-0564-6. - DOI - PubMed
    1. Roose JP, et al. T cell receptor-independent basal signaling via Erk and Abl kinases suppresses RAG gene expression. PLoS Biol. 2003;1:E53. doi: 10.1371/journal.pbio.0000053. - DOI - PMC - PubMed
    1. Bartleson JM, et al. Strength of tonic T cell receptor signaling instructs T follicular helper cell-fate decisions. Nat. Immunol. 2020;21:1384–1396. doi: 10.1038/s41590-020-0781-7. - DOI - PMC - PubMed
    1. Long AH, et al. 4-1BB costimulation ameliorates T cell exhaustion induced by tonic signaling of chimeric antigen receptors. Nat. Med. 2015;21:581–590. doi: 10.1038/nm.3838. - DOI - PMC - PubMed
    1. Lynn RC, et al. c-Jun overexpression in CAR T cells induces exhaustion resistance. Nature. 2019;576:293–300. doi: 10.1038/s41586-019-1805-z. - DOI - PMC - PubMed

Publication types

MeSH terms

Substances

LinkOut - more resources