. 2023 Mar 7;24(1):87.
doi: 10.1186/s12859-023-05185-4.

Acute stress reduces population-level metabolic and proteomic variation

Affiliations

Acute stress reduces population-level metabolic and proteomic variation

Katherine F Steward et al. BMC Bioinformatics. .

Abstract

Background: Variation in omics data due to intrinsic biological stochasticity is often viewed as a challenging and undesirable feature of complex systems analyses. In fact, numerous statistical methods are utilized to minimize the variation among biological replicates.

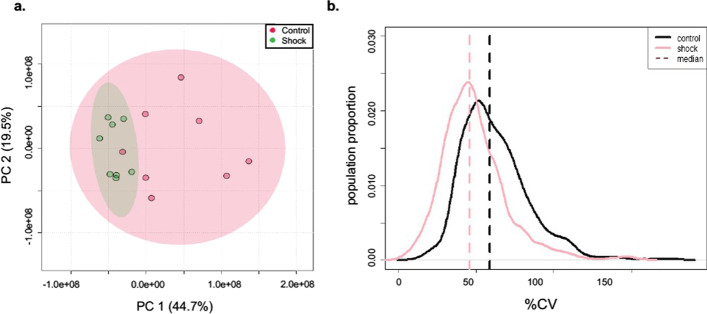
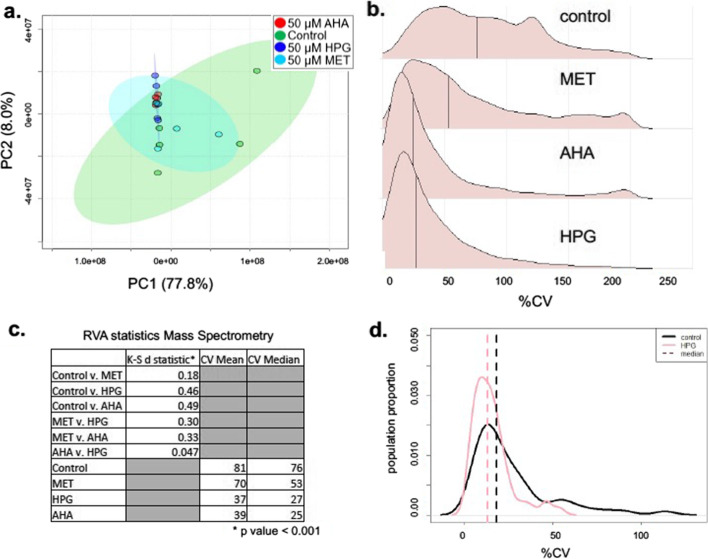
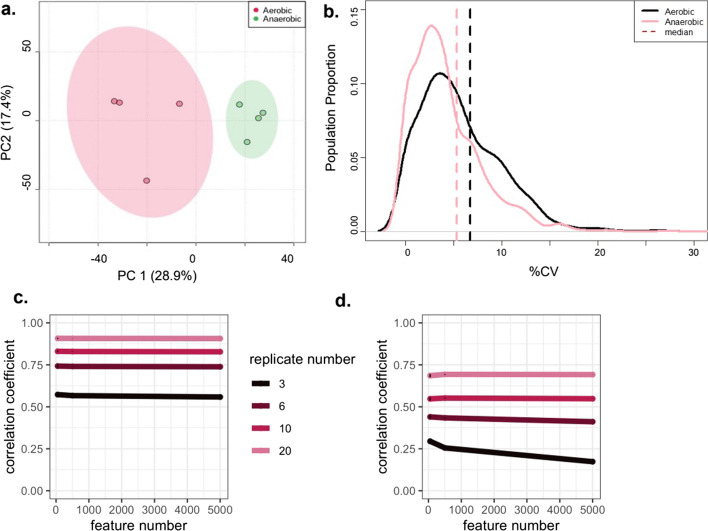
Results: We demonstrate that the common statistics relative standard deviation (RSD) and coefficient of variation (CV), which are often used for quality control or part of a larger pipeline in omics analyses, can also be used as a metric of a physiological stress response. Using an approach we term Replicate Variation Analysis (RVA), we demonstrate that acute physiological stress leads to feature-wide canalization of CV profiles of metabolomes and proteomes across biological replicates. Canalization is the repression of variation between replicates, which increases phenotypic similarity. Multiple in-house mass spectrometry omics datasets in addition to publicly available data were analyzed to assess changes in CV profiles in plants, animals, and microorganisms. In addition, proteomics data sets were evaluated utilizing RVA to identify functionality of reduced CV proteins.

Conclusions: RVA provides a foundation for understanding omics level shifts that occur in response to cellular stress. This approach to data analysis helps characterize stress response and recovery, and could be deployed to detect populations under stress, monitor health status, and conduct environmental monitoring.

Keywords: Canalization; Cellular stress; Metabolomics; Proteomics.


Conflict of interest statement

The authors declare that they have no competing interests.

Figures

Fig. 1
Fig. 1
Metabolic variation in response to hemorrhagic shock in a mammal. A Principal component analysis of control (red) and shocked (green) S. scrofa (n = 8). B Profile distribution plots of the CV of metabolite features from S. scrofa replicates from a control (black) and a shocked group (pink). The X axis shows the CV and the Y axis is the proportion of metabolites in the metabolome. Adapted from Heinemann et al. (2014)
Fig. 2
Fig. 2
Metabolic variation in E. coli treated with non-canonical amino acids. A Principal component analysis of four different treatment groups from non-canonical amino acid treatment experiments on E. coli cell cultures with median displayed as a solid line (red = AHA treatment, green = control, blue = HPG and cyan = MET) (Steward et al. 2020). B Distribution plots of CV of mass spectrometry metabolite feature profiles for the non-canonical amino acid treated cultures of E. coli. C Table of CV statistics include the K–S d statistic for the different comparisons of the Control to the other groups, the CV mean and the CV median. D Profile distribution plots of the CV of NMR metabolite features from E. coli replicates from a control (black) and HPG treated (pink)
Fig. 3
Fig. 3
Distribution of CV in A. fatua and temporal RVA analysis. A Distribution profile plot of metabolomic CV of A. fatua exposed to heat shock at 40 C (pink) and the control group (black). B Temporal CV profiles from heat stressed A. fatua. Time post-stress is from zero to 100 h of recovery. Table below: values of the K–S test. C Temporal CV profiles of methionine dependent cancer cell line supplemented with homocysteine (hcy) in the growth media, with timepoints collected after 2, 4, 8 and 12 h of acclimation. Table below: values of the K–S test
Fig. 4
Fig. 4
RVA of proteomics data and simulation analysis. A Principal component analysis of proteomic data from anaerobic and aerobic E. coli cultures, shown in green and red respectively. B CV distribution plots for anaerobic (pink) versus aerobic (black) E. coli cultures. C, D Simulated data with 3, 6, 10 or 20 replicates using 50, 500 or 5000 features. The standard deviation was modeled at 0.5 of the mean (C) and 0.23 of the mean (D)

References

    1. Galluzzi L, Bravo-San Pedro JM, Kepp O, Kroemer G. Regulated cell death and adaptive stress responses. Cell Mol Life Sci. 2016;73(11–12):2405–2410. doi: 10.1007/s00018-016-2209-y. - DOI - PMC - PubMed
    1. Johnson CH, Ivanisevic J, Siuzdak G. Metabolomics: Beyond biomarkers and towards mechanisms. Nat Rev Mol Cell Biol. 2016;17(7):451–459. doi: 10.1038/nrm.2016.25. - DOI - PMC - PubMed
    1. Schuhmacher R, Krska R, Weckwerth W, Goodacre R. Metabolomics and metabolite profiling. Anal Bioanal Chem. 2013;405(15):5003–5004. doi: 10.1007/s00216-013-6939-5. - DOI - PubMed
    1. Bush WS, Oetjens MT, Crawford DC. Unravelling the human genome-phenome relationship using phenome-wide association studies. Nat Rev Genet. 2016;17(3):129–145. doi: 10.1038/nrg.2015.36. - DOI - PubMed
    1. Healy TM, Schulte PM. Phenotypic plasticity and divergence in gene expression. Mol Ecol. 2015;24(13):3220–3222. doi: 10.1111/mec.13246. - DOI - PubMed

LinkOut - more resources