

Long non-coding RNA H19 regulates matrisome signature and impacts cell behavior on MSC-engineered extracellular matrices
- PMID: 36882843
- PMCID: PMC9993741
- DOI: 10.1186/s13287-023-03250-6
Long non-coding RNA H19 regulates matrisome signature and impacts cell behavior on MSC-engineered extracellular matrices
Abstract
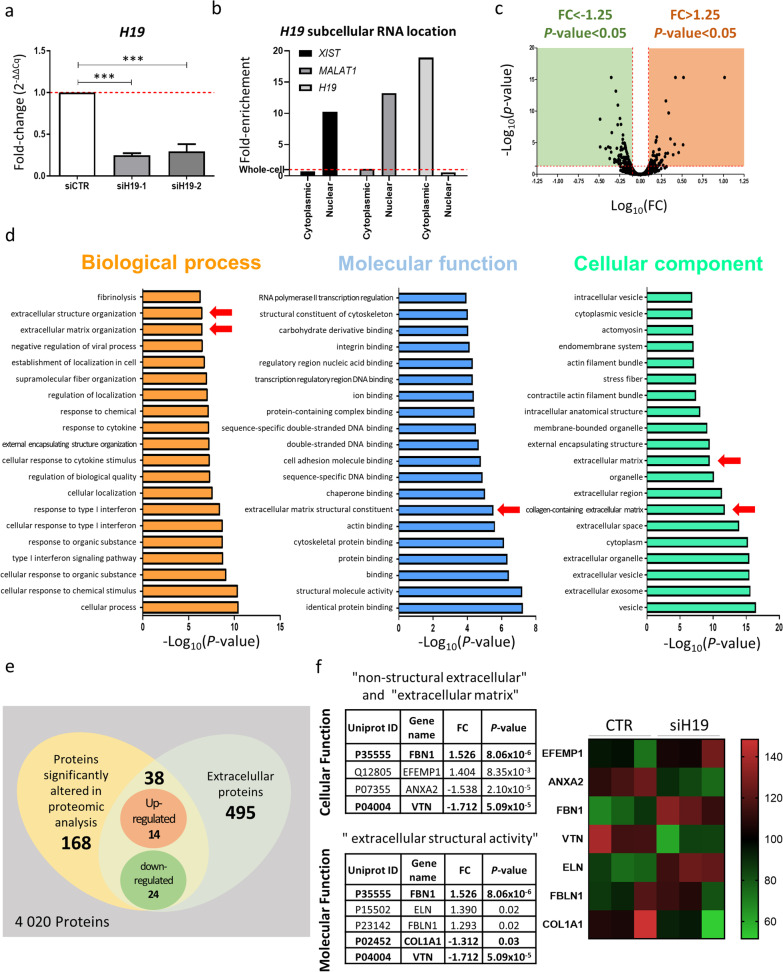
Background: The vast and promising class of long non-coding RNAs (lncRNAs) has been under investigation for distinct therapeutic applications. Nevertheless, their role as molecular drivers of bone regeneration remains poorly studied. The lncRNA H19 mediates osteogenic differentiation of Mesenchymal Stem/Stromal Cells (MSCs) through the control of intracellular pathways. However, the effect of H19 on the extracellular matrix (ECM) components is still largely unknown. This research study was designed to decode the H19-mediated ECM regulatory network, and to reveal how the decellularized siH19-engineered matrices influence MSC proliferation and fate. This is particularly relevant for diseases in which the ECM regulation and remodeling processes are disrupted, such as osteoporosis.
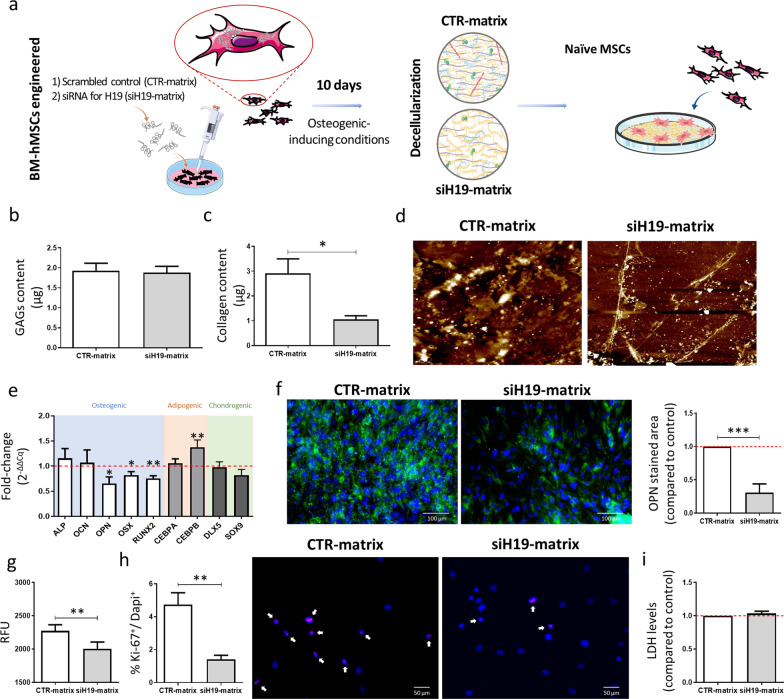
Methods: Mass spectrometry-based quantitative proteomics analysis was used to identify ECM components, after oligonucleotides delivery to osteoporosis-derived hMSCs. Moreover, qRT-PCR, immunofluorescence and proliferation, differentiation and apoptosis assays were performed. Engineered matrices were decellularized, characterized by atomic force microscopy and repopulated with hMSC and pre-adipocytes. Clinical bone samples were characterized by histomorphometry analysis.
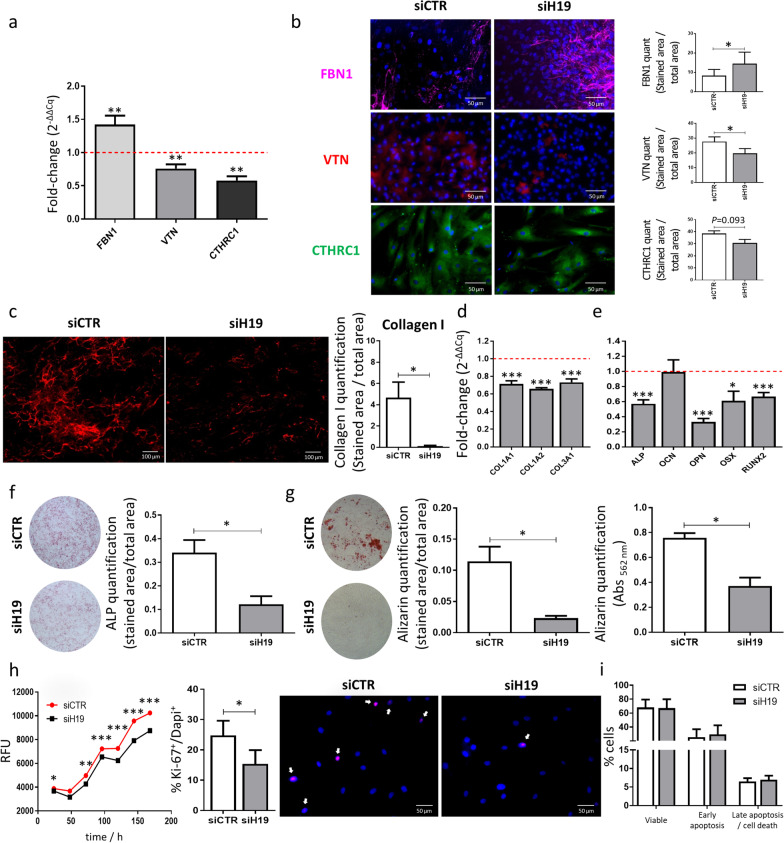
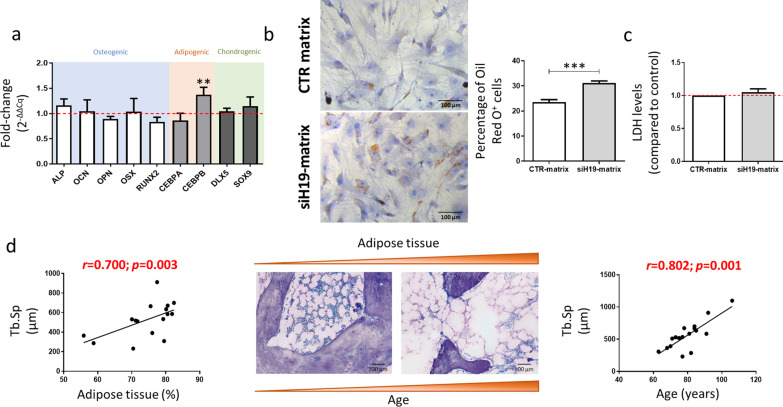
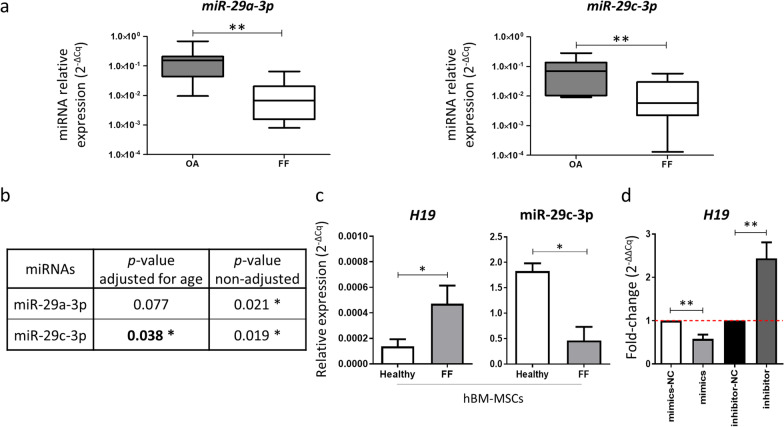
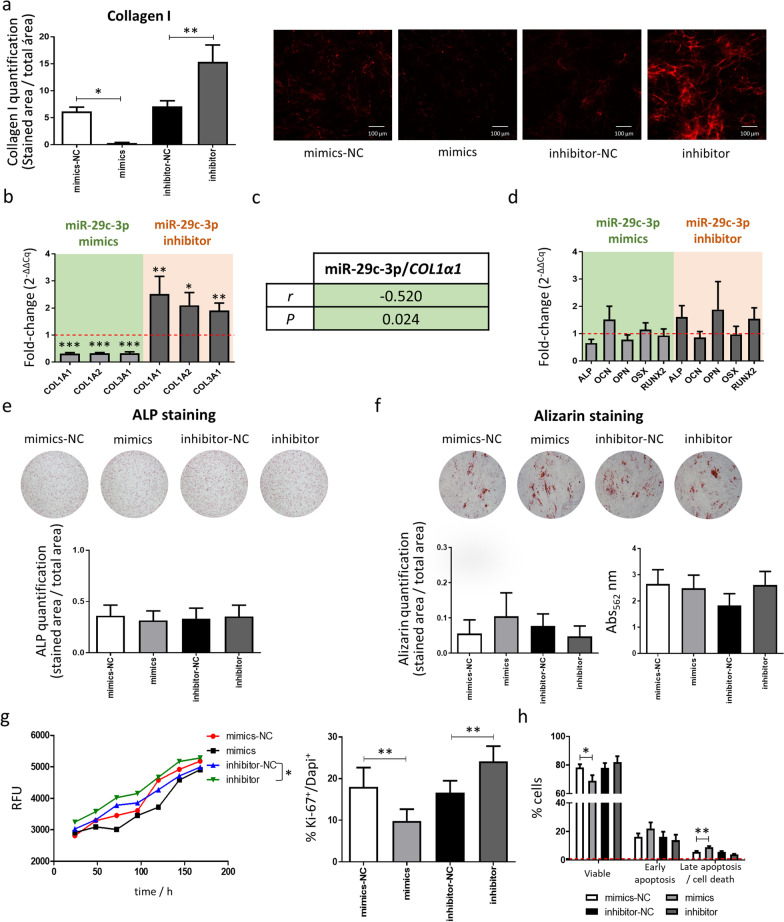
Results: Our study provides an in-depth proteome-wide and matrisome-specific analysis of the ECM proteins controlled by the lncRNA H19. Using bone marrow-isolated MSC from patients with osteoporosis, we identified fibrillin-1 (FBN1), vitronectin (VTN) and collagen triple helix repeat containing 1 (CTHRC1), among others, as having different pattern levels following H19 silencing. Decellularized siH19-engineered matrices are less dense and have a decreased collagen content compared with control matrices. Repopulation with naïve MSCs promotes a shift towards the adipogenic lineage in detriment of the osteogenic lineage and inhibits proliferation. In pre-adipocytes, these siH19-matrices enhance lipid droplets formation. Mechanistically, H19 is targeted by miR-29c, whose expression is decreased in osteoporotic bone clinical samples. Accordingly, miR-29c impacts MSC proliferation and collagen production, but does not influence ALP staining or mineralization, revealing that H19 silencing and miR-29c mimics have complementary but not overlapping functions.
Conclusion: Our data suggest H19 as a therapeutic target to engineer the bone ECM and to control cell behavior.
Keywords: Bone extracellular matrix; Decellularization; Fragility fractures; Gene therapy; Non-coding RNAs.
© 2023. The Author(s).
Conflict of interest statement
The authors declare that they have no competing interests.
Figures
Similar articles
-
LncRNA H19 promotes osteoclast differentiation by sponging miR-29c-3p to increase expression of cathepsin K.Bone. 2025 Mar;192:117340. doi: 10.1016/j.bone.2024.117340. Epub 2024 Nov 29. Bone. 2025. PMID: 39615642
-
The lncRNA H19/miR-541-3p/Wnt/β-catenin axis plays a vital role in melatonin-mediated osteogenic differentiation of bone marrow mesenchymal stem cells.Aging (Albany NY). 2021 Jul 26;13(14):18257-18273. doi: 10.18632/aging.203267. Epub 2021 Jul 26. Aging (Albany NY). 2021. PMID: 34311444 Free PMC article.
-
Long non-coding RNA H19 promotes osteogenic differentiation of human bone marrow-derived mesenchymal stem cells by regulating microRNA-140-5p/SATB2 axis.J Biosci. 2020;45:56. J Biosci. 2020. PMID: 32345782
-
Involvement of the long noncoding RNA H19 in osteogenic differentiation and bone regeneration.Stem Cell Res Ther. 2021 Jan 21;12(1):74. doi: 10.1186/s13287-021-02149-4. Stem Cell Res Ther. 2021. PMID: 33478579 Free PMC article. Review.
-
Role of long non-coding RNA H19 in the development of osteoporosis.Mol Med. 2021 Sep 28;27(1):122. doi: 10.1186/s10020-021-00386-0. Mol Med. 2021. PMID: 34583640 Free PMC article. Review.
Cited by
-
Non-coding RNA modulation in osteoclasts and its implications for osteoblast lineage cell behavior in a co-culture system.Cell Commun Signal. 2025 Aug 12;23(1):370. doi: 10.1186/s12964-025-02324-7. Cell Commun Signal. 2025. PMID: 40797219 Free PMC article.
-
Knockdown of LncRNA H19 inhibits vascularization and endochondral ossification via the MiRNA-21a-5p-Smad7/p-Smad2/3 pathway in fracture repair.Sci Rep. 2025 Jul 18;15(1):26054. doi: 10.1038/s41598-025-11300-7. Sci Rep. 2025. PMID: 40681648 Free PMC article.
-
A first-in-class inhibitor of homologous recombination DNA repair counteracts tumour growth, metastasis and therapeutic resistance in pancreatic cancer.J Exp Clin Cancer Res. 2025 Apr 24;44(1):129. doi: 10.1186/s13046-025-03389-5. J Exp Clin Cancer Res. 2025. PMID: 40275348 Free PMC article.
-
The single-cell transcription reveals the aberrant differentiation trajectory of chondrocytes in the intervertebral disc for congenital scoliosis.iScience. 2025 May 8;28(6):112608. doi: 10.1016/j.isci.2025.112608. eCollection 2025 Jun 20. iScience. 2025. PMID: 40502710 Free PMC article.
-
Stage-specific modulation of multinucleation, fusion, and resorption by the long non-coding RNA DLEU1 and miR-16 in human primary osteoclasts.Cell Death Dis. 2024 Oct 11;15(10):741. doi: 10.1038/s41419-024-06983-1. Cell Death Dis. 2024. PMID: 39389940 Free PMC article.
References
-
- Bartl R, Frisch B. Osteoporosis. Berlin: Springer; 2004.
-
- Hernlund E, et al. Osteoporosis in the European Union: medical management, epidemiology and economic burden. A report prepared in collaboration with the International Osteoporosis Foundation (IOF) and the European Federation of Pharmaceutical Industry Associations (EFPIA) Arch Osteoporos. 2013;8:136. doi: 10.1007/s11657-013-0136-1. - DOI - PMC - PubMed
Publication types
MeSH terms
Substances
LinkOut - more resources
Full Text Sources
Molecular Biology Databases
Miscellaneous
