

Acoustically Evoked Compound Action Potentials Recorded From Cochlear Implant Users With Preserved Acoustic Hearing
- PMID: 36882917
- PMCID: PMC10440213
- DOI: 10.1097/AUD.0000000000001350
Acoustically Evoked Compound Action Potentials Recorded From Cochlear Implant Users With Preserved Acoustic Hearing
Abstract
Objectives: Less traumatic intracochlear electrode design and the introduction of the soft surgery technique allow for the preservation of low-frequency acoustic hearing in many cochlear implant (CI) users. Recently, new electrophysiologic methods have also been developed that allow acoustically evoked peripheral responses to be measured in vivo from an intracochlear electrode. These recordings provide clues to the status of peripheral auditory structures. Unfortunately, responses generated from the auditory nerve (auditory nerve neurophonic [ANN]) are somewhat difficult to record because they are smaller than the hair cell responses (cochlear microphonic). Additionally, it is difficult to completely segregate the ANN from the cochlear microphonic, complicating the interpretation and limiting clinical applications. The compound action potential (CAP) is a synchronous response of multiple auditory nerve fibers and may provide an alternative to ANN where the status of the auditory nerve is of primary interest. This study is a within-subject comparison of CAPs recorded using traditional stimuli (clicks and 500 Hz tone bursts) and a new stimulus (CAP chirp). We hypothesized that the chirp stimulus might result in a more robust CAP than that recorded using traditional stimuli, allowing for a more accurate assessment of the status of the auditory nerve.
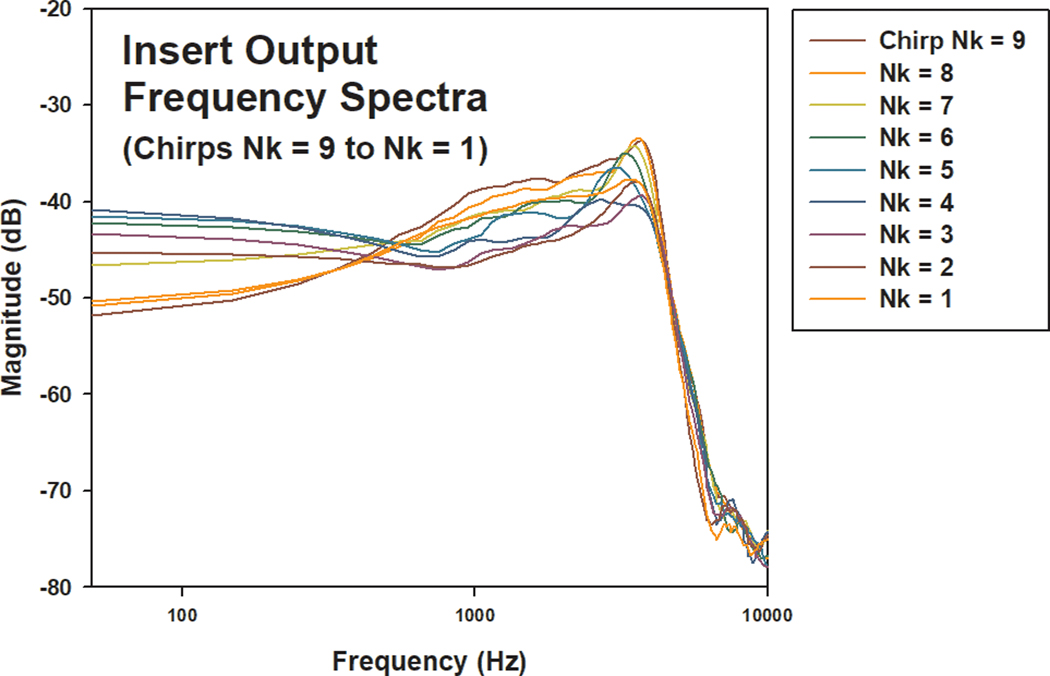
Design: Nineteen adult Nucleus L24 Hybrid CI users with residual low-frequency hearing participated in this study. CAP responses were recorded from the most apical intracochlear electrode using a 100 μs click, 500 Hz tone bursts, and chirp stimuli presented via the insert phone to the implanted ear. The chirp stimulus used in this study was CAP chirp generated using parameters from human-derived band CAPs ( Chertoff et al. 2010 ). Additionally, nine custom chirps were created by systematically varying the frequency sweep rate of the power function used to construct the standard CAP chirp stimulus. CAPs were recorded using all acoustic stimuli, allowing for within-subject comparisons of the CAP amplitude, threshold, percentage of measurable CAP responses, and waveform morphology.
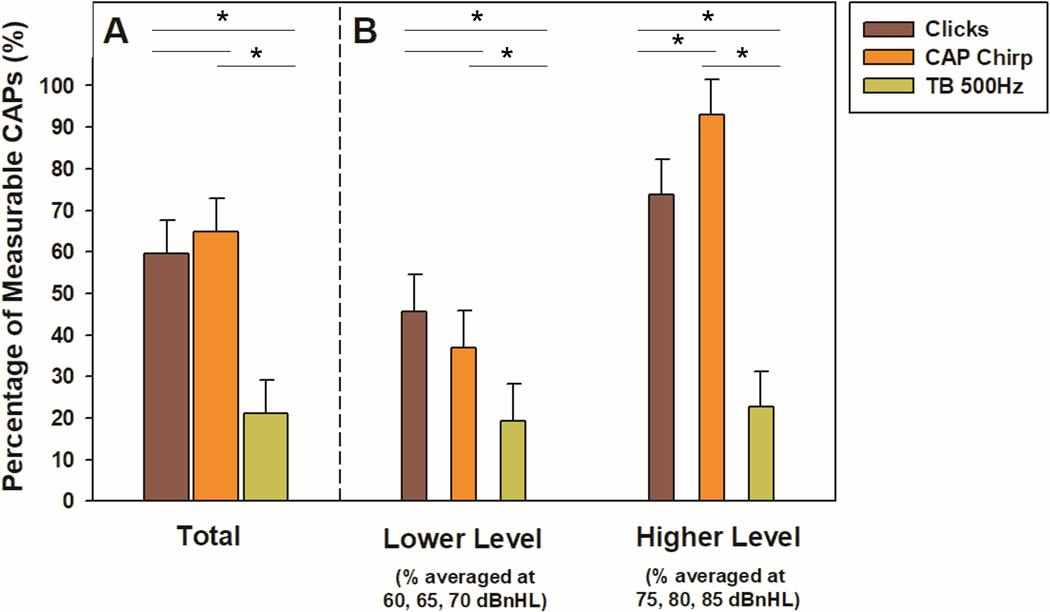
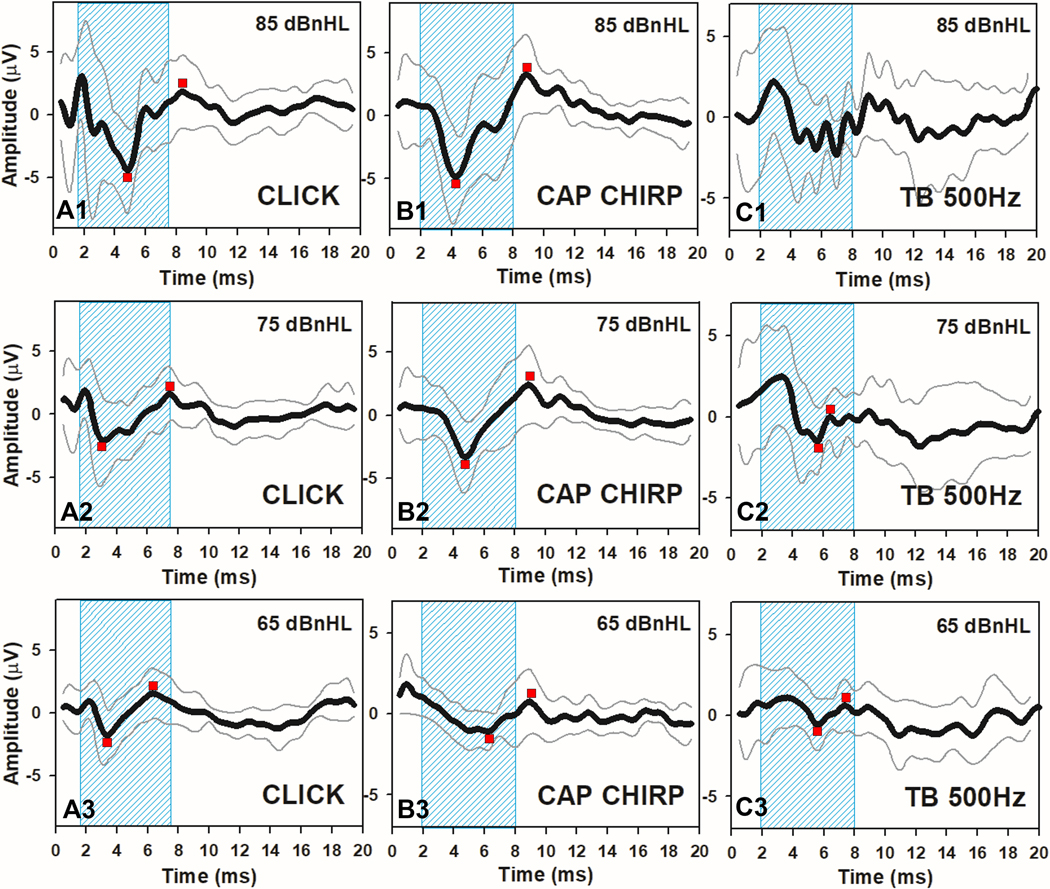
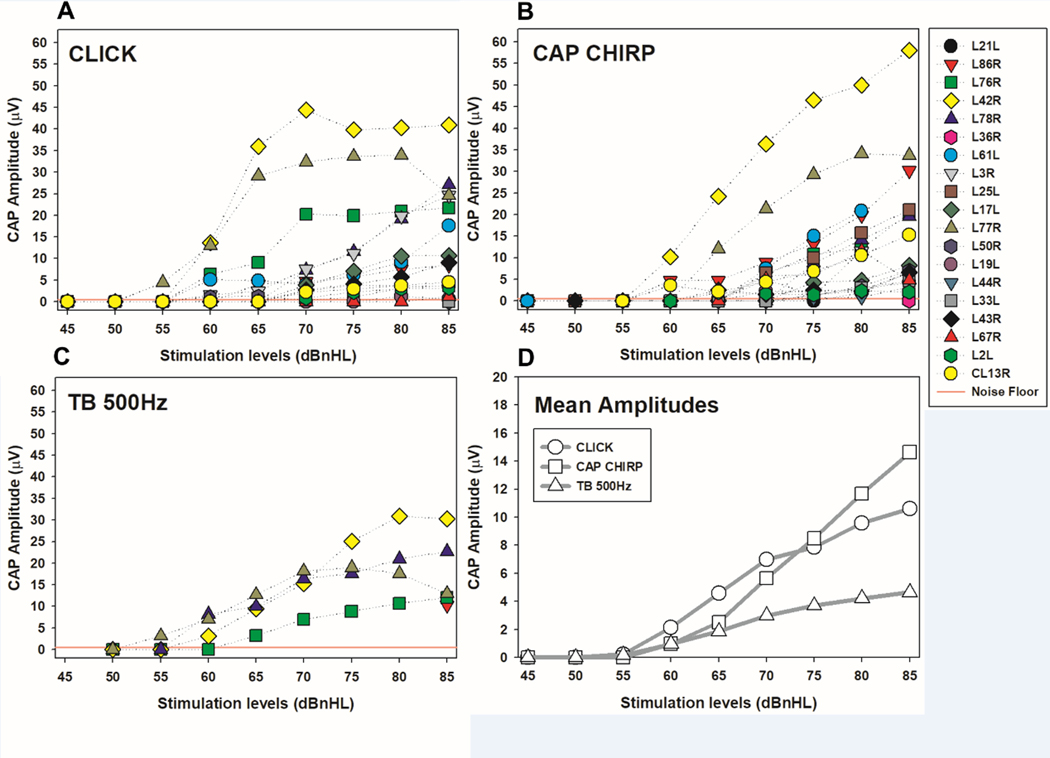
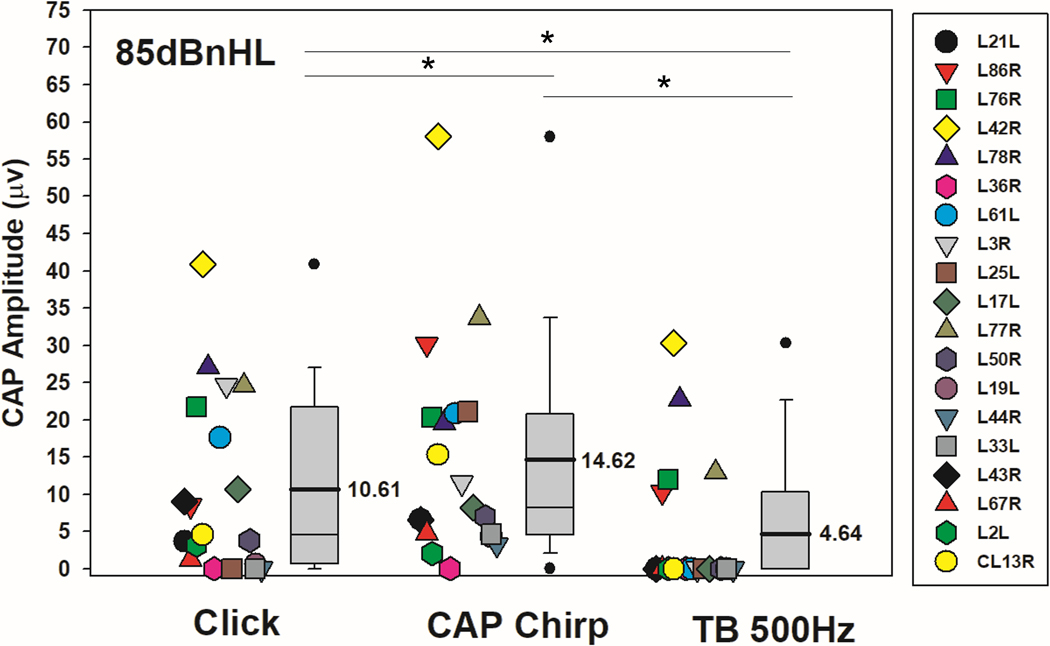
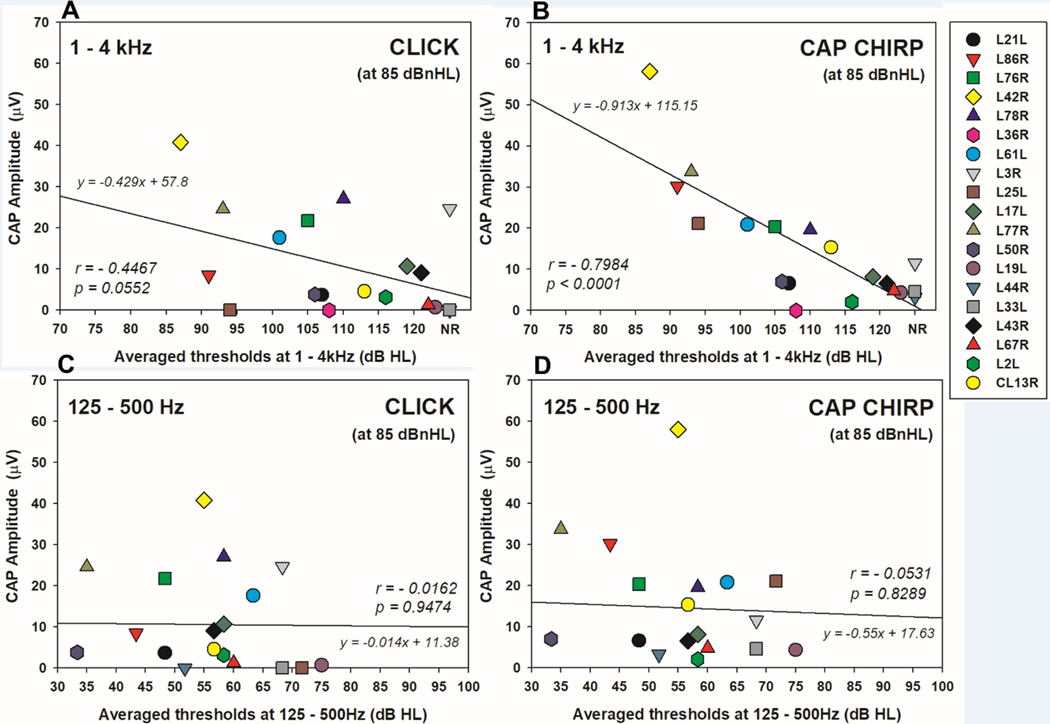
Results: Considerable variation in response morphology was apparent across stimuli and stimulation levels. Clicks and CAP chirp significantly evoked identifiable CAP response more compared to 500 Hz tone bursts. At relatively high stimulation levels, the chirp-evoked CAPs were significantly larger in amplitude and less ambiguous in morphology than the click-evoked CAPs. The status of residual acoustic hearing at high frequencies influenced the likelihood that a CAP could be reliably recorded. Subjects with better preserved hearing at high frequencies had significantly larger CAP amplitudes when CAP chirp was used. Customizing the chirp stimulus by varying the frequency sweep rates significantly affected the CAP amplitudes; however, pairwise comparisons did not show significant differences between chirps.
Conclusions: CAPs can be measured more effectively using broadband acoustic stimuli than 500 Hz tone bursts in CI users with residual low-frequency acoustic hearing. The advantage of using CAP chirp stimulus relative to standard clicks is dependent on the extent of preserved acoustic hearing at high frequencies and the stimulus level. The chirp stimulus may present an attractive alternative to standard clicks or tone bursts for this CI population when the goal is to record robust CAP responses.
Copyright © 2023 Wolters Kluwer Health, Inc. All rights reserved.
Conflict of interest statement
The authors have no conflicts of interest to disclose.
Figures


References
-
- Campbell Bester, Iseli, et al. (2017). Electrophysiological Evidence of the Basilar-Membrane Travelling Wave and Frequency Place Coding of Sound in Cochlear Implant Recipients. Audiol Neurootol, 22, 180–189. - PubMed
-
- Campbell Kaicer, Briggs, et al. (2015). Cochlear response telemetry: intracochlear electrocochleography via cochlear implant neural response telemetry pilot study results. Otol Neurotol, 36, 399–405. - PubMed
-
- Cebulla Elberling. (2010). Auditory brain stem responses evoked by different chirps based on different delay models. J Am Acad Audiol, 21, 452–460. - PubMed
-
- Cebulla Lurz, Shehata-Dieler. (2014). Evaluation of waveform, latency and amplitude values of chirp ABR in newborns. Int J Pediatr Otorhinolaryngol, 78, 631–636. - PubMed
Publication types
MeSH terms
Grants and funding
LinkOut - more resources
Full Text Sources
Medical
Miscellaneous
