. 2023 Mar 8;290(1994):20222108.
doi: 10.1098/rspb.2022.2108. Epub 2023 Mar 8.

The effectiveness of pseudomagic traits in promoting premating isolation

Affiliations

The effectiveness of pseudomagic traits in promoting premating isolation

Thomas G Aubier et al. Proc Biol Sci. .

Abstract

Upon the secondary contact of populations, speciation with gene flow is greatly facilitated when the same pleiotropic loci are both subject to divergent ecological selection and induce non-random mating, leading to loci with this fortuitous combination of functions being referred to as 'magic trait' loci. We use a population genetics model to examine whether 'pseudomagic trait' complexes, composed of physically linked loci fulfilling these two functions, are as efficient in promoting premating isolation as magic traits. We specifically measure the evolution of choosiness, which controls the strength of assortative mating. We show that, surprisingly, pseudomagic trait complexes, and to a lesser extent also physically unlinked loci, can lead to the evolution of considerably stronger assortative mating preferences than do magic traits, provided polymorphism at the involved loci is maintained. This is because assortative mating preferences are generally favoured when there is a risk of producing maladapted recombinants, as occurs with non-magic trait complexes but not with magic traits (since pleiotropy precludes recombination). Contrary to current belief, magic traits may not be the most effective genetic architecture for promoting strong premating isolation. Therefore, distinguishing between magic traits and pseudomagic trait complexes is important when inferring their role in premating isolation. This calls for further fine-scale genomic research on speciation genes.

Keywords: mate choice; mathematical model; recombination; secondary contact; speciation; third-order linkage disequilibrium.


Conflict of interest statement

We declare we have no competing interests.

Figures

Figure 1.
Figure 1.
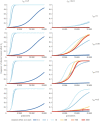
Population divergence depending on genetic architecture and choosiness. We represent the equilibria reached in the two populations after secondary contact for a range of values of choosiness α1 (assuming that allele C2 is absent) and recombination rates rET, with initial maximum linkage disequilibrium between the E and T loci. We do not represent cases where polymorphism is lost at the T locus (for very low or very high choosiness, as shown where lines end, where frequencies actually fall to zero). (a) The equilibrium frequencies e2,k of allele E2 in each population k. (b) The equilibrium frequencies t2,k of allele T2 in each population k. Double-headed arrows are placed at the choosiness value maximizing divergence at the E and T loci in (a) and (b), respectively. Single-headed arrows correspond to ESS choosiness values that are favoured for rTC = 0.01 (see figure 2). In (b), the double-headed arrows overlap. Note that the divergence-maximizing choosiness (double-headed arrows) and the ESS choosiness (single-headed arrows) do not have the same value, unless rET = 0; this means that additional evolutionary forces, specific to the case where rET > 0 and which are the focus of our study, come into play. See ref. [23] for explanations on the divergence pattern. Here, m = 0.01, s = 0.05.
Figure 2.
Figure 2.
Choosiness at the evolutionary equilibrium depending on the level of gene flow and genetic architecture. We represent the evolutionary stable choosiness, αESS, depending on the selection coefficient (s), the migration rate (m) and the recombination rates (rET and rTC). The case of rET = 0 can be interpreted as a magic trait (remember that we assume that loci E and T are at maximum linkage disequilibrium, initially). For a given combination of parameters (s, m), an intermediate rET leads to the highest ESS choosiness; if rET is too small, three-way linkage disequilibrium and its effect on the evolution of high choosiness (as detailed in the main text) are too weak, and if rET is too high, recombination breaks linkage disequilibrium that causes indirect selection on choosiness (as detailed in electronic supplementary material, figures S1 and S2). For rTC = 0.5, changes in the recombination rate rET lead to slight changes in the ESS choosiness that are not visible here; in particular, for high ratio s/m, a non-magic trait complex (rET > 0) can lead to a higher choosiness at evolutionary equilibrium than can be found with a magic trait (rET = 0) (see electronic supplementary material, figure S7). The higher choosiness allowed by non-magic trait complexes results in stronger reproductive isolation, as measured by a lower effective migration rate (see electronic supplementary material, figure S8).
Figure 3.
Figure 3.
Choosiness at the evolutionary equilibrium depending on the magnitude of the three-way linkage disequilibrium that is removed artificially over the course of simulations. In (a), we show the evolutionary stable choosiness, αESS, depending on the recombination rate rET and the proportion of the three-way linkage disequilibrium, DETC, removed artificially in the simulation. Over the course of the simulations, we reduce the magnitude of the three-way linkage disequilibrium by an amount that depends on the value Φ represented on the horizontal axis. At the end of each generation, we artificially reduce three-way linkage disequilibrium by transforming three-way linkage disequilibrium in each population k according to DETC, k=ΦDETC, magic, k+(1Φ)DETC, k, with DETC,magic,k = min [DTC,k(1 − 2t2,k), DEC,k(1 − 2e2,k)] being the equivalent measure to the three-way linkage disequilibrium if that formula were applied to the case of a magic trait. For Φ=1, we thus artificially set the three-way linkage disequilibrium to its lowest possible value. In (b) and (c), we represent the first-order contributions of indirect sexual selection (in green), indirect viability selection (in orange) and indirect epistatic selection (in purple), to the evolution of stronger choosiness than the ESS choosiness value favoured in the case of a magic trait, αESS,magic, depending on whether the three-way linkage disequilibrium is reduced to its lowest possible value over the course of simulations (c) or not (b). Choosiness α1 is set to be the ESS choosiness value obtained for rET = 0 (α1 = αESS,magic). For each combination of parameters, we know if a choosier allele C2, coding for α2 = α1 + 1, will increase or decrease in frequency based on the ESS value we were able to determine in the analysis done in (a). We, therefore, implement C2 at a frequency equal to 0.01 if it is destined to increase in frequency, or equal to 0.99 if it is destined to decrease in frequency. Over the course of the simulation, we measure the mean first-order contributions of linkage disequilibria to Δc2,2, corresponding to the first three terms of equation (2.1), while the frequency of the choosier allele c2,2 is between 0.05 and 0.95. These first-order contributions of linkage disequilibria correspond to first-order approximations of the effect of indirect sexual selection, indirect viability selection and indirect epistatic selection on the change in frequency of the choosier allele. See electronic supplementary material, figures S1 and S2 for more details on the effect of rET on the contributions of selection to the evolution of choosiness, shown in (b). Here, m = 0.01, s = 0.05 and rTC = 0.01. In (b) and (c), αESS,magic = 6.54 (estimated numerically; see position of the red squares in (a)).
Figure 4.
Figure 4.
Time series of the invasion of mutant alleles at the choosiness locus for different mutation effect sizes and different genetic architectures. Choosiness α1 is set to be the lowest choosiness value that maintains polymorphism at the T locus for all recombination rates tested (α1 = 0.13; estimated numerically). We then show the invasion in population 2 of a mutant allele coding for a choosiness α2 = α1 + Δα. We observe the same invasion dynamics in population 1 (not shown). Brackets show the time points where choosiness becomes a neutral trait because polymorphism at the T locus is lost (bottom right panel). Here, m = 0.01 and s = 0.05.

Similar articles

References

    1. Jiang Y, Bolnick DI, Kirkpatrick M. 2013. Assortative mating in animals. Am. Nat. 181, E125-E138. (10.1086/670160) - DOI - PubMed
    1. Janicke T, Marie-Orleach L, Aubier TG, Perrier C, Morrow EH. 2019. Assortative mating in animals and its role for speciation. Am. Nat. 194, 865-875. (10.1086/705825) - DOI - PubMed
    1. Weis AE, Nardone E, Fox GA. 2014. The strength of assortative mating for flowering date and its basis in individual variation in flowering schedule. J. Evol. Biol. 27, 2138-2151. (10.1111/jeb.12465) - DOI - PubMed
    1. Rubin MJ, Schmid KM, Friedman J. 2019. Assortative mating by flowering time and its effect on correlated traits in variable environments. Ecol. Evol. 9, 471-481. (10.1002/ece3.4765) - DOI - PMC - PubMed
    1. Coyne JA, Orr HA. 2004. Speciation. Sunderland, MA: Sinauer Associates.

Publication types

LinkOut - more resources