. 2023 Mar 31;132(7):828-848.
doi: 10.1161/CIRCRESAHA.122.321448. Epub 2023 Mar 8.

Integrated Proteomics Unveils Nuclear PDE3A2 as a Regulator of Cardiac Myocyte Hypertrophy

Affiliations

Integrated Proteomics Unveils Nuclear PDE3A2 as a Regulator of Cardiac Myocyte Hypertrophy

Gunasekaran Subramaniam et al. Circ Res. .

Abstract

Background: Signaling by cAMP is organized in multiple distinct subcellular nanodomains regulated by cAMP-hydrolyzing PDEs (phosphodiesterases). Cardiac β-adrenergic signaling has served as the prototypical system to elucidate cAMP compartmentalization. Although studies in cardiac myocytes have provided an understanding of the location and properties of a handful of cAMP subcellular compartments, an overall view of the cellular landscape of cAMP nanodomains is missing.

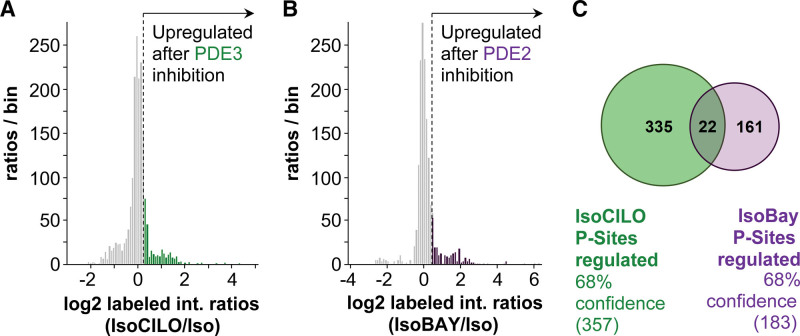
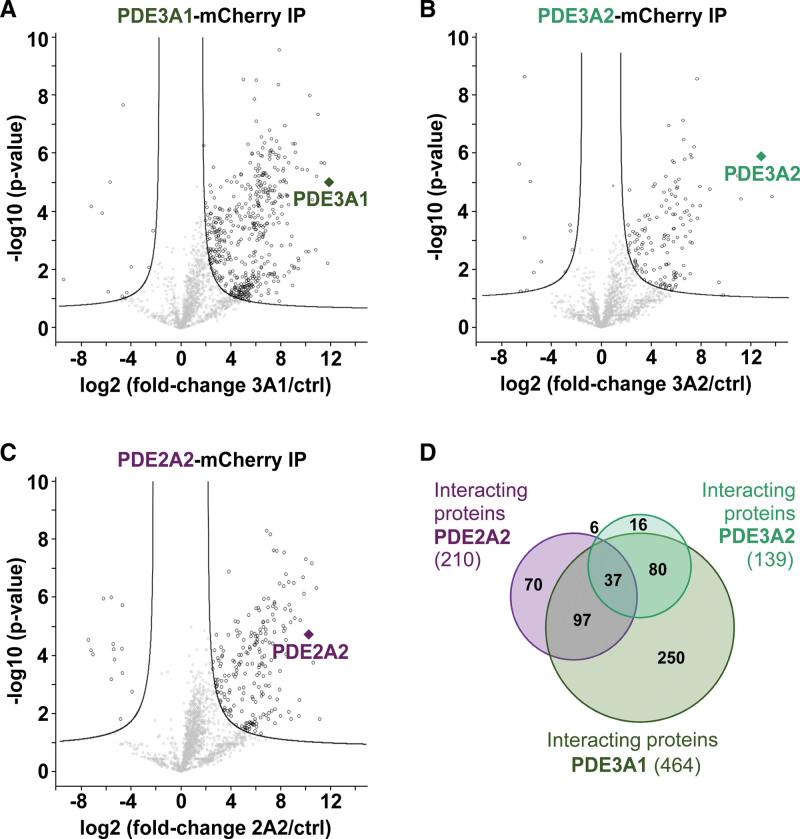
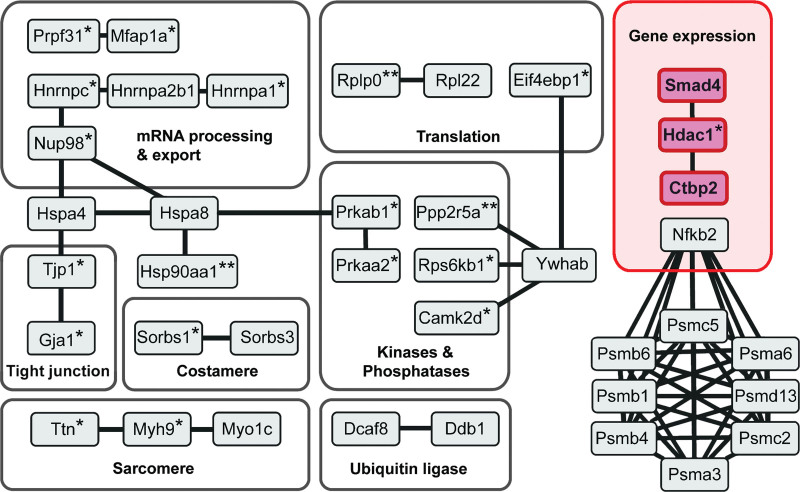
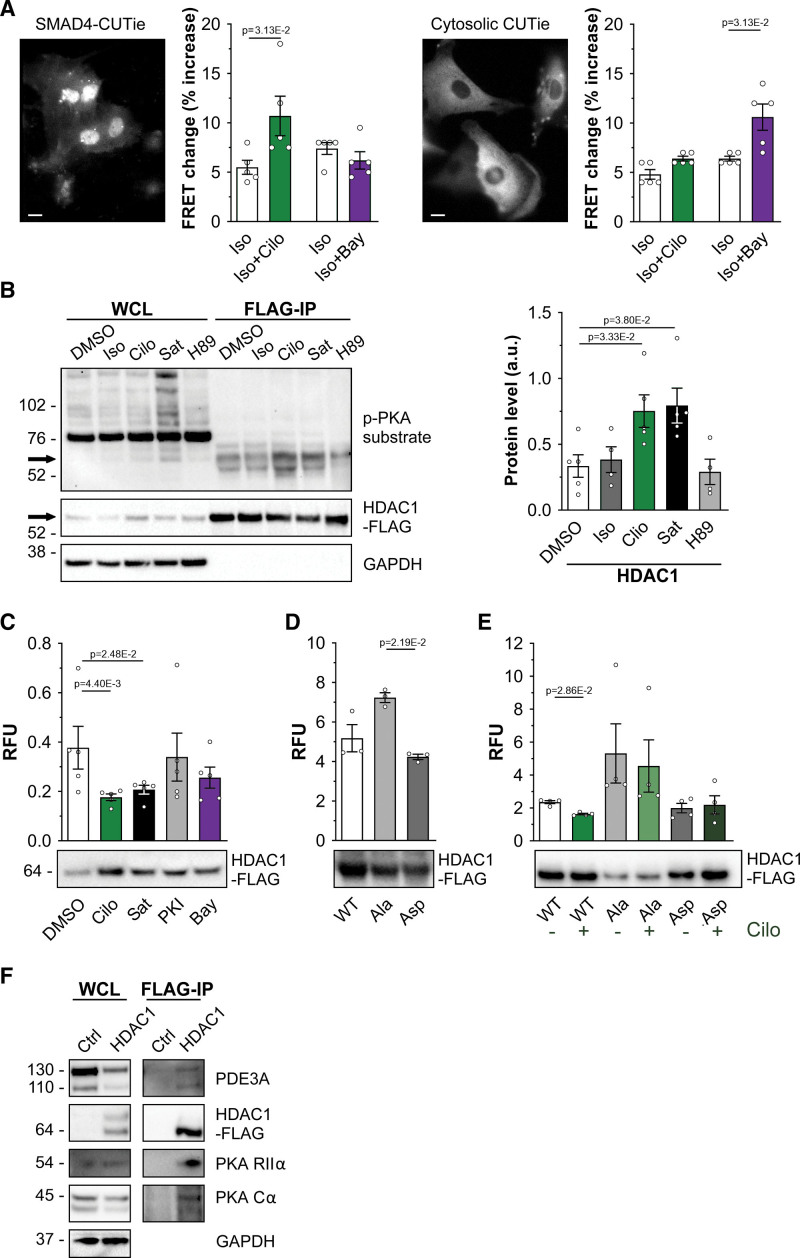
Methods: Here, we combined an integrated phosphoproteomics approach that takes advantage of the unique role that individual PDEs play in the control of local cAMP, with network analysis to identify previously unrecognized cAMP nanodomains associated with β-adrenergic stimulation. We then validated the composition and function of one of these nanodomains using biochemical, pharmacological, and genetic approaches and cardiac myocytes from both rodents and humans.

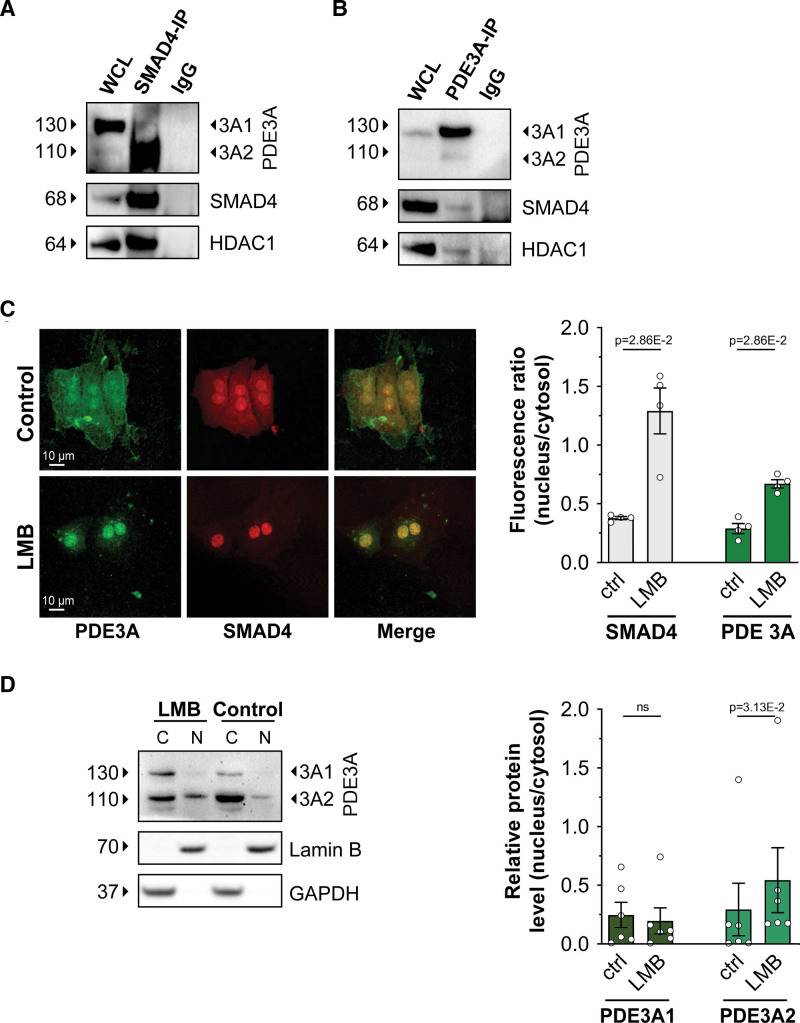
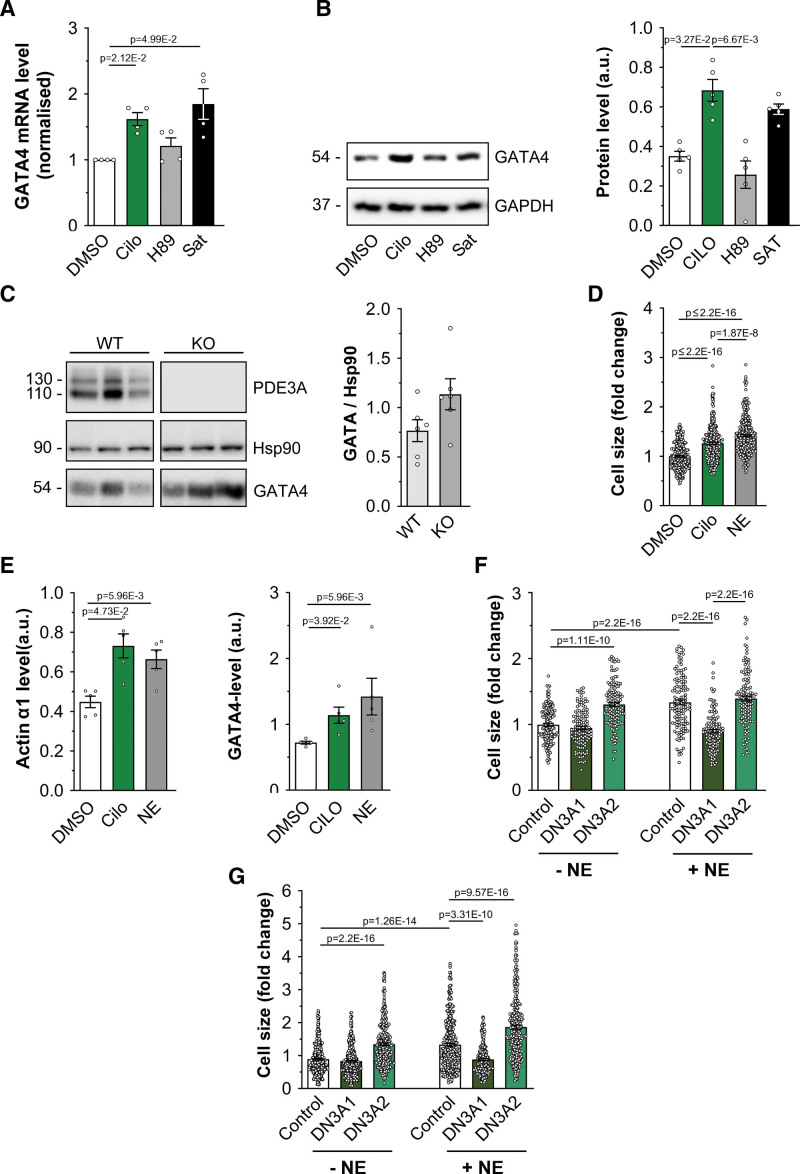
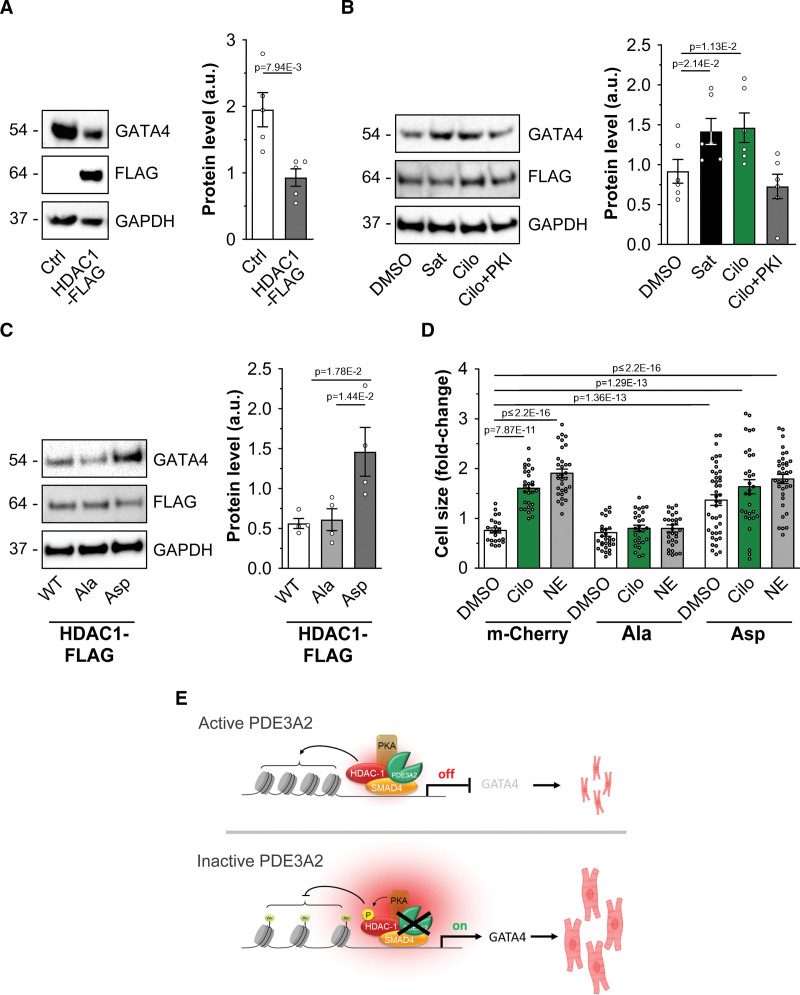
Results: We demonstrate the validity of the integrated phosphoproteomic strategy to pinpoint the location and provide critical cues to determine the function of previously unknown cAMP nanodomains. We characterize in detail one such compartment and demonstrate that the PDE3A2 isoform operates in a nuclear nanodomain that involves SMAD4 (SMAD family member 4) and HDAC-1 (histone deacetylase 1). Inhibition of PDE3 results in increased HDAC-1 phosphorylation, leading to inhibition of its deacetylase activity, derepression of gene transcription, and cardiac myocyte hypertrophic growth.

Conclusions: We developed a strategy for detailed mapping of subcellular PDE-specific cAMP nanodomains. Our findings reveal a mechanism that explains the negative long-term clinical outcome observed in patients with heart failure treated with PDE3 inhibitors.

Keywords: adrenergic agents; hypertrophy; phosphoric diester hydrolases; protein isoforms; rodentia.


Conflict of interest statement

None.

Figures

Figure 1.
Figure 1.
Analysis of the β-adrenergic phosphoproteome selectively elicited by inhibition of PDE3 (phosphodiesterase 3) or PDE2A. A, Frequency distributions of log2 intensity ratios to illustrate thresholding of PDE3-dependent and PDE2A-dependent (B) phosphoproteomics data for pathway analysis. The top 16% quantified phosphopeptides (highlighted in green and purple for PDE3A and PDE2A, respectively) were carried forward for further analysis. C, Venn diagram comparing the 16% upregulated phosphorylation sites in samples treated with the PDE3 inhibitor (green) or the PDE2A inhibitor (purple). The CI (68%) derives from the selected peptides lying outside 1 SD of the mean distribution of peptides, as shown in A and B, respectively. BAY indicates BAY 60-7550; Cilo, cilostamide; and Iso, isoproterenol.
Figure 2.
Figure 2.
Analysis of the PDE3A1 (phosphodiesterase 3A1), PDE3A2, and PDE2A2 interactomes. A, Volcano plot of the PDE3A1-mCherry interactome (false discovery rate [FDR], 0.03; S-zero is the fold-change threshold [S0], 1.3). B, PDE3A2-mCherry interactome (FDR, 0.05; S0, 0.8). C, PDE2A2-mCherry interactome (FDR, 0.03; S0, 1.3). D, Area-proportional Venn diagram to compare significant interactors in PDE3A1, PDE3A2, and PDE2A2 affinity purifications.
Figure 3.
Figure 3.
Nuclear protein interaction network shared by PDE3A1 (phosphodiesterase 3A1) and PDE3A2. Functional and physical interaction network of PDE3A1/A2 interactors and phosphorylated downstream proteins generated with the STRING software. All proteins shown have been identified experimentally either in the cilostamide-dependent phosphoproteome or in the interactome shared by PDE3A1 and PDE3A2. *Proteins found in the cilostamide-dependent PDE3A phosphoproteome. **Proteins that are both in the cilostamide-dependent phosphoproteome and in the PDE3A isoform interactomes.
Figure 4.
Figure 4.
PDE3A (phosphodiesterase 3A) isoforms are in a nuclear complex involving SMAD4 (SMAD family member 4) and HDAC-1 (histone deacetylase 1). A, Western blot analysis showing PDE3A2 and HDAC-1 in the pull down of endogenous SMAD4 obtained from neonatal rat ventricular myocyte (NRVM) cell lysates. Representative of n=3 independent cultures. B, Detection of endogenous SMAD4 and HDAC-1 in the immunoprecipitate obtained by pulling down endogenous PDE3A from NRVM lysates. n=3. C, Immunostaining of endogenous PDE3A and SMAD4 in NRVM cells treated either with DMSO (control) or with leptomycin B (LMB; 100 nmol/L) for 3 hours. Quantification of fluorescence intensity is shown on the right. n=4 independent experiments (at least 15 cells per experiment). Mann-Whitney U test. D, Western blot analysis showing endogenous PDE3A1 and PDE3A2 in the nuclear (N) and cytoplasmic (C) fractions obtained from NRVM treated with 100 nmol/L LMB or dimethyl sulfoxide (DMSO) (control) for 3 hours. Densitometric quantification is shown on the right. Values are shown as relative to the cytosolic content and are presented as mean±SEM. n=6 biological replicates. Wilcoxon matched pairs signed-rank test. WCL indicates whole-cell lysate.
Figure 5.
Figure 5.
Inhibition of PDE3A (phosphodiesterase 3A) leads to HDAC-1 (histone deacetylase 1) phosphorylation and inhibition of HDAC-1 deacetylase activity. A, Representative images showing the distribution of SMAD4 (SMAD family member 4)–cAMP universal tag for imaging experiments (CUTie) and CUTie reporters in neonatal rat ventricular myocytes (NRVMs) treated with 100 nmol/L leptomycin B (LMB) for 3 hours. Summaries of the Förster resonance energy transfer (FRET) change detected with the 2 sensors in NRVM on application of 0.5 nmol/L isoproterenol (ISO) followed by 10 μmol/L cilostamide (Cilo) or 100 nmol/L BAY 60-7550 (BAY) are shown on the right and are expressed as percent increase over baseline. n=5 independent NRVM preparations. Wilcoxon matched pairs signed-rank test. B, Representative Western blot showing PKA (protein kinase A)-dependent phosphorylation of HDAC-1 (left) and densitometric analysis of 5 independent experiments (right). HDAC-1-Flag was immunoprecipitated from lysates obtained from NRVM treated with 0.5 nmol/L ISO, 10 μmol/L PDE3 inhibitor Cilo, a saturating cAMP stimulus (Sat, 100 μmol/L 3-isobutyl-1-methylxanthine [IBMX] and 25 μmol/L forskolin), or with 30 μmol/L PKA inhibitor H89. Phosphorylation level was detected with a phospho-PKA substrate antibody. For quantification, values were normalized to the amount of HDAC-Flag in the immunoprecipitates and are presented as mean±SEM. Kruskal-Wallis test with Dunn correction for multiple comparisons. C, Deacetylase activity of HDAC-1-Flag immunoprecipitated from NRVMS cells treated for 45 minutes with 10 μmol/L Cilo (Sat, 20 μmol/L cell-permeable PKA inhibitor [PKI]) or 1 μmol/L BAY. HDAC-1 activity is normalized to the relative amount of HDAC-1-Flag present in every sample (as shown in a representative Western blot in the bottom) and is presented as mean±SEM. n=5 biological replicates. Kruskal-Wallis test with Dunn correction for multiple comparisons. D, Deacetylase activity measured in HDAC-1-Flag pull downs obtained from Human Embryonic Kidney cells 293 (HEK293) expressing wild type (WT) HDAC-1-Flag and the mutants HDAC-1S406A, S436A-Flag (Ala) or HDAC-1S406D, S436D-Flag (Asp). Quantification as in C. n=3 independent experiments. Kruskal-Wallis test with Dunn correction for multiple comparisons. E, Deacetylase activity measured in HDAC-1-Flag pull downs obtained from NRVM expressing WT, Ala, or Asp mutants. Quantification as in C. n=4 independent experiments. Mann-Whitney U test. F, Western blot analysis showing PDE3A, PKA regulatory (RIIα) and catalytic (Cα) subunits in the FLAG pull down obtained from lysates of NRVM expressing HDAC-1-Flag. Representative of 3 independent experiments. RFU indicates relative fluorescence unit.
Figure 6.
Figure 6.
Inhibition of PDE3A (phosphodiesterase 3A) regulates GATA4 (GATA4 binding protein 4) expression. A, Quantitative real-time polymerase chain reaction analysis of GATA4 mRNA transcripts in neonatal rat ventricular myocyte (NRVM) cells treated with 10 μM cilostamide (Cilo), saturating treatment (Sat, 100 μmol/L 3-isobutyl-1-methylxanthine [IBMX] and 25 μmol/L forskolin) or 30 μmol/L H89 for 2.5 hours. Bars show GATA4 mRNA values normalized to GAPDH and dimethyl sulfoxide (DMSO) treatment and are presented as mean±SEM. n=4 biological replicates. Kruskal-Wallis test with Dunn correction for multiple comparisons. B, Western blot analysis and quantification of GATA4 protein expression in NRVM cells treated with Cilo (10 μmol/L), H89 (30 μmol/L), or saturating treatment. GAPDH served as a loading control. Values are normalized to GAPDH and are presented as mean±SEM. n=5 biological replicates. Kruskal-Wallis test with Dunn correction for multiple comparisons. C, Western blot analysis and quantification of endogenous GATA4 expression in cardiac tissue lysates obtained from PDE3A knockout or wild-type control rats. Hsp90 served as a loading control and for normalization in the quantification. Values are mean±SEM. n=6 biological replicates. Mann-Whitney U test. D, Cell size measured in adult rat ventricular myocytes (ARVMs) either untreated or treated with Cilo (10 mmol/L) or NE (10 μmol/L) for 24 hours. Values are normalized to DMSO control and expressed as mean±SEM. n=5 independent experiments (at least 241 cells per condition). Normality of log-transformed data was tested with Anderson-Darling test. P values were determined by a hierarchical significance test using log-transformed data followed by Bonferroni correction. E, Quantification by Western blot analysis of hypertrophy markers protein expression level in samples as shown in D. n=5 independent experiments. Kruskal-Wallis test with Dunn's correction. F, Cell size measured in ARVM expressing mCherry (control) or the catalytically inactive mutant PDE3A1-DN-RFP or PDE3A2-DN-RFP (left) and treated as indicated for 24 hours. n=5 independent experiments (at least 53 cells per condition). Normality was established by the Anderson-Darling test. Hierarchical significance analysis with final Bonferroni correction for multiple comparisons. G, Cell size measured in human induced pluripotent stem cell-derived cardiomyocytes (hiPSC-CM) expressing mCherry (control) or the catalytically inactive mutant PDE3A1-DN-RFP or PDE3A2-DN-RFP (left) and treated as indicated for 48 hours. n=6 independent experiments (6 different differentiations of 3 independent hiPSC lines, at least 231 cells per condition). P values were determined by hierarchical significance test using log-transformed data followed by Bonferroni correction.
Figure 7.
Figure 7.
Inhibition of PDE3A (phosphodiesterase 3A) affects cardiac myocyte hypertrophic growth. A, Western blot analysis and densitometric quantification of GATA4 (GATA binding protein 4) expression in cells overexpressing HDAC-1 (histone deacetylase 1)-Flag. Values are normalized to GAPDH and presented as mean±SEM. n=5 biological replicates. Mann-Whitney U test. B, Western blot analysis and quantification showing expression of GATA4 in neonatal rat ventricular myocyte (NRVM) cells overexpressing HDAC-1-Flag and treated with cilostamide (Cilo; 10 μmol/L), saturating cAMP (Sat, 100 μmol/L 3-isobutyl-1-methylxanthine [IBMX] and 25 μmol/L forskolin) of PKA inhibitor (PKI; 20 μmol/L). n=6 biological replicates. Values are normalized to GAPDH and to Flag signal and are presented as mean±SEM. Friedman test and Dunn correction for multiple comparisons. C, Western blot analysis and quantification showing expression of GATA4 in NRVM cells overexpressing HDAC-1-Flag (wild type [WT]), the phospho-null mutant HDAC-1S406A-S436A-Flag (Ala), or the phospho-mimic mutant HDAC-1S406D-S436D-Flag (Asp). GAPDH was used as a loading control. For quantification, values were normalized to GAPDH and Flag signal and are expressed as means±SEM. n=5 independent experiments. Kruskal-Wallis test with Dunn's correction for multiple comparisons. D, Cell size measured in NRVM expressing mCherry, HDAC-1S406A-S436A-Flag (S>A), or HDAC-1S406D-S436D-Flag (S>D) and treated with DMSO, Cilo (10 μmol/L), or NE (10 μmol/L) for 48 hours. Values are expressed as fold change relative to untransfected and dimethyl sulfoxide (DMSO) treated within the same transfection group and are presented as mean±SEM. n=6 independent experiments (6 different differentiations from 3 independent human induced pluripotent stem cell lines, at least 27 cells per condition). Anderson-Darling log normality test and hierarchical analysis of log-transformed data followed by Bonferroni correction. E, Schematic illustration of the PDE3A/SMAD4 (SMAD family member 4)/HDAC-1 nuclear ND. Top, With active PDE3A2 at the SMAD4/HDAC-1 nuclear complex cAMP levels are locally low and PKA (protein kinase A) is inactive. HDAC-1 deacetylates histones, repressing expression of prohypertrophic genes. Bottom, Inhibition of PDE3A or displacement of PDE3A2 results in a local increase in cAMP, activation of local PKA, and phosphorylation of HDAC-1, leading to inhibition of its deacetylase activity. As a result, transcription of prohypertrophic genes is enhanced, leading to cardiac myocyte hypertrophy. Some elements used in E have been generated using BioRender.com.

References

    1. Maurice DH, Ke H, Ahmad F, Wang Y, Chung J, Manganiello VC. Advances in targeting cyclic nucleotide phosphodiesterases. Nat Rev Drug Discov. 2014;13:290–314. doi: 10.1038/nrd4228 - PMC - PubMed
    1. Kokkonen K, Kass DA. Nanodomain regulation of cardiac cyclic nucleotide signaling by phosphodiesterases. Annu Rev Pharmacol Toxicol. 2017;57:455–479. doi: 10.1146/annurev-pharmtox-010716-104756 - PubMed
    1. Zaccolo M, Zerio A, Lobo MJ. Subcellular organization of the cAMP signaling pathway. Pharmacol Rev. 2021;73:278–309. doi: 10.1124/pharmrev.120.000086 - PMC - PubMed
    1. Surdo NC, Berrera M, Koschinski A, Brescia M, Machado MR, Carr C, Wright P, Gorelik J, Morotti S, Grandi E, et al. . FRET biosensor uncovers cAMP nano-domains at beta-adrenergic targets that dictate precise tuning of cardiac contractility. Nat Commun. 2017;8:15031. doi: 10.1038/ncomms15031 - PMC - PubMed
    1. Bock A, Annibale P, Konrad C, Hannawacker A, Anton SE, Maiellaro I, Zabel U, Sivaramakrishnan S, Falcke M, Lohse MJ. Optical mapping of cAMP signaling at the nanometer scale. Cell. 2020;182:1519–1530.e17. doi: 10.1016/j.cell.2020.07.035 - PMC - PubMed

Publication types