

Seasonal variation in blood pressure control across US health systems
- PMID: 36883471
- PMCID: PMC10714346
- DOI: 10.1097/HJH.0000000000003396
Seasonal variation in blood pressure control across US health systems
Abstract
Objective: We aimed to characterize seasonal variation in US population-based blood pressure (BP) control and BP-related metrics and evaluate the association between outdoor temperature and BP control variation.
Methods: We queried electronic health records (EHRs) from 26 health systems, representing 21 states, to summarize BP metrics by quarters of 12-month periods from January 2017 to March 2020. Patients with at least one ambulatory visit during the measurement period and a hypertension diagnosis during the first 6 months or prior to the measurement period were included. Changes in BP control, BP improvement, medication intensification, average SBP reduction after medication intensification across quarters and association with outdoor temperature were analyzed using weighted generalized linear models with repeated measures.
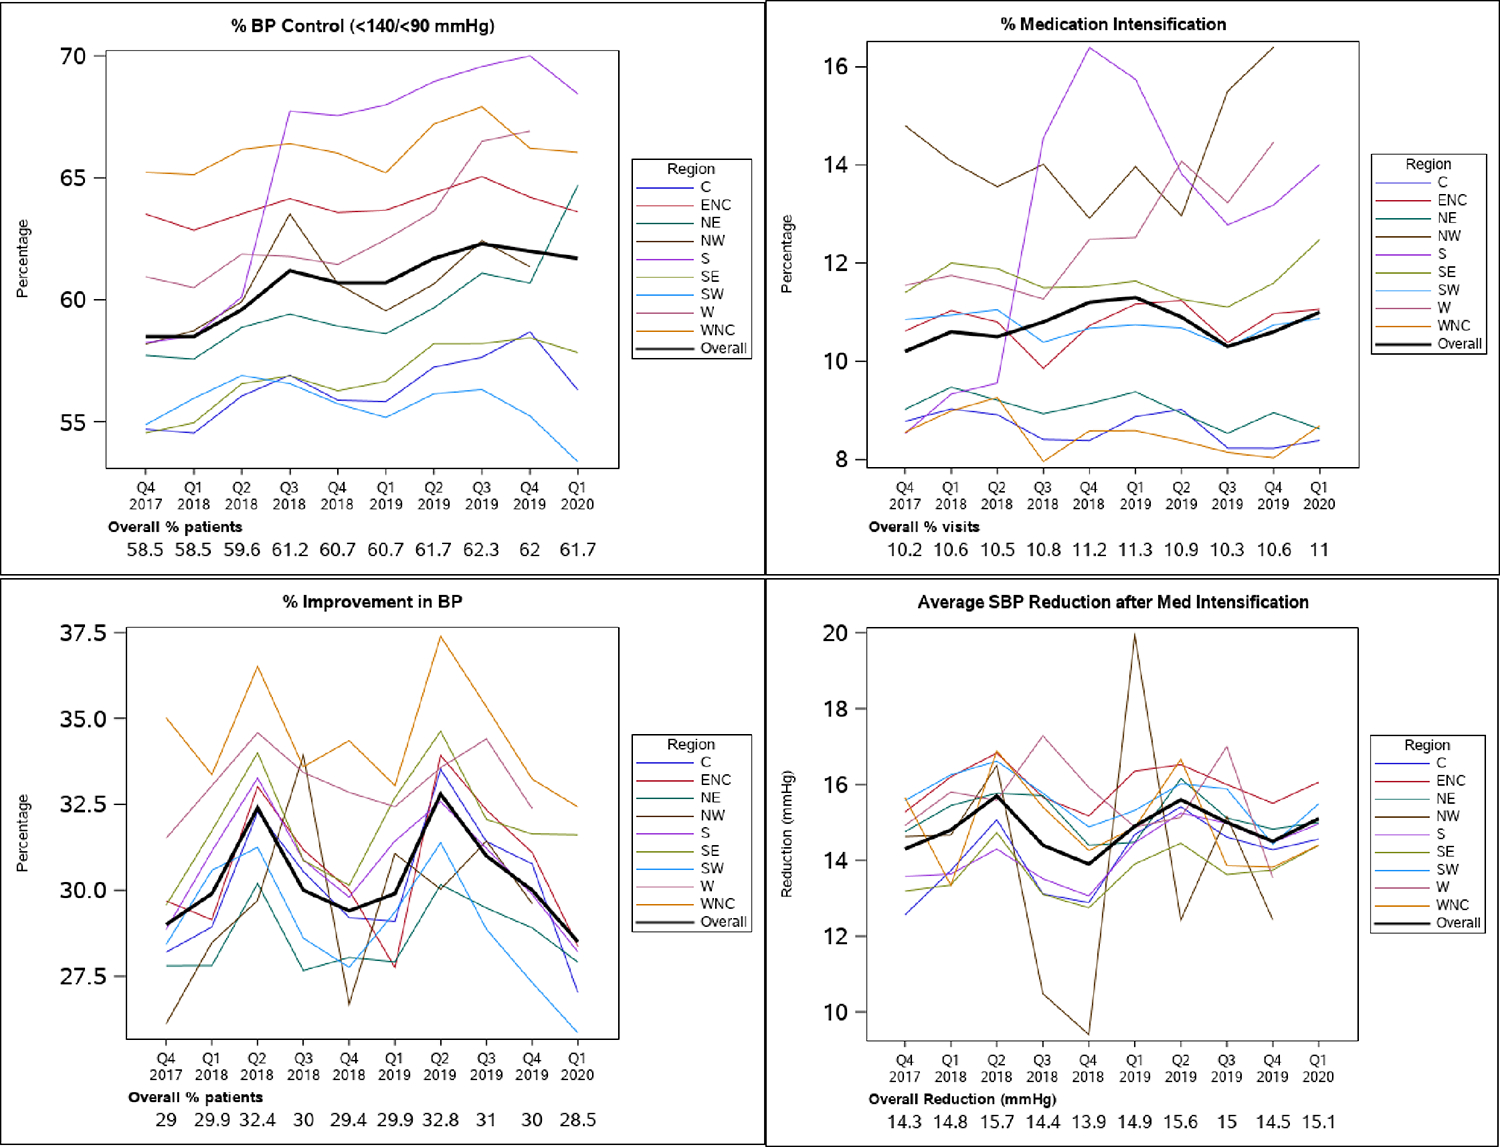
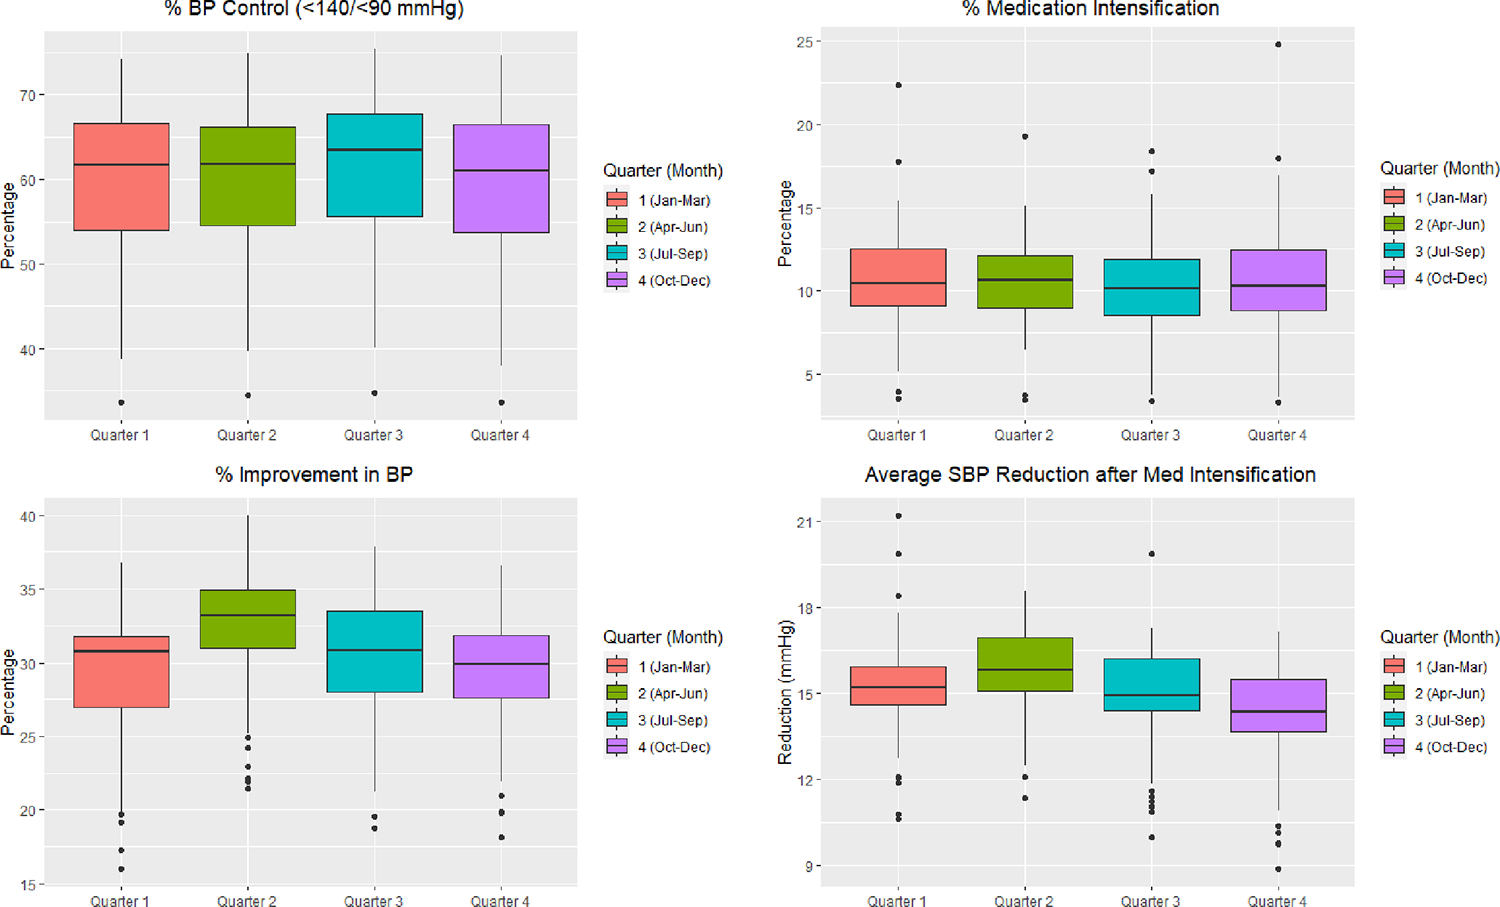
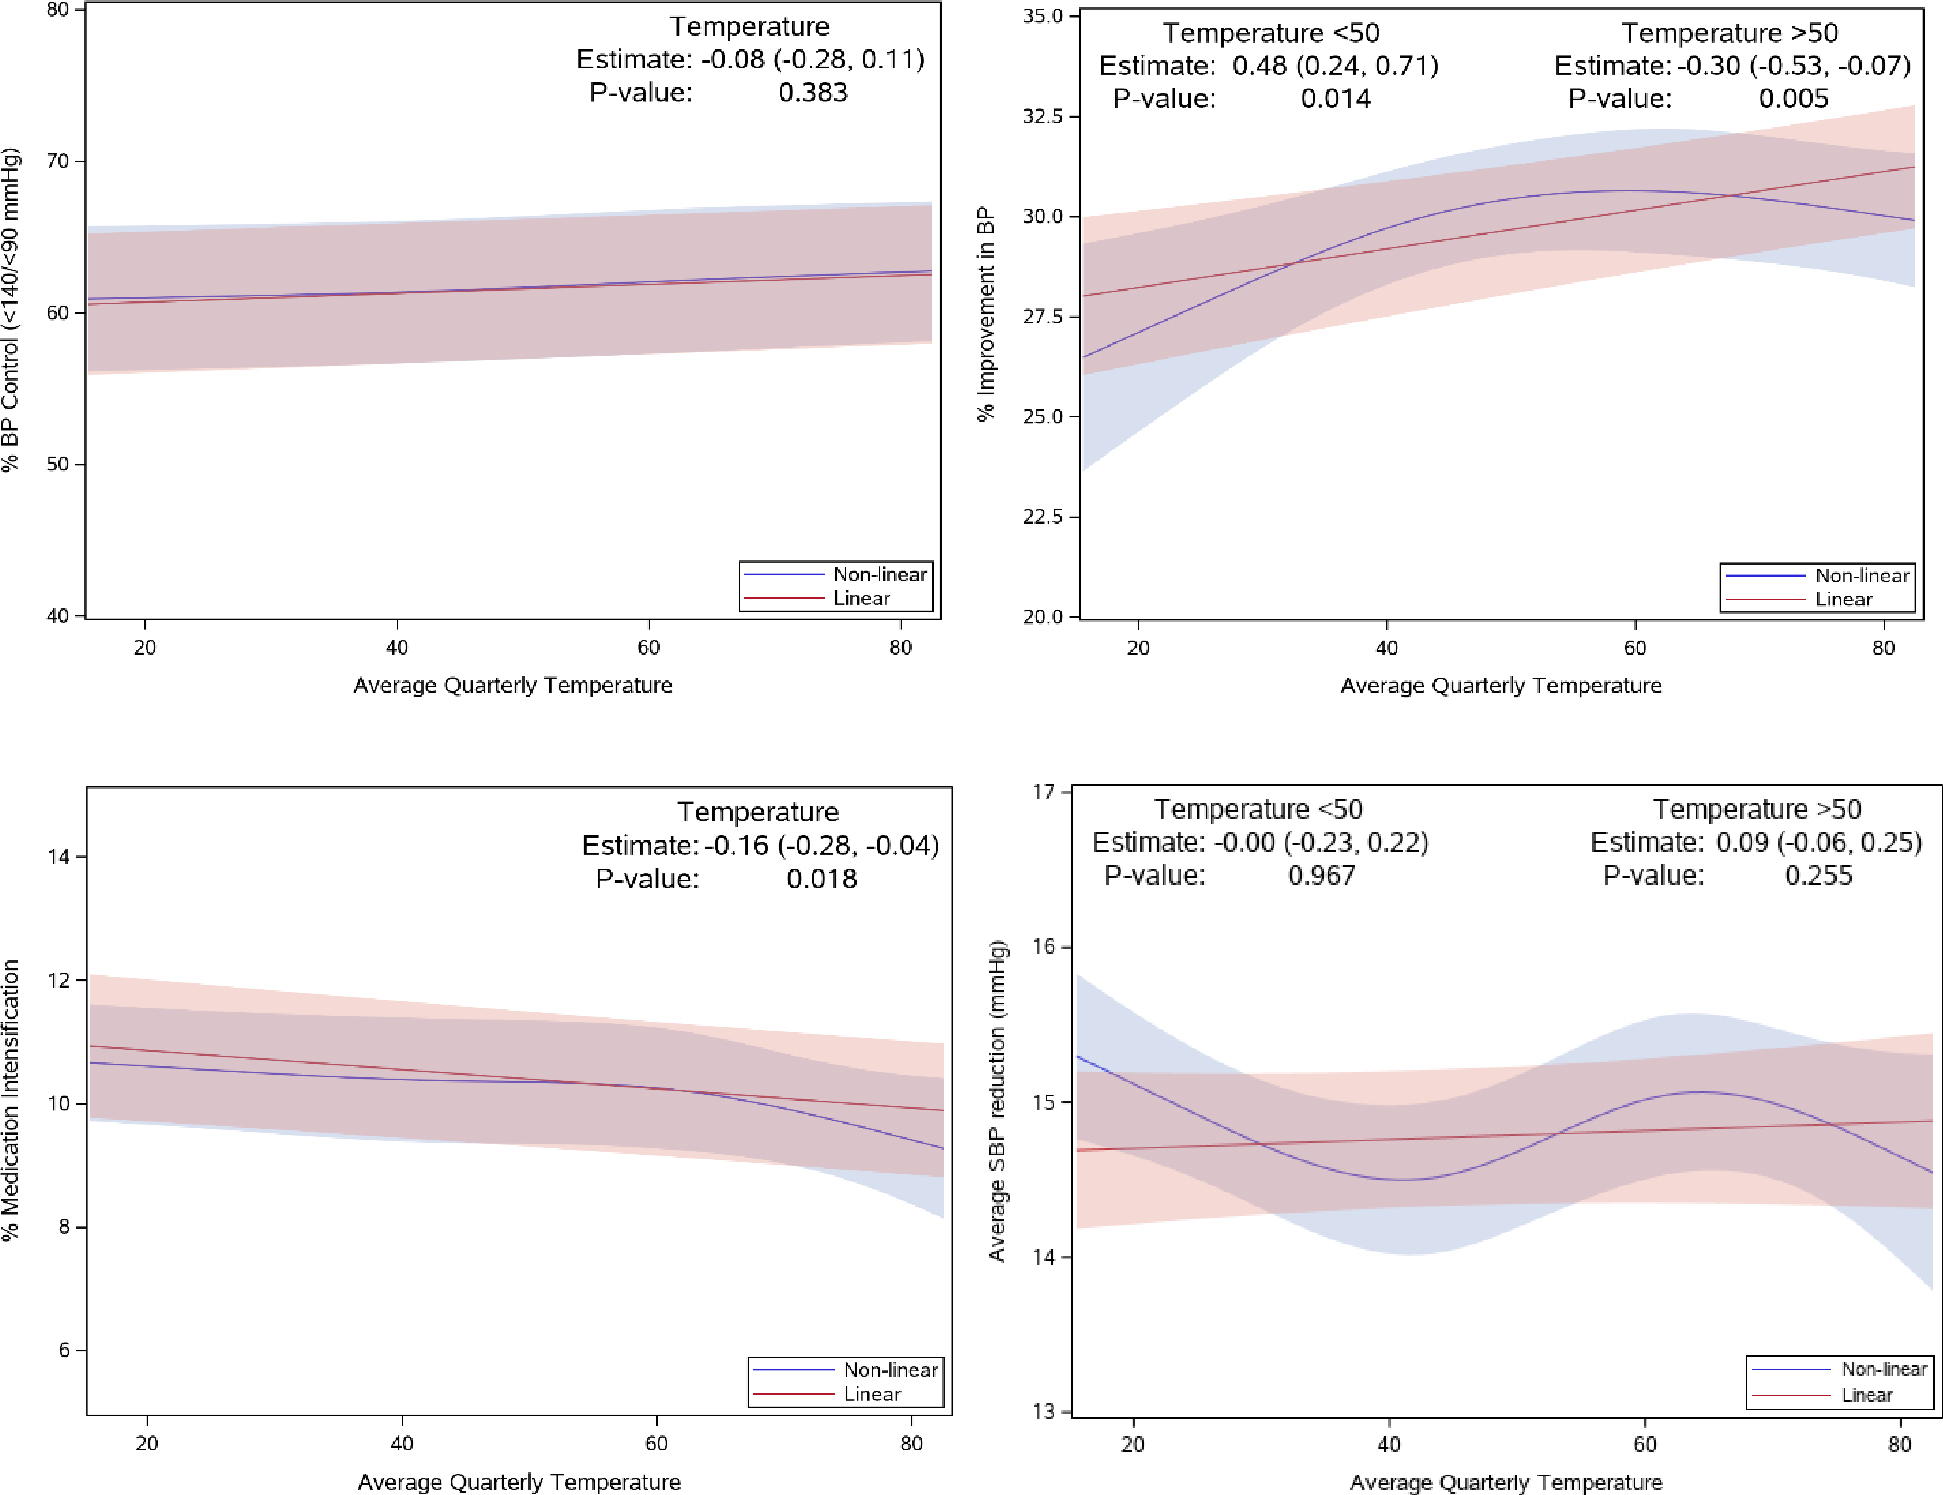
Results: Among 1 818 041 people with hypertension, the majority were more than 65 years of age (52.2%), female (52.1%), white non-Hispanic (69.8%) and had stage 1/2 hypertension (64.8%). Overall, BP control and process metrics were highest in quarters 2 and 3, and lowest in quarters 1 and 4. Quarter 2 had the highest percentage of improved BP (31.95 ± 0.90%) and average SBP reduction after medication intensification (16 ± 0.23 mmHg). Quarter 3 had the highest percentage of BP controlled (62.25 ± 2.55%) and lowest with medication intensification (9.73 ± 0.60%). Results were largely consistent in adjusted models. Average temperature was associated with BP control metrics in unadjusted models, but associations were attenuated following adjustment.
Conclusion: In this large, national, EHR-based study, BP control and BP-related process metrics improved during spring/summer months, but outdoor temperature was not associated with performance following adjustment for potential confounders.
Copyright © 2023 Wolters Kluwer Health, Inc. All rights reserved.
Figures
Comment in
-
Casual and inaccurate measurements of a continuous fluctuating variable: the original sin of the concept of arterial hypertension?J Hypertens. 2023 May 1;41(5):709-710. doi: 10.1097/HJH.0000000000003398. J Hypertens. 2023. PMID: 37017031 No abstract available.
References
-
- Centers for Disease Control and Prevention. Leading Causes of Death Reports, 2020. CDC WISQARS Online Database. Atlanta, GA: Centers for Disease Control and Prevention; 2020. Accessed January 11, 2022.
-
- World Health Organization (WHO). The Top 10 Causes of Death. WHO’s Global Health Estimates 2020: Deaths by Cause, Age, Sex, by Country and by Region, 2000–2019. Geneva: World Health Organization. Accessed December 03, 2021.
-
- Madaniyazi Lina, Armstrong Ben, Chung Yeonseung, Chris Fook Sheng, Xerxes Seposo, Yoonhee Kim, Aurelio Tobias, Yuming Guo, Francesco Sera, Yasushi Honda, Antonio Gasparrini, Masahiro Hashizume, the Multi-Country Multi-City (MCC) Collaborative Research Network, Seasonal variation in mortality and the role of temperature: a multi-country multi-city study, International Journal of Epidemiology, 2021. - PubMed
-
- Modesti PA, Rapi S, Rogolino A, Tosi B, Galanti G. Seasonal blood pressure variation: implications for cardiovascular risk stratification. Hypertens Res 2018; 41:475–482. - PubMed
