

Novel Technology for Facial Muscle Stimulation Combined With Synchronized Radiofrequency Induces Structural Changes in Muscle Tissue: Porcine Histology Study
- PMID: 36883601
- PMCID: PMC10712423
- DOI: 10.1093/asj/sjad053
Novel Technology for Facial Muscle Stimulation Combined With Synchronized Radiofrequency Induces Structural Changes in Muscle Tissue: Porcine Histology Study
Abstract
Background: With age, facial muscles lose the ability to complete contractions properly, resulting in limitation of facial expressions and fat shifting, and leading to skin creases and wrinkling.
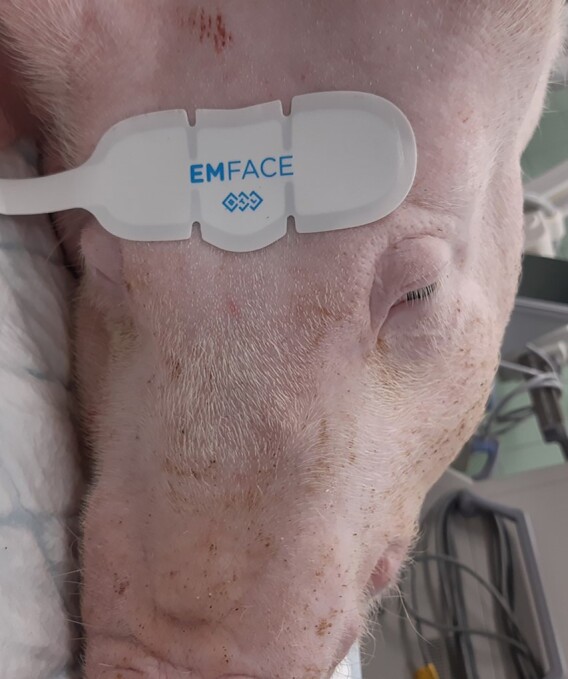
Objectives: The aim of this study was to determine the effects of the novel high intensity facial electromagnetic stimulation (HIFES) technology combined with synchronized radiofrequency on delicate facial muscles, using an animal porcine model.
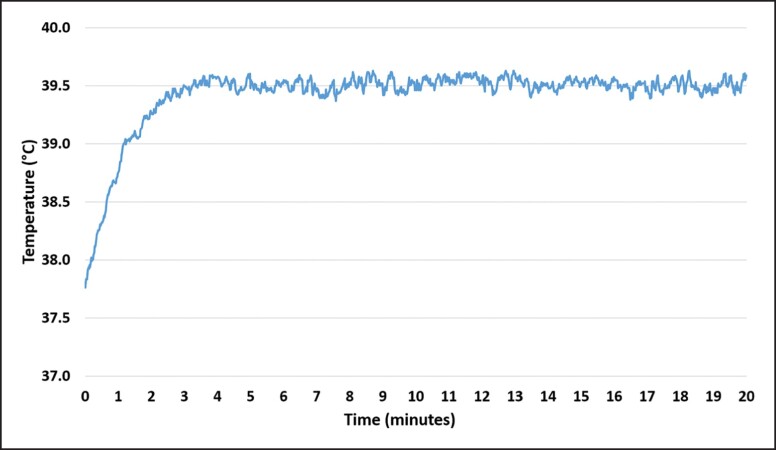
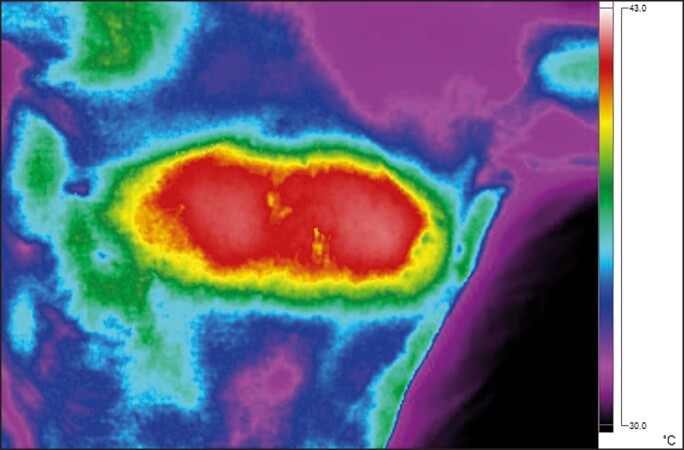
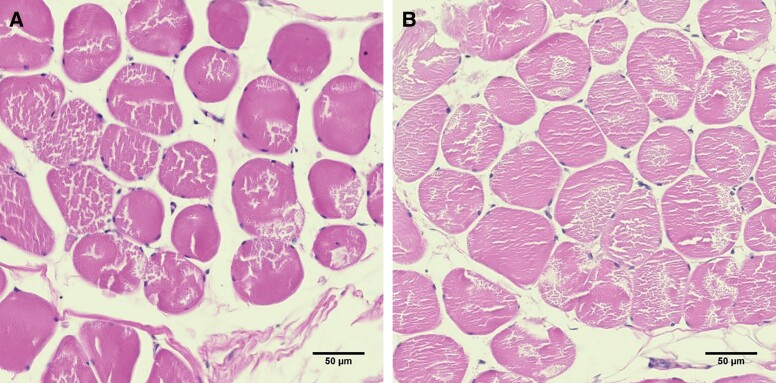
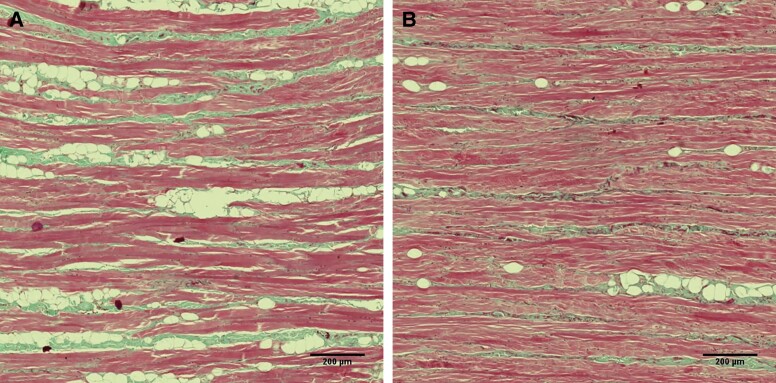
Methods: Eight (n = 8, 60-80 kg) sows were divided into the active group (n = 6) and the control group (n = 2). The active group underwent four 20-minute treatments with radiofrequency (RF) and HIFES energies. The control group was not treated. Histology samples of muscle tissue were collected by a punch biopsy (6 mm in diameter) from the treatment area of each animal at baseline, 1-month, and 2-month follow-up. The evaluation included staining of the obtained tissue slices with hematoxylin and eosin and Masson's trichrome to determine the changes in muscle mass density, number of myonuclei, and muscle fibers.
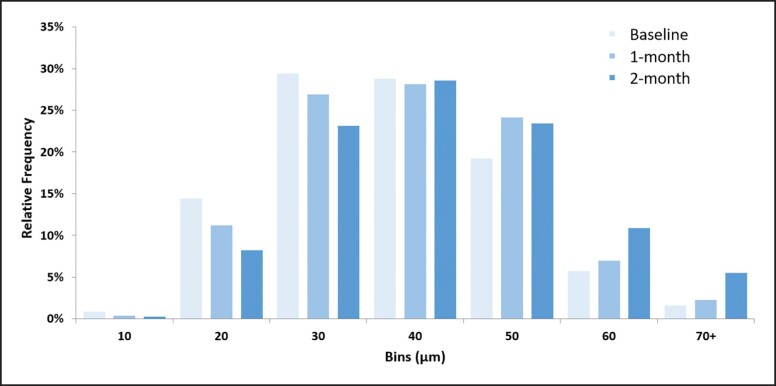
Results: The active group showed muscle mass density increase (by 19.2%, P < .001), together with elevated numbers of myonuclei (by 21.2%, P < .05) and individual muscle fibers, which increased from 56.8 ± 7.1 to 68.0 ± 8.6 (P < .001). In the control group, no significant changes were seen in any of the studied parameters throughout the study (P > .05). Finally, no adverse events or side effects were observed in the treated animals.
Conclusions: The results document favorable changes after the HIFES + RF procedure at the level of the muscle tissue, which may be of great importance in terms of maintenance of facial appearance in human patients.
© The Author(s) 2023. Published by Oxford University Press on behalf of The Aesthetic Society. All rights reserved. For permissions, please e-mail: journals.permissions@oup.com.
Figures
Comment in
-
Commentary on: Novel Technology for Facial Muscle Stimulation Combined With Synchronized Radiofrequency Induces Structural Changes in Muscle Tissue: Porcine Histology Study.Aesthet Surg J. 2023 Jul 15;43(8):928-929. doi: 10.1093/asj/sjad110. Aesthet Surg J. 2023. PMID: 37071792 No abstract available.
