. 2023 Jun 2;13(6):1454-1477.
doi: 10.1158/2159-8290.CD-22-0907.

p38MAPKα Stromal Reprogramming Sensitizes Metastatic Breast Cancer to Immunotherapy

Affiliations

p38MAPKα Stromal Reprogramming Sensitizes Metastatic Breast Cancer to Immunotherapy

Douglas V Faget et al. Cancer Discov. .

Abstract

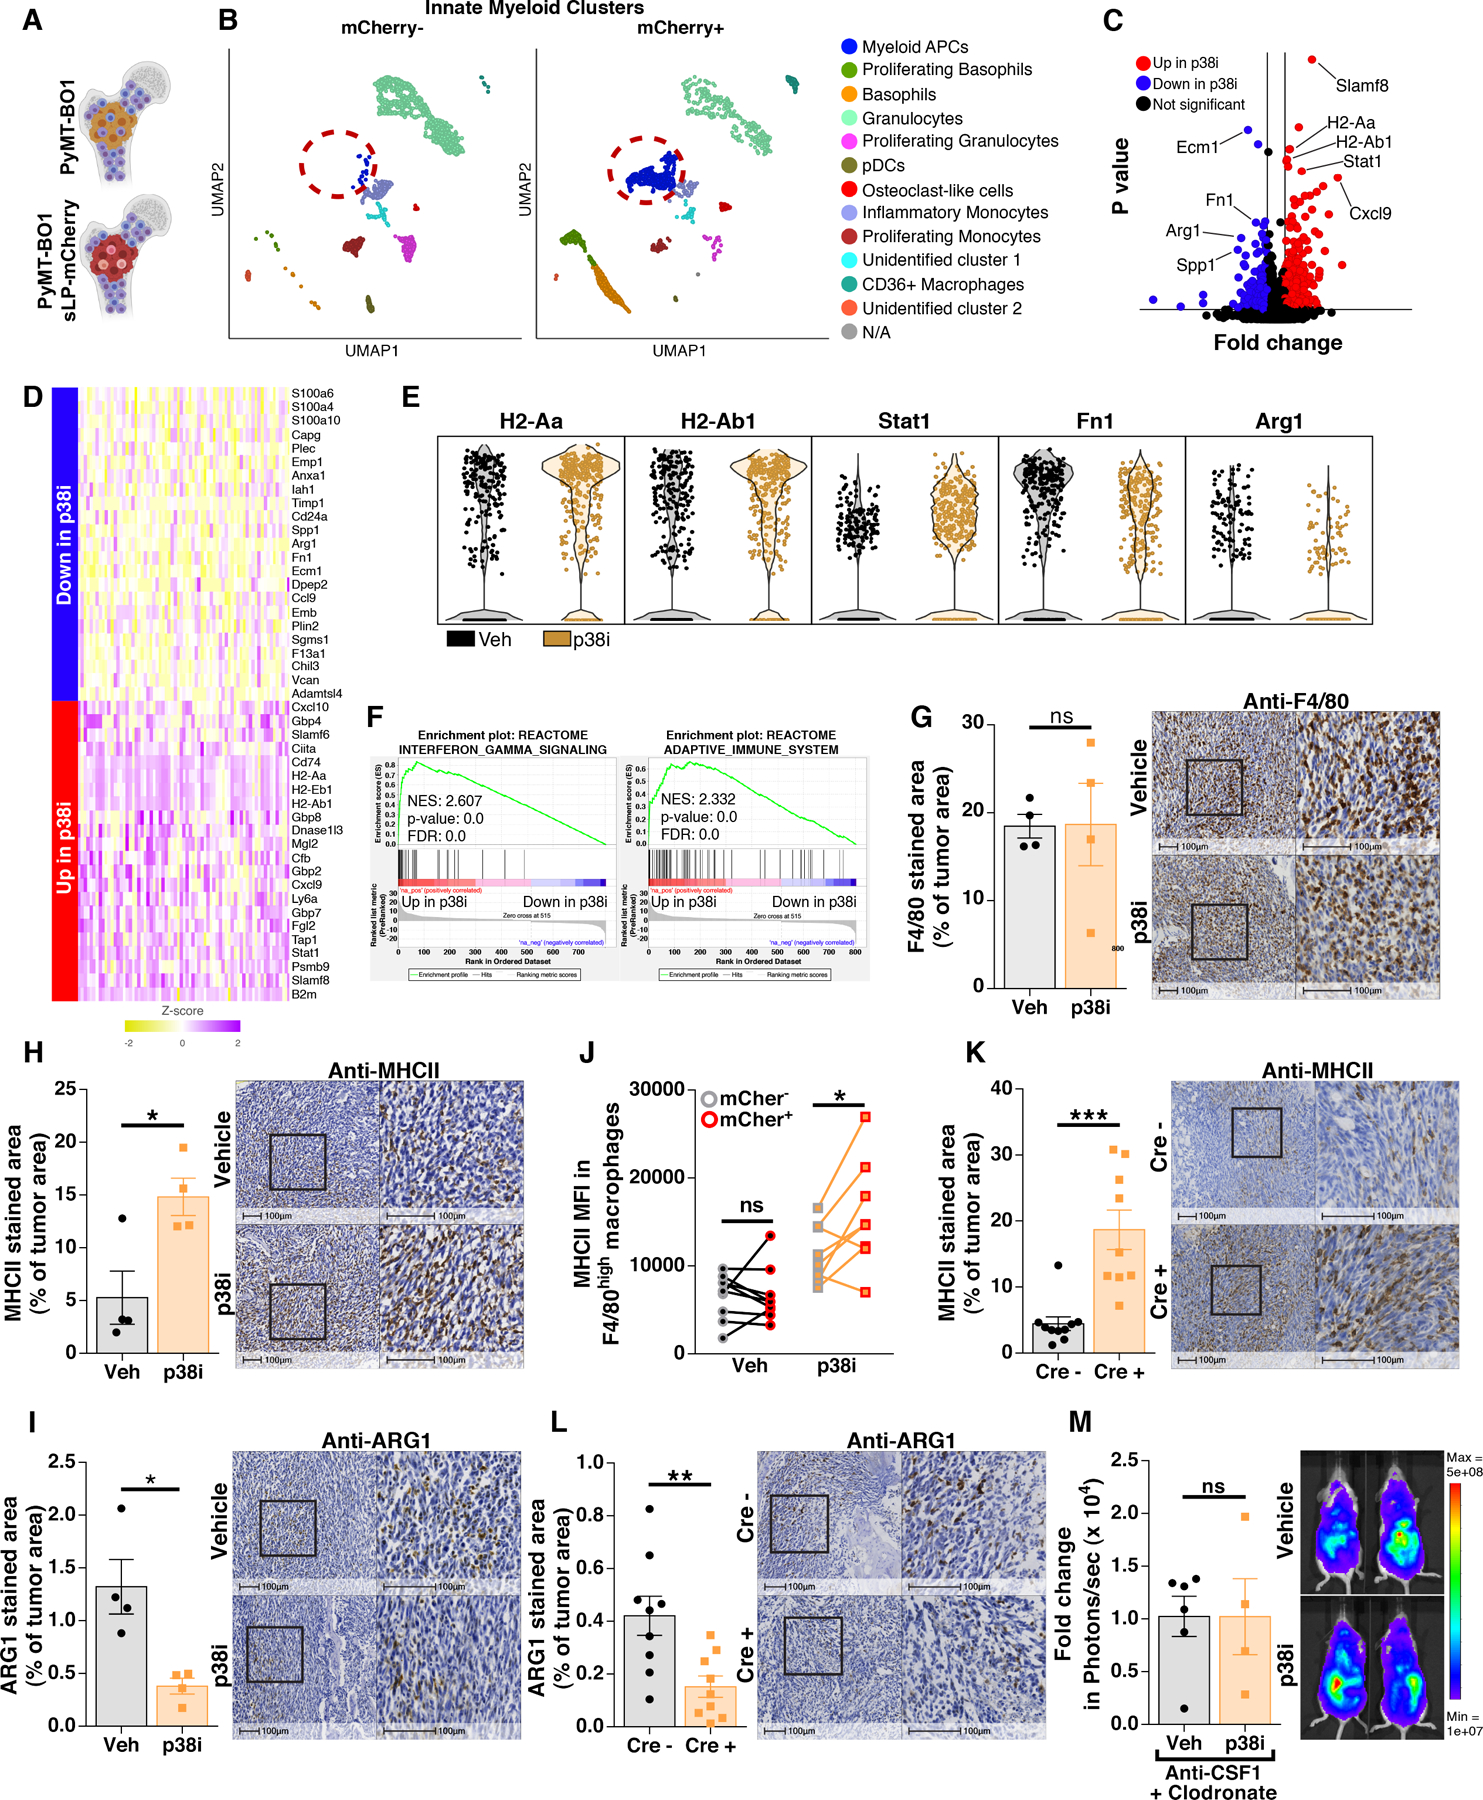
Metastatic breast cancer is an intractable disease that responds poorly to immunotherapy. We show that p38MAPKα inhibition (p38i) limits tumor growth by reprogramming the metastatic tumor microenvironment in a CD4+ T cell-, IFNγ-, and macrophage-dependent manner. To identify targets that further increased p38i efficacy, we utilized a stromal labeling approach and single-cell RNA sequencing. Thus, we combined p38i and an OX40 agonist that synergistically reduced metastatic growth and increased overall survival. Intriguingly, patients with a p38i metastatic stromal signature had better overall survival that was further improved by the presence of an increased mutational load, leading us to ask if our approach would be effective in antigenic breast cancer. The combination of p38i, anti-OX40, and cytotoxic T-cell engagement cured mice of metastatic disease and produced long-term immunologic memory. Our findings demonstrate that a detailed understanding of the stromal compartment can be used to design effective antimetastatic therapies.

Significance: Immunotherapy is rarely effective in breast cancer. We dissected the metastatic tumor stroma, which revealed a novel therapeutic approach that targets the stromal p38MAPK pathway and creates an opportunity to unleash an immunologic response. Our work underscores the importance of understanding the tumor stromal compartment in therapeutic design. This article is highlighted in the In This Issue feature, p. 1275.


Conflict of interest statement

Conflict of Interest Disclosure Statement: Joseph Monahan is an employee of Aclaris Therapeutics. No other authors have any conflicts to disclose.

Figures

Figure 1.
Figure 1.. Hematopoietic stromal p38α supports metastatic tumor growth.
(A) Serial sections from human breast metastases were stained for cytokeratin (Pan-CK) and phospho-p38 (p-p38) or phospho-MK2 (p-MK2) by immunohystochemistry. Tumor stroma was identified by the absence of Pan-CK staining. (B) Luciferase-labeled (GFP-Luc) PyMT-BO1 breast cancer cells were implanted into the mammary fat pad and mice were treated as indicated. (C) Primary tumor growth was assessed by caliper measurements. (D) After primary tumor resection on day 21, disseminated tumor growth was assessed by bioluminescence imaging (BLI) on day 49. Vehicle (Veh), n=12; p38i, n=11). (E, F, G, H, I, J) Luciferase-labeled breast tumor cells were intracardically (i.c.) injected in the indicated mouse background. (F) PyMT-BO1 cells were i.c. injected in B6 albino mice. Disseminated metastatic tumor burden was measured by BLI on day 13 following tumor implantation. (G) Immediately after whole body measurements shown in F, leg bones were isolated and tumor burden was measured by ex vivo BLI. (n=7–9 biologically independent samples per group). (H) Disseminated metastatic tumor burden for EO771 cells was measured by BLI on day 13 following i.c. implantation(n=8). (I) Disseminated metastatic burden for NT2.5 Her2/Neu cells was measured by BLI on day 13 following i.c. implantation (n=7–8). (J) Disseminated metastatic burden for EMT6 cells was measured by BLI on day 13 following i.c. implantation (n=3–5). (K) Bone marrow transplantation from CD45.2 UBC-CreERT2cre/0Mapk14fl/flAi14LSL/LSL and Mapk14fl/flAi14LSL/LSL littermate donors to wildtype CD45.1 C57Bl/6 recipient mice was performed as shown in the schematics in (L). (Cre-, n=10; Cre+, n=8) (M) Transplanted mice were i.c. injected with luciferase-labeled PyMT-BO1 and disseminated tumor burden was assessed by BLI on day 14. (N) Immediately after BLI measurements shown in (M), leg bones were isolated and tumor growth assessed by ex vivo BLI. Unpaired student t test perfomed for all statistical analyses shown in this picture. All numerical data are represented as mean ± SEM. *, P<0.05; **, P<0.01; ***, P<0.001; ns, not significant.
Figure 2.
Figure 2.. Inhibition of p38α signaling shifts tumor-associated macrophages from a tumor-promoting to a tumor-suppressive phenotype with increased IFNγ response signature.
(A) sLPmCherry-expressing tumor cells label tumor proximal stromal cells. These cells were used to isolate tumor proximal and distal stromal cells that were subjected to single cell RNA sequencing (scRNAseq) analyses. (B) Uniform Manifold Approximation and Projection (UMAP) of innate myeloid cells from pooled samples from each treatment condition segmented by mCherry status (n=4 per treatment; Total 4,880 cells; 1,220 cells per treatment condition/mCherry status after downsampling). (C) Volcano plot showing differential expression in tumor associated (mCherry+) myeloid APC clusters from each treatment condition found by scRNAseq analyses. Colored dots represent genes with statistically significant changes (p<0.05) and ≥1.5-fold change in expression levels in any direction. (D) Heatmap highlighing the most differentially expressed genes (23-downregulated; 22-upregulated) in tumor associated myeloid APCs upon p38i-treament. (E) Violin plots for selected genes showing differential expression levels in tumor-associated (mCherry+) myeloid APCs found under vehicle and p38i-treated conditions. (F) Gene set enrichment analyses between tumor associated myeloid APCs found under vehicle versus p38i-treated conditions. Normalized Enrichment Score (NES), P-value and False Discovery Rate (FDR) are shown in the figure. (G, H, I) Immunohistochemical analyses were performed on tumor-bearing leg bones using F4/80 (G), MHCII (H) or ARG1 (I) specific antibodies. (n=4 biologically independent samples per group) (J) Flow cytometry analysis on gated F4/80high macrophages from tumor-bearing femurs under vehicle and p38i-treated conditions. Lines connect data from the same mouse (n=8–9 biologically independent samples per group). (K, L) Immunohistochemical analyses were performed on tumor-bearing leg bones from mice shown in Fig 1M using MHCII (K) or ARG1 (L) specific antibodies (n=9–10 biologically independent samples per group). (M) PyMT-BO1 metastatic tumor burden was assessed upon macrophage depletion by BLI on day 13 after tumor cell implantation by i.c. injection. (n=4–6 biologically independent samples per group). Unpaired student t test perfomed for all statistical analyses shown in histological analyses and tumor burden quantification. Paired student t test performed for flow cytometry analyses shown in (J). All bar graph data are represented as mean ± SEM. *, P<0.05; **, P<0.01; ***, P<0.001; ns, not significant.
Figure 3.
Figure 3.. p38-dependent gene signature in primary breast tumors is associated with worse overall survival in human patients and is found in myeloid cells from human bone metastatic lesions.
(A, B) Bone-marrow derived macrophages isolated from the ARG1-YFP mouse were stimulated with 0.25U/ml of IFNγ (A) or IL4+IL13 20ng/ml (B) for 24 or 48 hours, respectively, in the presence or absence of increasing concentrations of p38i (n=3). Data are represented as mean ± SD. (C) Kaplan-Meier plot of overall survival of human luminal B breast cancer patients with high (red line) or low (blue line) p38-dependent gene signature (down in p38i, Fig 2D, S4B) using the TCGA database. (D) Kaplan-Meier (K-M) plot of overall survival of human basal-like breast cancer patients with high (red line) or low (blue line) p38-dependent gene signature (down in p38i, Fig 2D, S4B) using the TCGA database. (E) UMAP plot of bone metastases samples obtained from human patients. Cell types (left) identified based on canonial cell markers expression and SingleR automatic assignment, p38-dependent signature score (middle) calculated using Seurat AddModuleScore function and sample origin (right) are represented (n=4 samples obtained from 3 patients). (F) Violin plots for the p38-dependent gene signature score in the discriminated cell types from human bone metastases. One-way ANOVA with Tukey multiple comparisons test performed statistical analyses involving more than two groups in (A) and (B). Logrank test performed for K-M analyses. Wilcoxon test comparing macrophage population with other cell types was performed for the statistical analyses shown in (F). *, P<0.05; ****, P<0.0001; ns, not significant.
Figure 4.
Figure 4.. Inhibition of p38α reduces metastatic tumor growth in an IFNγ- and CD4+ T cell-dependent manner.
Mice were i.c. injected with PyMT-BO1 breast tumor cells, following the experimental design shown in Fig 1E, and disseminated metastatic tumor growth was assessed. (A) Quantification of BLI on day 13 (left) and representative images (right) upon IFNγ blockade. (B) Quantification of BLI on day 13 (left) and representative images (right) upon CD4+ and CD8+ T cell depletion. (C) Quantification of BLI on day 13 (left) and representative images (right) in Tcra−/− mice. (D) Quantification of BLI on day 13 (left) and representative images (right) in CD4+ or CD8+ T cell depleted mice. (E) Quantification of BLI on day 13 (left) and representative images (right) in MHCII−/− mice. n=7–9 biologically independent samples per group. (F, G) IHC analyses were performed on tumor-bearing leg bones using CD4 (F) or CD8 (G) antibodies. n=6–8 biologically independent samples per group. (H) Flow cytometry analyses of activated CD4+ and CD8+ T cells from tumor-bearing femurs. (I) Flow cytometry analyses of activated CD4+ T cells in bone lesions from mice that were implanted with mCherry-labeled PyMT-BO1 tumor cells (n=9 biologically independent samples per group) (J) Splenocytes from tumor-bearing mice under vehicle or p38i treatment were isolated for ex vivo stimulation with PMA and ionomycin to assess IFNγ production (n=5 biologically independent samples per group). Estimated total numbers of IFNγ-producing CD4+ T cells in the spleen (right graph) were calculated by multiplying the frequency of IFNγ-producing CD4+ T cells found upon ex vivo stimulation and the total raw number of cells in the spleen from each treated mouse at the time of isolation. One-way ANOVA with Tukey multiple comparisons test performed all statistical analyses involving more than two groups. Unpaired student t test perfomed for statistical all analyses between two different treatment conditions. Paired student t test performed for analyses involving mCherry- and mCherry+ cells obtained from the same mouse. All bar graph data are represented as mean ± SEM. *, P<0.05; **, P<0.01; ns, not significant.
Figure 5.
Figure 5.. Inhibition of p38 synergizes with agonist anti-OX40 immunotherapy to reduce metastatic tumor growth.
(A) Violin plots for selected costimulatory genes in tumor-associated myeloid APC cluster from p38i-treated PyMT-BO1 bone metastases. (B) Violin plots for selected costimulatory genes in macrophages from human bone metastases. (C) PyMT-BO1 tumor cells were i.c. implanted and mice were treated as shown. (D) Disseminated metastatic growth of PyMT-BO1 tumors was measured on day 13 after tumor cell implatation by BLI (left) with representative pictures (right). (E) Overall survival of PyMT-BO1-implanted mice was assessed for up to 25 days. Vehicle, n=9; p38i, n= 7; anti-OX40, n=8; p38i+anti-OX40, n=8. (F) EMT6 tumor cells were i.c. implanted and mice were treated as shown. (G) Disseminated metastatic growth of EMT6 tumors was measured on day 12 after tumor cell implatation by BLI (left) with represenative pictures (right). (H) Overall survival of EMT6-implanted mice was assessed for up to 25 days. Vehicle, n=7; p38i, n= 6; anti-OX40, n=8; p38i+anti-OX40, n=8. (I) Flow cytometry analyses of activated CD4+ and CD8+ T cells from PyMT-BO1 tumor-bearing femurs (n=5–6 biologically independent samples per group). One-way ANOVA with Tukey multiple comparisons test performed all statistical analyses involving more than two groups. Logrank test performed for overall survival analyses. All bar graph data are represented as mean ± SEM. *, P<0.05; **, P<0.01; ***, P<0.001; ****, P<0.0001; ns, not significant.
Figure 6.
Figure 6.. Neoantigenicity and ‘p38 inactive’ macrophage gene signature are associated with better overall survival in human breast patients.
(A) PyMT-BO1 metastatic tumor burden was assessed by BLI on day 13 after i.c. implantation under the combination treatment (p38i + anti-OX40) upon CD8+ T cell depletion. (n=6–8 biologically independent samples per group) (B) OVA-expressing PyMT-BO1 tumor cells were i.c. implanted and mice treated as indicated in Fig. 5C and tumor burden was measured weekly for each mouse over 75 days. (C) Overall survival of mice implanted with OVA-expressing tumor cells was assessed for up to 75 days. Vehicle, n=18; p38i, n= 17; anti-OX40, n=15; p38i+anti-OX40, n=10. (D) Mice that underwent the combo treatment (p38i+ anti-OX40) in (C) were rechallenged with implantation of OVA-expressing PyMT-BO1 cells into the primary site and tumor growth was assessed by BLI (left) with representative images (right) at the indicated time. (E) Kaplan-Meier plots of overall survival of breast cancer patients with high (red line) or low (blue line) ‘p38 inactive’ gene signature segmented by selected subtypes using data from the TCGA database (n is indicated on each plot; subtypes are indicated in the figure). (F) Kaplan-Meier plots of overall survival for breast cancer patients with high tumor mutational burden (TMB) segmented by high (red line) or low (blue line) ‘p38 inactive’ gene signature using the TCGA database (n is indicated on each plot; subtypes are indicated in the figure). (G) Hazard ratio plot of breast cancer patients with high ‘p38 inactive’ signature segmented by all patients or high TMB subset. (H) CD4+ T cell, M1- and M2-like macrophage abundance was calculated by digital cytometry for high and low ‘p38 inactive’ human breast cancer samples from the TCGA database (p-values are shown in the figure). Log-rank test performed for K-M analyses. Cox analysis performed using ‘p38 inactive’ gene signature with patient age at diagnosis as covariate to produce hazard ratios.

References

    1. Weilbaecher KN, Guise TA, McCauley LK. Cancer to bone: a fatal attraction. Nature reviews Cancer 2011;11:411–25. - PMC - PubMed
    1. Jiao S, Subudhi SK, Aparicio A, Ge Z, Guan B, Miura Y, et al. Differences in Tumor Microenvironment Dictate T Helper Lineage Polarization and Response to Immune Checkpoint Therapy. Cell 2019;179:1177–90 e13. - PubMed
    1. Fox GC, Su X, Davis JL, Xu Y, Kwakwa KA, Ross MH, et al. Targeted Therapy to beta3 Integrin Reduces Chemoresistance in Breast Cancer Bone Metastases. Molecular cancer therapeutics 2021;20:1183–98. - PMC - PubMed
    1. Fane ME, Chhabra Y, Alicea GM, Maranto DA, Douglass SM, Webster MR, et al. Stromal changes in the aged lung induce an emergence from melanoma dormancy. Nature 2022;606:396–405. - PMC - PubMed
    1. Zhu L, Narloch JL, Onkar S, Joy M, Broadwater G, Luedke C, et al. Metastatic breast cancers have reduced immune cell recruitment but harbor increased macrophages relative to their matched primary tumors. Journal for immunotherapy of cancer 2019;7:265. - PMC - PubMed

Publication types