

Comment
doi: 10.1007/s11739-023-03247-2.
Epub 2023 Mar 8.
Beware the IBM SPSS statistics® in multiple ROC curves analysis
Affiliations
- PMID: 36884110
- PMCID: PMC9993357
- DOI: 10.1007/s11739-023-03247-2
Item in Clipboard
Comment
Beware the IBM SPSS statistics® in multiple ROC curves analysis
Intern Emerg Med.
2023 Jun.
No abstract available
Keywords: COVID-19; Prognosis; ROC curve; Statistics.
Conflict of interest statement
The author declares that he has no known competing financial interests or personal relationships that could have influenced the work reported in this paper.
Figures
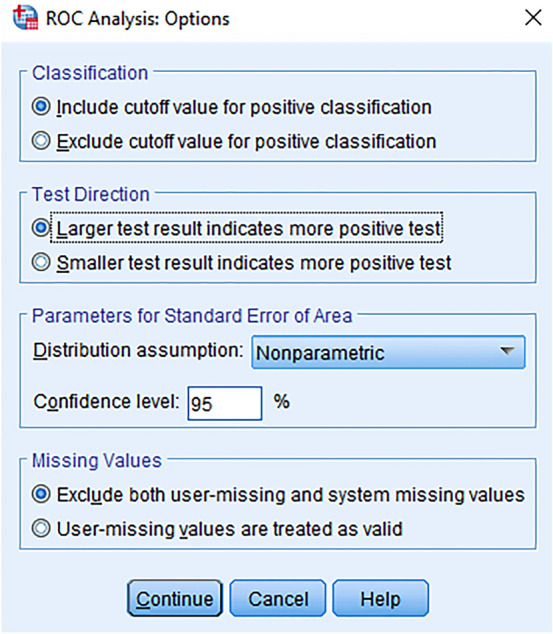
The IBM SPSS statistics “ROC Curve: Options” dialog. In the “Test Direction” area, the user must choose which direction is positive. Only curves with similar direction of association can be displayed properly in the same plot
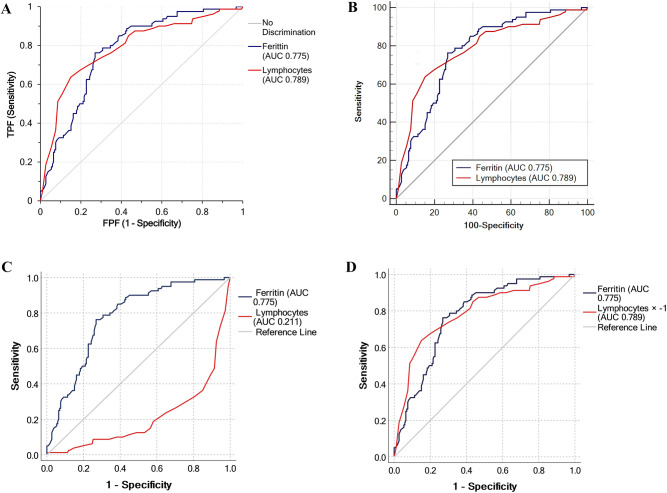
ROC curves depicted by three statistical software for ferritin and lymphocytes which have different direction of association with mortality in patients with COVID-19. A larger value in ferritin indicates a positive test result (mortality) while a smaller value in lymphocytes indicates a positive test result (mortality). Curves are displayed properly in the same plot when depicted by Analyze-it® (A) and MedCalc® (B) with AUCs of 0.775 and 0.789, respectively. However, the IBM SPSS Statistics® (using the default test direction entry; “Larger test result indicates more positive test”) displayed the lymphocytes curve below the diagonal reference line with misleadingly small AUC of 0.211 (C). Transformation of lymphocytes (via multiplying all values by − 1) displayed the two curves properly in the same plot (D). Dataset analyzed includes 266 COVID-19 patients with paired measurements of ferritin and lymphocytes (online resource 1) from reference [4]; an open access article distributed under the terms of the Creative Commons Attribution License
Comment on
-
Comparison of the characteristics, morbidity and mortality of COVID-19 between first and second/third wave in a hospital setting in Lombardy: a retrospective cohort study.Intern Emerg Med. 2022 Oct;17(7):1941-1949. doi: 10.1007/s11739-022-03034-5. Epub 2022 Jul 9. Intern Emerg Med. 2022. PMID: 35809152 Free PMC article.
References
-
- Leidi F, Boari GEM, Scarano O, Mangili B, Gorla G, Corbani A, Accordini B, Napoli F, Ghidelli C, Archenti G, Turini D, Saottini M, Guarinoni V, Ferrari-Toninelli G, Manzoni F, Bonetti S, Chiarini G, Malerba P, Braglia-Orlandini F, Bianco G, Faustini C, Agabiti-Rosei C, De Ciuceis C, Rizzoni D. Comparison of the characteristics, morbidity and mortality of COVID-19 between first and second/third wave in a hospital setting in Lombardy: a retrospective cohort study. Intern Emerg Med. 2022;17(7):1941–1949. doi: 10.1007/s11739-022-03034-5. - DOI - PMC - PubMed
-
- IBM (2022) IBM SPSS statistics algorithms. IBM Corporation. https://www.ibm.com/docs/en/SSLVMB_29.0.0/pdf/IBM_SPSS_Statistics_Algori.... Accessed 19 January 2023
-
- Coelho S, Braga AC (2015) Performance evaluation of two software for analysis through ROC curves: Comp2ROC vs SPSS. In: Gervasi O, Murgante B, Misra S et al. (eds) Computational science and its applications -- ICCSA 2015, vol 2. Springer International Publishing, Switzerland, p 144–156 doi:10.1007/978-3-319-21407-8_11
Publication types
MeSH terms
LinkOut - more resources
Full Text Sources
