. 2023 May 1;220(5):e20221755.
doi: 10.1084/jem.20221755. Epub 2023 Mar 8.

Human germline heterozygous gain-of-function STAT6 variants cause severe allergic disease

Mehul Sharma #  1 Daniel Leung #  2 Mana Momenilandi #  3   4 Lauren C W Jones #  1 Lucia Pacillo #  5   6   7 Alyssa E James #  8 Jill R Murrell #  9 Selket Delafontaine #  10   11 Jesmeen Maimaris #  12   13 Maryam Vaseghi-Shanjani #  1 Kate L Del Bel #  1 Henry Y Lu #  14   15   16 Gilbert T Chua  2   17 Silvia Di Cesare  5   7 Oriol Fornes  18   19 Zhongyi Liu  2 Gigliola Di Matteo  6   7 Maggie P Fu  20   21 Donato Amodio  6 Issan Yee San Tam  2 Gavin Shueng Wai Chan  22 Ashish A Sharma  23 Joshua Dalmann  1 Robin van der Lee  18   19 Géraldine Blanchard-Rohner  1   24 Susan Lin  1 Quentin Philippot  3   4 Phillip A Richmond  1   18 Jessica J Lee  18   25 Allison Matthews  18   26 Michael Seear  1 Alexandra K Turvey  1 Rachael L Philips  27 Terri F Brown-Whitehorn  28 Christopher J Gray  29 Kosuke Izumi  29 James R Treat  30 Kathleen H Wood  9 Justin Lack  31 Asya Khleborodova  31 Julie E Niemela  32 Xingtian Yang  2 Rui Liang  2 Lin Kui  2   33 Christina Sze Man Wong  34 Grace Wing Kit Poon  35 Alexander Hoischen  36 Caspar I van der Made  36 Jing Yang  2 Koon Wing Chan  2 Jaime Sou Da Rosa Duque  2 Pamela Pui Wah Lee  2 Marco Hok Kung Ho  2   37 Brian Hon Yin Chung  2 Huong Thi Minh Le  38 Wanling Yang  2 Pejman Rohani  39 Ali Fouladvand  40 Hassan Rokni-Zadeh  41 Majid Changi-Ashtiani  42 Mohammad Miryounesi  43 Anne Puel  3   4   44 Mohammad Shahrooei  45 Andrea Finocchi  5   7 Paolo Rossi  5   46 Beatrice Rivalta  5   6   7 Cristina Cifaldi  7 Antonio Novelli  47 Chiara Passarelli  47 Stefania Arasi  48 Dominique Bullens  49   50 Kate Sauer  51   52 Tania Claeys  53 Catherine M Biggs  1 Emma C Morris  12   13 Sergio D Rosenzweig  32 John J O'Shea  27 Wyeth W Wasserman  18 H Melanie Bedford  26   54 Clara D M van Karnebeek  18   55 Paolo Palma  5   6 Siobhan O Burns #  12   13 Isabelle Meyts #  10   11 Jean-Laurent Casanova #  3   4   56   57   44 Jonathan J Lyons #  8 Nima Parvaneh #  58 Anh Thi Van Nguyen #  59 Caterina Cancrini #  5   7 Jennifer Heimall #  28 Hanan Ahmed #  60 Margaret L McKinnon #  19 Yu Lung Lau #  2 Vivien Béziat #  3   4   44 Stuart E Turvey #  1
Affiliations

Human germline heterozygous gain-of-function STAT6 variants cause severe allergic disease

Mehul Sharma et al. J Exp Med. .

Abstract

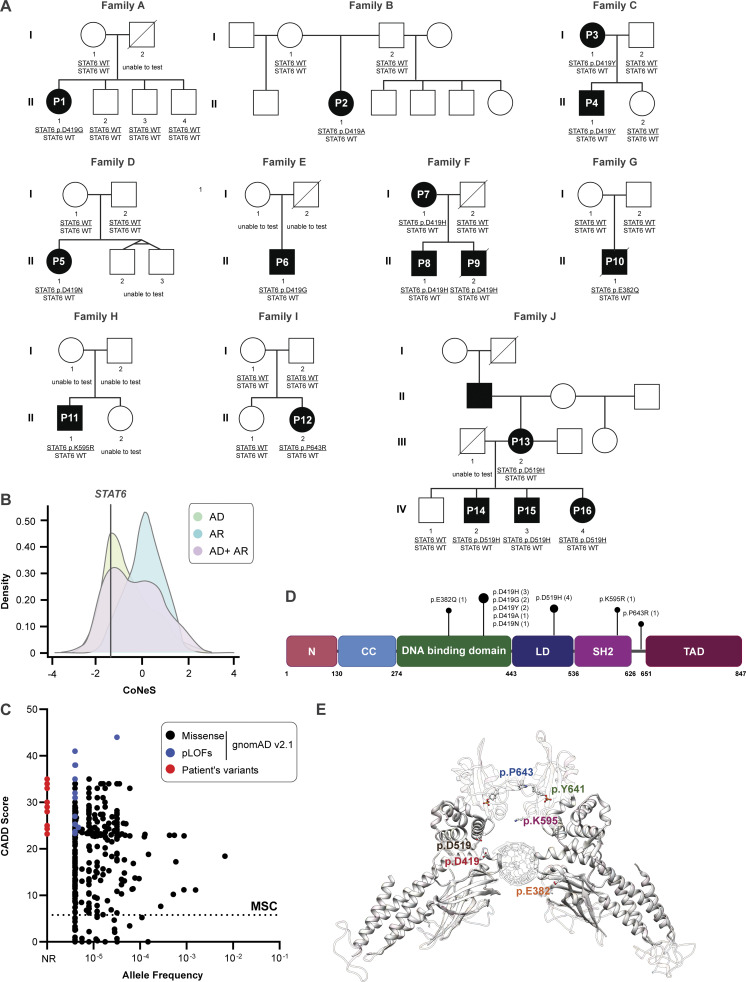
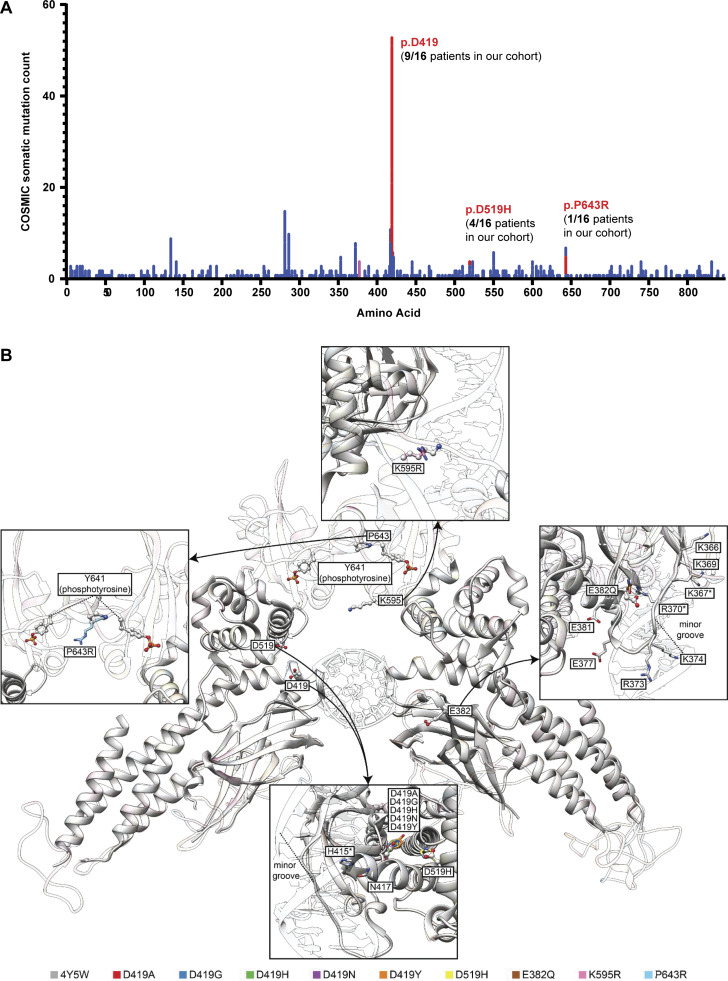
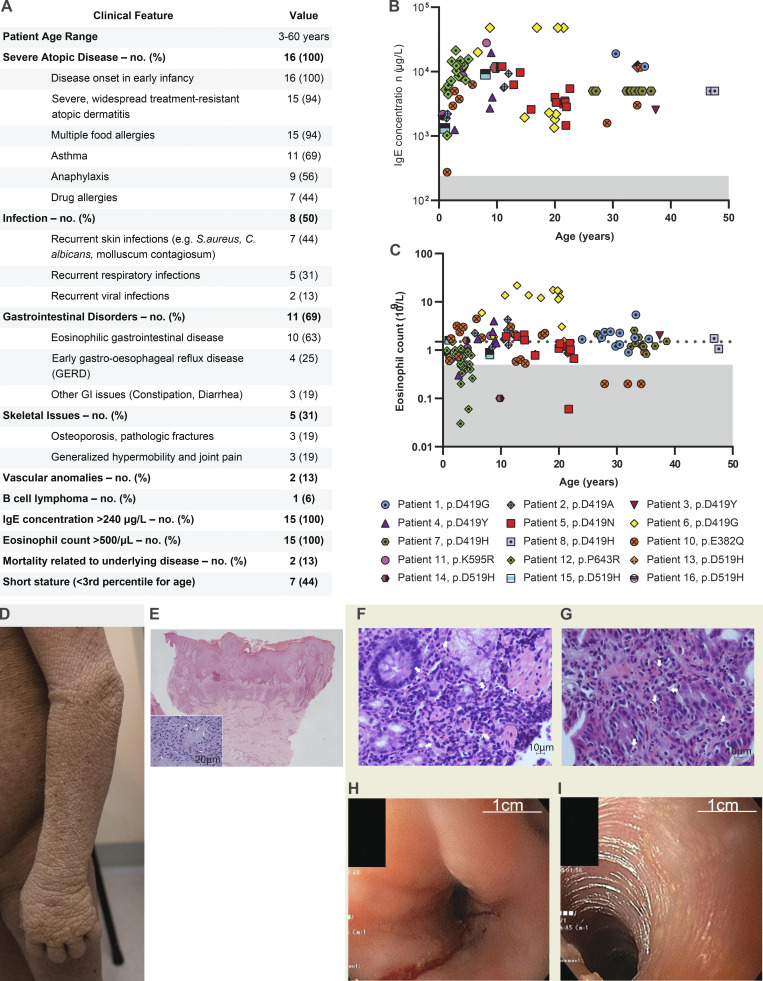
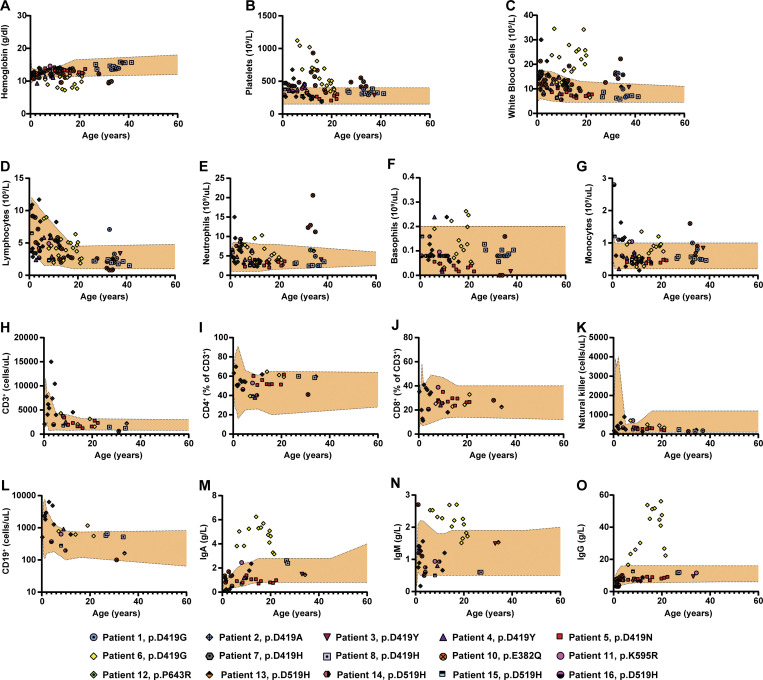
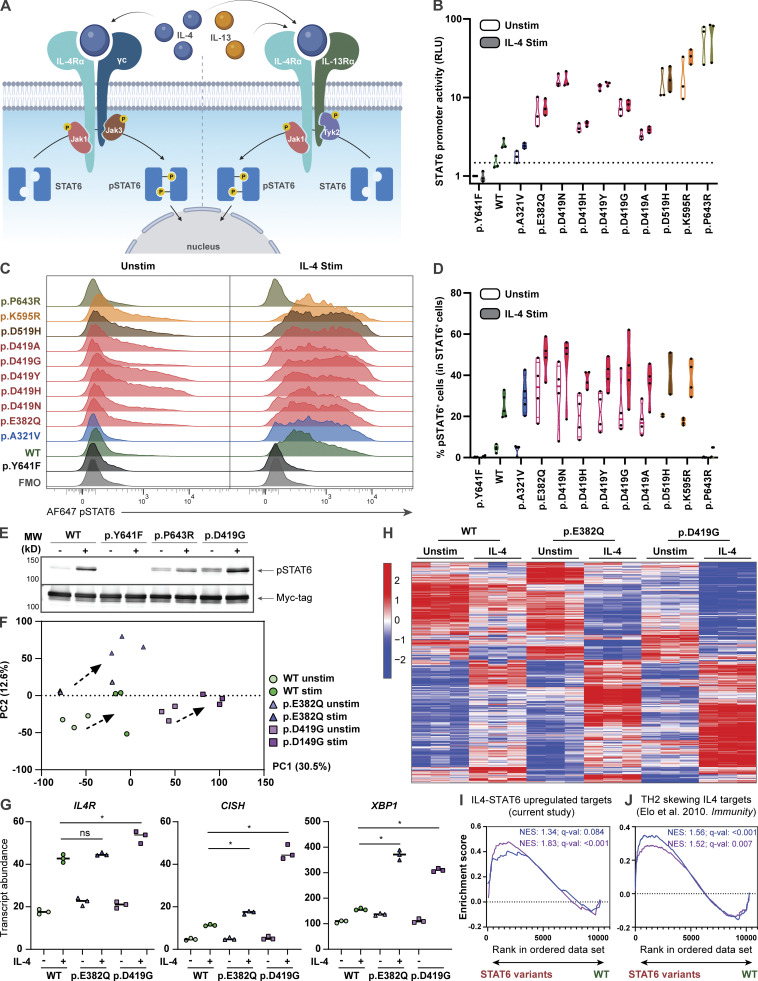
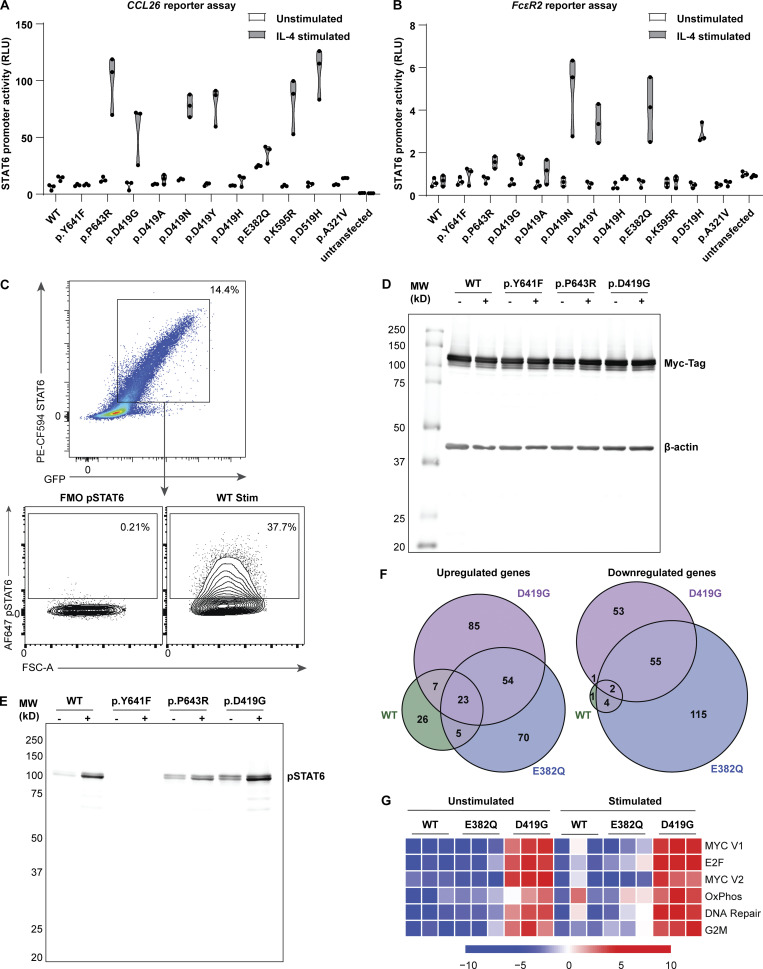
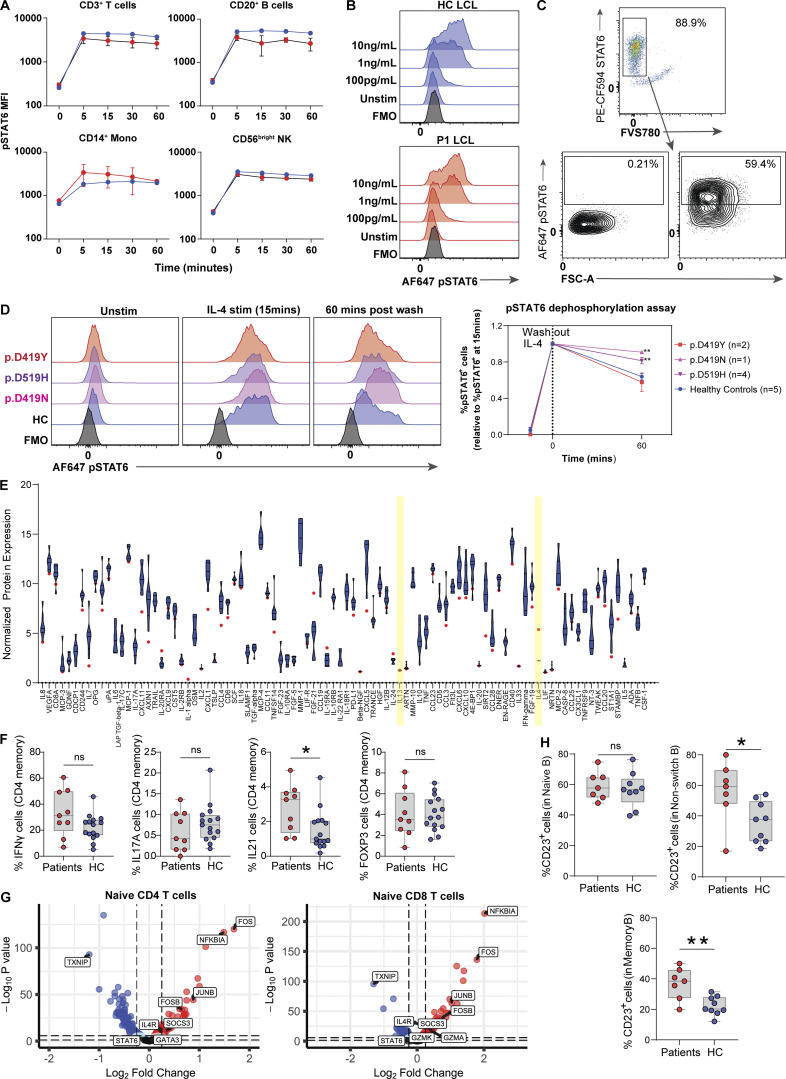
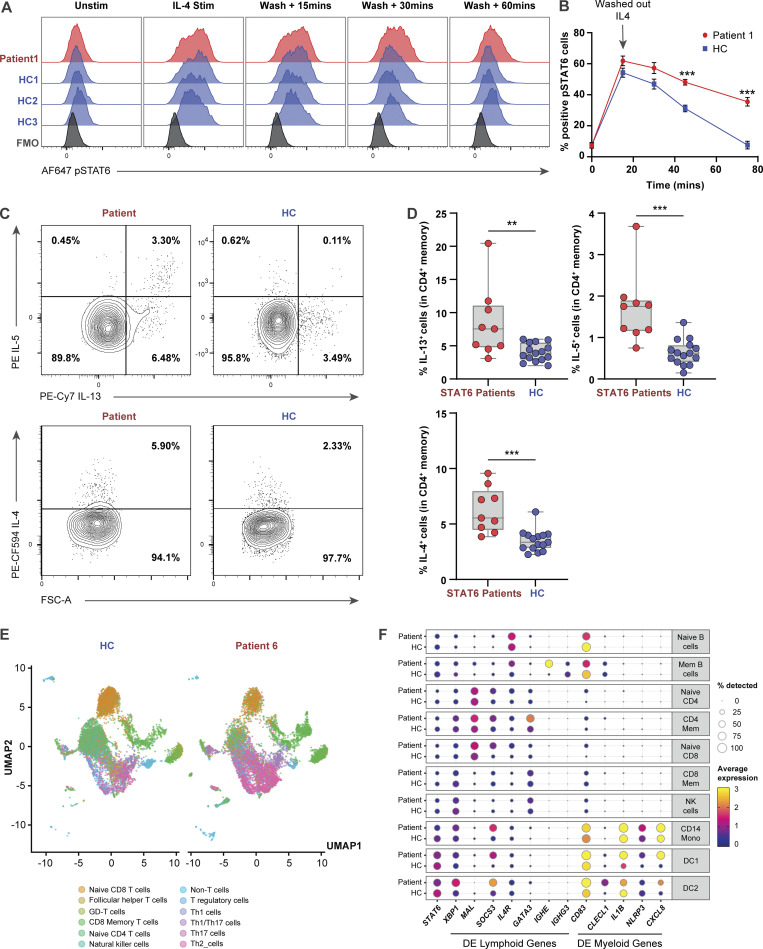
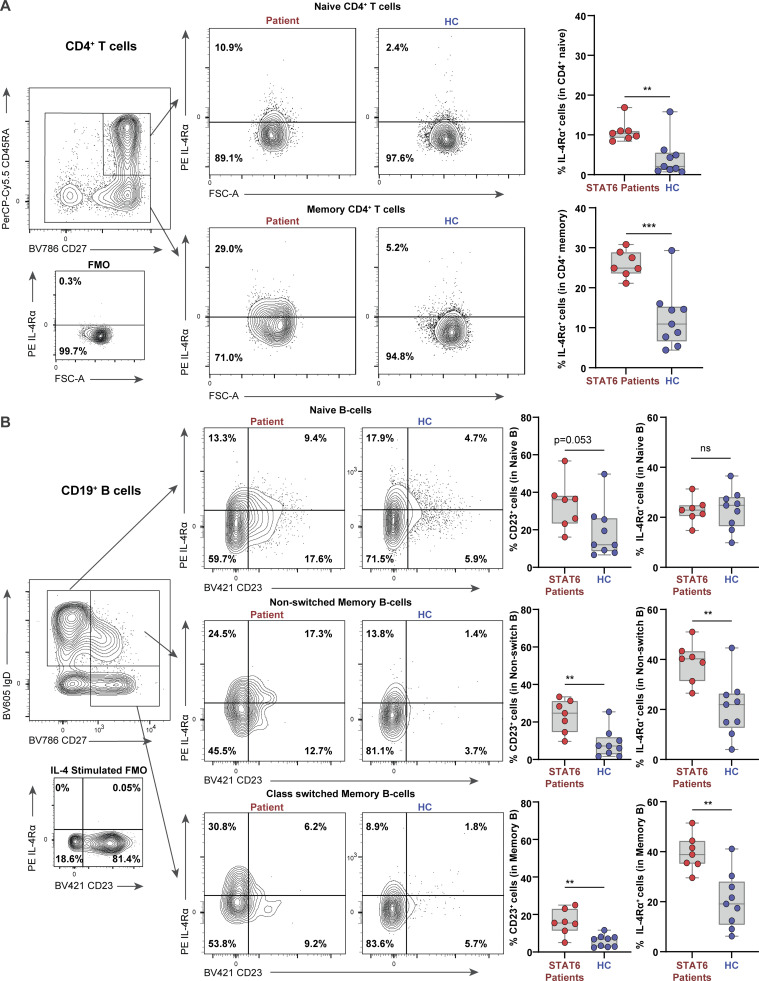
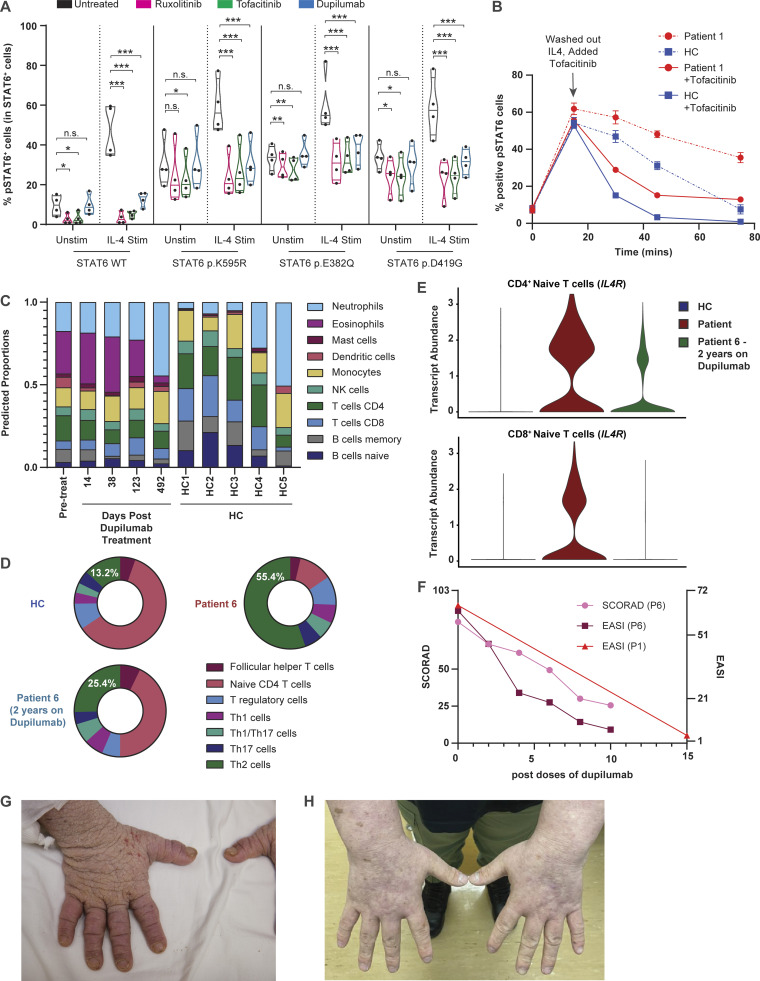
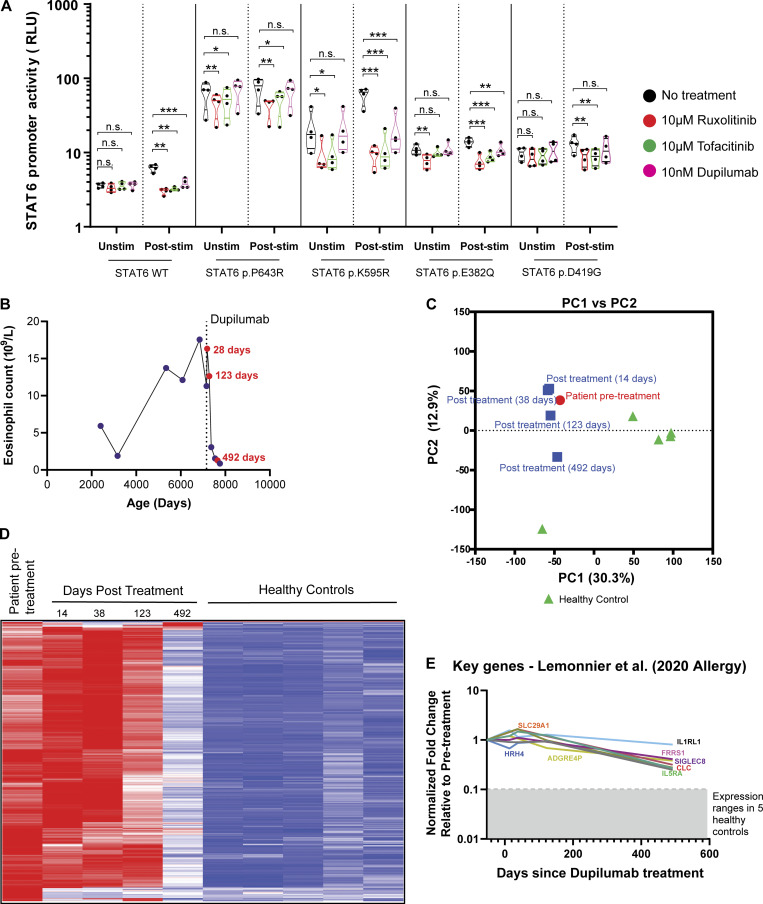
STAT6 (signal transducer and activator of transcription 6) is a transcription factor that plays a central role in the pathophysiology of allergic inflammation. We have identified 16 patients from 10 families spanning three continents with a profound phenotype of early-life onset allergic immune dysregulation, widespread treatment-resistant atopic dermatitis, hypereosinophilia with esosinophilic gastrointestinal disease, asthma, elevated serum IgE, IgE-mediated food allergies, and anaphylaxis. The cases were either sporadic (seven kindreds) or followed an autosomal dominant inheritance pattern (three kindreds). All patients carried monoallelic rare variants in STAT6 and functional studies established their gain-of-function (GOF) phenotype with sustained STAT6 phosphorylation, increased STAT6 target gene expression, and TH2 skewing. Precision treatment with the anti-IL-4Rα antibody, dupilumab, was highly effective improving both clinical manifestations and immunological biomarkers. This study identifies heterozygous GOF variants in STAT6 as a novel autosomal dominant allergic disorder. We anticipate that our discovery of multiple kindreds with germline STAT6 GOF variants will facilitate the recognition of more affected individuals and the full definition of this new primary atopic disorder.


Conflict of interest statement

Disclosures: S. Delafontaine is supported by the Personal Research Foundation Flanders grant 11F4421N. T.F. Brown-Whitehorn reported grants from DBV Technology, “other” from DBV Technology, and grants from Regeneron outside the submitted work. J.R. Treat reported personal fees from Sanofi/Regeneron outside the submitted work. D. Bullens reported grants from Research Foundation Flanders and Sanofi Genzyme outside the submitted work. E.C. Morris reported personal fees from Quell Therapeutics Limited outside the submitted work. J.J. O’Shea reported a patent for Janus kinase inhibitors with royalties paid (National Institutes of Health). P. Palma reported grants from the ViiV Foundation and Chiesi Foundation outside the submitted work. S.O. Burns has received grant support from CSL Behring and personal fees or travel expenses from CSL Behring, Baxalta US Inc, Glaxo Smith Kline, and Biotest. I. Meyts reported grants from CSLBehring (paid to institution) and “other” from Boehringer-Ingelheim SAB (paid to institution) outside the submitted work. J. Heimall reported grants from Regeneron, CSL Behring, Enzyvant, and ADMA; and personal fees from CSL Behring, UpToDate, Enzyvant, ADMA, and CIRM outside the submitted work. No other disclosures were reported.

Figures

Figure 1.
Figure 1.
16 patients with severe allergic disease and STAT6 variants in different protein domains. (A) Family pedigree of the 16 patients from 10 different families. Filled symbols = affected individual; unfilled symbols = unaffected individual. (B) Consensus negative selection (CoNeS) score for STAT6 in relation to the score for known IEI genes reported with inheritance pattern of either AD, AR, or both (AD + AR). (C) Frequency and CADD score for missense (black) and predicted LOF (pLOF, blue) STAT6 variants reported in a public database and STAT6 variants reported in our patient cohort (red). The dotted line corresponds to the mutation significance cutoff (MSC). (D) Schematic illustrating the protein domains of STAT6. Amino acid location of the variants shown are highlighted, with the length of the bar corresponding to the number of patients reported with variants at that site. (E) Structural model of the DNA-STAT6 homodimer complex showing location of the different STAT6 variants in relation to the DNA-binding interface.
Figure S1.
Figure S1.
Pathogenic STAT6 germline variants lie in different protein domains and are frequently identified as somatic variants. (A) Somatic mutation counts for different amino acid changed as reported by COSMIC for STAT6. Red highlighted changes are those germline variants also identified in our cohort that cause severe allergic disease. (B) Structural model of the DNA-STAT6 homodimer complex showing location of the different STAT6 variants in relation to the DNA-binding interface. Specifically, zoom-ins for variants at each location are shown in relation to previously described variants known to affect STAT6 function.
Figure 2.
Figure 2.
Major clinical features of the 16 patients. (A) Tabulation and comparison of the clinical phenotype for 16 patients. Please note blood eosinophil and IgE values were only available for 15 patients. (B) IgE concentration in whole blood for 15 out of the 16 patients. Shaded area represents IgE < 240 µg/liter, which is the typical upper limit of normal. (C) Eosinophil count in whole blood for 15 out of the 16 patients. Shaded area represents counts <0.5 × 10⁹/liter, which is the typical upper limit of normal. The horizontal broken line denotes an eosinophil count of 1.5 × 10⁹/liter, since hypereosinophilic syndrome is traditionally defined as peripheral blood eosinophilia >1.5 × 10⁹/liter persisting ≥6 mo. (D) Photograph of widespread and severe atopic disease. (E) Photomicrograph of the skin biopsy showing marked pseudoepitheliomatous hyperplasia with acanthosis, hyperkeratosis, and focal parakeratosis, suggestive of lichen simplex chronicus (H&E stain, original magnification 2×). Moderate chronic inflammation within the papillary dermis in which scattered eosinophils (white arrows) are conspicuous (inset, H&E stain; original magnification, 40×). (F) Photomicrograph of duodenal biopsy showing abundant eosinophils (white arrows) amongst lymphocytes (H&E stain; original magnification, 40×). (G) Photomicrograph of gastric antral biopsy showing abundant infiltrate of eosinophils (arrows) amongst lymphocytes and plasma cells (H&E stain; original magnification, 40×). (H and I) Endoscopic images showing (H) furrowing and (I) trachealization in the middle esophagus, suggestive of eosinophilic esophagitis.
Figure S2.
Figure S2.
Complete blood counts and immunological workup of patients with pathogenic STAT6 variants. (A–G) Complete blood count for 15 out of the 16 patients and age-based references (orange-shaded area) for the following populations: (A) hemoglobin, (B) platelets, (C) white blood cells, (D) lymphocytes, (E) neutrophils, (F) basophils, and (G) monocytes. (H–L) Immunological workup for 15 out of the 16 patients showing age-based references (orange-shaded area) and populations quantification for: (H) CD3+ T cells, (I) CD4+ CD3+ T cells, (J) CD8+ CD3+ T cells, (K) NK cells, and (L) CD19+ B cells. (M–O) Immunoglobulin concentrations for 15 out of the 16 patients showing age-based references (orange-shaded area): (M) IgA, (N) IgM, and (O) IgA.
Figure 3.
Figure 3.
STAT6 variants lead to increased STAT6 activity in HEK293 cells and Jurkat T cells. (A) Schematic illustrating classical IL-4–mediated STAT6 activation, dimerization, and phosphorylation. (B) Luciferase assay of STAT6 activity on a plasmid containing a 4× STAT6 binding site (TTCCCAAGAA; the underlined bases represent two half-sites for STAT6-specific binding) for WT-, different STAT6 variant–transfected HEK293 cells before and after stimulation with IL-4 (0.02 ng/ml for 4 h); n = 3. (C) Phospho-STAT6 (Y641) expression in WT- and STAT6 variant–transfected HEK293 cells before and after treatment with IL-4 (10 ng/ml for 30 min). Gating strategy for pSTAT6+ cells can be found in Fig. S3 C. (D) Quantification of C; n = 4. (E) Immunoblot in HEK293 cells transfected with WT-, inactive- (p.Y641F), p.P643R-, and p.D419G-STAT6 variants for pSTAT6, and Myc-tag before and after treatment with IL-4 (10 ng/ml for 30 min); n = 3. Full-length immunoblot for this can be found in Fig. S3, D and E. (F) Principal component analysis (PCA) comparing unstimulated and stimulated (100 ng/ml IL-4 for 4 h) WT (green), p.E382Q (blue), and p.D419G (purple) STAT6-transduced Jurkat T cells. Individual symbols represent technical replicates of one transduced pool for each genotype. PC1 and PC2 contribution is shown in brackets. (G) Normalized counts comparing stimulated WT (green) vs. p.E382Q (blue) or p.D419G (purple), for IL4R, CISH, and XBP1. (H) Heatmap representation of normalized counts of a transcription set defined as IL-4 targets in transduced Jurkat T cells. (I and J) Asterisk indicates adjusted P value <0.05. GSEA plots for (I) curated STAT6 target genes comparing WT vs. either p.E382Q (blue) or p.D419G (purple) at baseline, or (J) IL-4-TH2 targets genes comparing WT vs. either p.E382Q (blue) or p.D419G (purple) after stimulation with IL-4. Normalized enrichment score and adjusted P value are shown. Source data are available for this figure: SourceData F3.
Figure S3.
Figure S3.
In vitro assays demonstrate that STAT6 variants lead to increased STAT6 activity. (A and B) Luciferase assay of STAT6 activity on a plasmid containing (A) CCL26 promoter and (B) FcεR2 promoter for WT-, different STAT6-variant transfected HEK293 cells before and after stimulation with IL-4 (100 ng/ml for 40 h), n = 3. (C) Gating strategy for determining % positive HEK293 pSTAT6 cells: dot plot for fluoresence minus one (FMO) is presented and was used for establishing pSTAT6+ cells. (D and E) Full-length immunoblots of the cropped immunoblots shown in Fig. 3 E, showing HEK293 cells transfected with WT-, inactive- (p.Y641F), p.P643R-, and p.D419G- STAT6 variants for (D) Myc-tag and β-actin, as well as (E) pSTAT6 before and after treatment with IL-4 (10 ng/ml for 30 min). (F) Significantly upregulated (i) and downregulated (ii) genes upon IL-4 treatment in WT (green), p.E382Q (blue), and p.D419G (purple) in Jurkat cells as shown through Venn diagram. (G) Sample level enrichment analyses of significantly enriched immune pathways from MSigDB Hallmark in unstimulated and IL-4–stimulated samples, comparing WT vs. either p.E382Q or p.D419G. Heatmap is normalized across the rows and shown as relative expression.
Figure S4.
Figure S4.
Measure of STAT6 activity in patient primary lymphocytes. (A) 1-h time course to measure phosphorylation of STAT6 in different populations of lymphocytes from five patients (red) and one healthy control (blue) after stimulation with IL-4 (10 ng/ml). (B) Dose response in LCLs of patient one (red) vs. one healthy control (blue) after stimulation of cells with various doses of IL-4 15 min. (C) Gating strategy to determine % pSTAT6 positive cells in LCLs: dot plot for FMO is presented and was used for establishing pSTAT6+ cells. (D) Histograms showing phosphorylation of STAT6 in healthy control (blue) and patients with genotype p.D419Y (red, n = 2), p.D519H (purple, n = 4), p.D419N (pink, n = 1), and healthy controls (blue, n = 5) in T cell blasts that were stimulated with IL-4 (10 ng/ml) for 15 min, washed with PBS, and subsequently incubated in IL-4–free media for 60 min. Quantification of pSTAT6+ cells is presented and normalized to max stimulation (noted at 15 min). Two-way ANOVA followed by Šídák’s multiple comparisons was conducted. **, P < 0.01. (E) Readout of 92 biomarkers for P5 using throughput Olink proteomics. Eight healthy control distribution are shown as a violin plot in blue. The patient is shown as a red circle. Key cytokines, IL-4 and IL-13, are highlighted in yellow. (F) T helper cell distribution for nine patients (red) and 15 age-matched healthy controls (blue) each. (G) Transcriptomic comparison of naive CD4+ and naive CD8+ T cells between P6 and one healthy control measured through scRNAseq. Red genes are enriched in patient; blue genes are enriched in healthy control. The two dotted lines are the P value and adjusted P value respectively. (H) Quantification of % CD23 positive cells in naive, non-class switched memory, and class-switched memory B cells between patients (red, n = 7) and healthy controls (blue, n = 9) after stimulation with IL-4 (10 ng/ml) for 20 h. Unpaired t test. *, P < 0.05; **, P < 0.01.
Figure 4.
Figure 4.
Primary lymphocytes of STAT6 GOF patients display higher STAT6 activity and TH2 skewing. (A) Histograms showing phosphorylation of STAT6 in healthy control (blue) and patient (red) LCLs that were stimulated with IL-4 (10 ng/ml) for 15 min, washed with PBS and subsequently incubated in IL-4–free media for 15, 30, and 60 min. Gating strategy for pSTAT6+ cells can be found in Fig. S4 C. (B) Quantification of pSTAT6+ cells from three separate experiments done in A, multiple unpaired t test corrected for multiple comparison using the Benjamini–Hochberg method. ***, P < 0.001. (C) Frequency of IL5+, IL13+, and IL4+ cells in memory CD4+ T cells of one representative patient, along with one representative healthy control. (D) Quantification of C showing IL5+, IL13+, and IL4+ cells in patients along with 15 age-matched healthy controls. **, P < 0.01; ***, P < 0.001. (E) Uniform manifold approximation and projection (UMAP) visualization of scRNAseq done on enriched T cells comparing one patient with one age-matched healthy control. (F) Dot plot showing expression of selected differentially expressed genes (adjusted P value < 0.05) observed in scRNAseq between patient and healthy control and associated with T cells, B cells, monocytes, or dendritic cells.
Figure 5.
Figure 5.
Primary lymphocytes of STAT6 GOF patients display high expression of STAT6 target genes. (A) Expression of IL4Rα in naive and memory CD4+ cells is quantified as % positive cells in primary patient cells (n = 7, red) and healthy controls (n = 9, blue). Gating strategy for naive and memory and CD4+ is presented along with a dot plot for a fluoresence minus one (FMO) IL-4Rα sample to display IL-4Rα+ gating, as well as a representative dot plot for a patient and healthy control. (B) Expression of CD23 and IL4Ra in naive, non-class switched memory and memory B cells is quantified as % positive cells in primary patient cells (n = 7, red) and healthy controls (n = 9, blue). Gating strategy for B cell subsets is presented along with a dot plot for an FMO IL-4Rα sample to display IL-4Rα+ gating, as well as a representative dot plot for a patient and healthy control. Unpaired t test. **, P < 0.01; ***, P < 0.001.
Figure 6.
Figure 6.
JAK inhibitors and IL-4Rα antibody can be used as potential therapeutics for patients with GOF STAT6 variants. (A) Quantification of phospho-STAT6 expression in transfected HEK293 cells left untreated (black) pre-treated with ruxolitinib (10 μM, 1 h; pink), tofacitinib (10 μM, 1 h; green), or dupilumab (10 nM, 1 h; blue), before and after stimulation with IL-4 (10 ng/ml, 30 min). Individual points represent separate transfections for each genotype (n = 4). Gating strategy for pSTAT6+ cells can be found in Fig. S3 C. One-way ANOVA and Tukey’s post-hoc test. *, P < 0.05; **, P < 0.01; ***, P < 0.001. (B) Quantification of pSTAT6+ cells in patient (red) and healthy control (blue) LCLs stimulated with IL-4 (10 ng/ml for 15 min), washed and incubated in tofacitinib (10 μM) for 15, 30, and 60 min. Dotted translucent lines are indicative of no tofacitinib treatment (Fig. 4 B); n = 1. Gating strategy for pSTAT6+ cells can be found in Fig. S4 C. (C) Cell type proportion gene signature as determined by the software Cibersort, in a patient undergoing dupilumab treatment for 2 yr and five healthy controls. Cell labels are listed on the right. (D) Donut plot showing frequencies of CD4+ T helper subsets in one patient, an age-matched healthy control (Fig. 4 E), and a 2-yr post-dupilumab treatment patient sample as measured by scRNAseq on enriched T cells. Frequency of TH2 cells is quantified in the donut plots of the different samples. (E) Violin plots showing expression of IL4R in the patient (red), healthy control (blue), and a 2-yr post-dupilumab sample (green). (F) Eczema scoring, EASI and SCORAD, for two patients after treatment with multiple doses of dupilumab. (G and H) Photographs of hands showing (G) the severity of atopic dermatitis before and (H) the improvement after dupilumab treatment.
Figure S5.
Figure S5.
STAT6 activity can be therapeutically targeted and can resolve clinical disease severity. (A) Quantification of luciferase assay in HEK293 transfected cells pre-treated with ruxolitinib (10 μM, 1 h), tofacitinib (10 μM, 1 h), or dupilumab (10 nM, 1 h), before and after stimulation with IL-4 (0.02 ng/ml, 4 h). n = 4. One-way ANOVA and Tukey’s post-hoc test. *, P < 0.05; **, P < 0.01; ***, P < 0.001. (B) Eosinophil counts before and following initiation of treatment with dupilumab are presented. Dots in red corresponds to transcriptomic data from this patient presented in Fig. 6 C. (C) PCA comparing whole blood bulk RNAseq of P6 before treatment with dupilumab and four time points after treatment, alongside five healthy controls. (D) Heatmap signatures of differentially expressed genes comparing pre-treatment patient samples against five healthy controls. Genes are row normalized. (E) Key genes, previously described to be biomarkers for allergic disease (Lemonnier et al., 2020) in whole blood RNA are presented for the patient samples. Gray shaded area is the range for the expression of these genes in five healthy controls.

Comment in

References

    1. Adzhubei, I.A., Schmidt S., Peshkin L., Ramensky V.E., Gerasimova A., Bork P., Kondrashov A.S., and Sunyaev S.R.. 2010. A method and server for predicting damaging missense mutations. Nat. Methods. 7:248–249. 10.1038/nmeth0410-248 - DOI - PMC - PubMed
    1. Aran, D., Looney A.P., Liu L., Wu E., Fong V., Hsu A., Chak S., Naikawadi R.P., Wolters P.J., Abate A.R., et al. . 2019. Reference-based analysis of lung single-cell sequencing reveals a transitional profibrotic macrophage. Nat. Immunol. 20:163–172. 10.1038/s41590-018-0276-y - DOI - PMC - PubMed
    1. Astle, W.J., Elding H., Jiang T., Allen D., Ruklisa D., Mann A.L., Mead D., Bouman H., Riveros-Mckay F., Kostadima M.A., et al. . 2016. The allelic landscape of human blood cell trait variation and links to common complex disease. Cell. 167:1415–1429.e19. 10.1016/j.cell.2016.10.042 - DOI - PMC - PubMed
    1. Bacharier, L.B., Maspero J.F., Katelaris C.H., Fiocchi A.G., Gagnon R., de Mir I., Jain N., Sher L.D., Mao X., and Liu D., et al. . 2021. Dupilumab in children with uncontrolled moderate-to-severe asthma. N. Engl. J. Med. 385:2230–2240. 10.1056/NEJMoa2106567 - DOI - PubMed
    1. Beck, L.A., Thaçi D., Hamilton J.D., Graham N.M., Bieber T., Rocklin R., Ming J.E., Ren H., Kao R., Simpson E., et al. . 2014. Dupilumab treatment in adults with moderate-to-severe atopic dermatitis. N. Engl. J. Med. 371:130–139. 10.1056/NEJMoa1314768 - DOI - PubMed

Publication types