. 2023 May 1;34(5):ar36.
doi: 10.1091/mbc.E22-05-0157. Epub 2023 Mar 8.

The nuclear isoforms of the Fragile X mental retardation RNA-binding protein associate with genomic DNA bridges

Affiliations

The nuclear isoforms of the Fragile X mental retardation RNA-binding protein associate with genomic DNA bridges

N Ledoux et al. Mol Biol Cell. .

Abstract

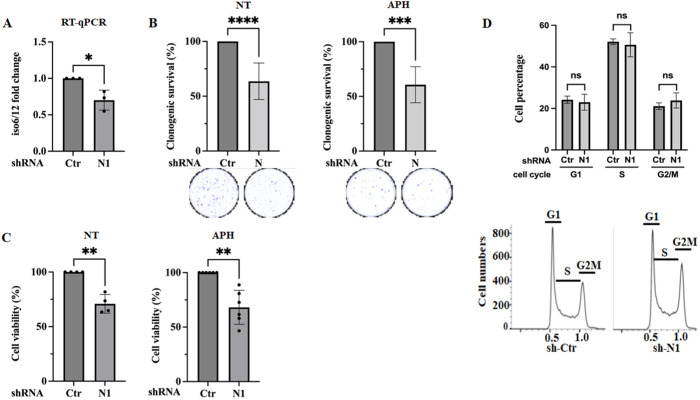
The fragile-X mental retardation protein (FMRP) is a canonical RNA-binding protein whose absence in humans leads to the development of the fragile-X syndrome, characterized by multiple phenotypes including neurodevelopmental disorders, intellectual disability, autism, and macroorchidism. The primary transcripts of the FMR1 gene undergo extensive alternative splicing processes, and multiple protein isoforms are produced. The predominantly cytoplasmic isoforms are translational regulators, while the roles of the nuclear ones have been neglected. In this study, we discovered that nuclear FMRP isoforms specifically associate with DNA bridges, aberrant genomic structures that form during mitosis and whose accumulation can drive genome instability by inducing DNA damage. Further localization studies showed that a subset of FMRP-positive bridges contain proteins that have been shown to associate with specific DNA bridges known as ultrafine DNA bridges (UFBs) and surprisingly are RNA positive. Significantly, the depletion of nuclear FMRP isoforms promotes the accumulation of DNA bridges, correlating with the accumulation of DNA damages and cell death, unveiling an important function of these neglected isoforms.


Figures

FIGURE 1:
FIGURE 1:
Iso6/12 associate with structures that are reminiscent of anaphase bridges. (A, B) Unsynchronized U2OS, A, and HeLa, B, were fixed and processed for immunofluorescence using #C10 antibodies. Images were acquired by the LSM 900 confocal microscope. Shown are U2OS and U2OS exhibiting mitotic characteristics (mitotic U2OS) with an FMRP bridge (indicated by arrows) reacting with #C10. DAPI stains DNA. The percentages of FMRP bridges (1 bridge/cell) reacting (positive) or not (undetected) with DAPI in either U2OS (n = 1000), mitotic U2OS (n = 400), or HeLa and mitotic HeLa (n = 400) are indicated in the right histograms, representing three independent experiments with a total of 80, 50, 20, and 10 analyzed bridges, respectively. Data are represented as mean ± SD. Scale bars (10 μm) are shown. (C) U2OS were fixed and processed for immunofluorescence using #C10. Images were acquired with the H-TIRF microscope. DAPI stains nuclear DNA. Cells with condensed DNA (mitotic) with or without a visible FMRP bridge were manually counted. The indicated percentages of mitotic U2OS with 1 FMRP-bridge/cell represent three experiments representing 500 mitotic cells (n = 500). Representative images are shown with mitotic U2OS indicated by a square. Scale bars (5 μm) are shown. (D) U2OS stably expressing either GFP-iso6 or -iso1 were fixed and processed for immunofluorescence using #C10 and GFP visualization. Shown are mitotic U2OS with GFP-iso6 bridges marked by arrows. The percentages of FMRP bridges that are either GFP-positive (1 bridge/cell) or not (undetected) in mitotic U2OS (n = 400) are indicated, representing a total of 20 analyzed bridges. Blue staining depicts nuclear DNA. Scale bars (5 μm) are shown. Note that no FMRP bridge observed with #C10 is positive for GFP-iso1 (undetected), while 100% of FMRP bridges detected by #C10 are positive for GFP-iso6. Images were acquired by the LSM 900 confocal microscope.
FIGURE 2:
FIGURE 2:
Iso6/12 bridges form during mitosis, with a subset accumulating upon replication stress. (A, B) A subset of FMRP bridges accumulate upon replicative stress. Unsynchronized U2OS were treated or not with APH (0.3 μM for 24 h) and preextracted with NP-40 detergent, and the resulting cell ghosts were fixed and processed for immunofluorescence using #C10 detecting FMRP bridges in both U2OS and mitotic U2OS. NT: not treated. Nuclear DNA is identified by DAPI staining. Scale bars (10 μm) are shown. Images acquired by the LSM 900 confocal microscope are shown in A. To quantify FMRP bridges, images were acquired with the H-TIRF microscope. Nuclei were counted using the analyzing tool of ImageJ software and FMRP bridges were manually counted. Quantification data of FMRP bridges detected in cell ghosts representing three independent experiments counting 2000 nuclei of U2OS and mitotic U2OS and expressed as a percentage of cells with one FMRP bridge are shown in B, with their representative images shown in bottom panels. Data are represented as mean ± SD of three independent experiments. Two-tailed Student’s t test was used. *p ≤ 0.05 (C–E) FMRP bridges accumulate during mitosis. (C–D) Schematic representation of U2OS cell-cycle synchronization and analysis by FACS. The percentages of cells in G1, S, and G2/M are indicated in D. After the release from the second thymidine block, cells are collected between 0 and 12 h postrelease and processed for FACS or immunofluorescence without cell ghosts using #C10. For quantification, image acquisitions were done with the H-TIRF microscope. Nuclei were counted using ImageJ software and FMRP bridges were manually counted. This experiment was done twice, representing 2000 cells. Representative images used for quantification are shown in E with a representative FMRP bridge in mitotic U2OS indicated.
FIGURE 3:
FIGURE 3:
FMRP bridges contain components known to associate with UFBs. (A, B) Unsynchronized U2OS were treated with NP-40 detergent as above and the resulting cell ghosts were fixed and processed for immunofluorescence with the indicated antibodies. FMRP bridges are indicated by squares. Scale bars (5 μm) are shown. Images, A, were acquired by the LSM confocal microscope. FMRP bridges in mitotic U2OS were counted manually. The percentage of FMRP bridges representing 1 bridge/cell that is positive for each analyzed UFB protein is indicated in B. Total number of analyzed cells is indicated.
FIGURE 4:
FIGURE 4:
FMRP bridges contain RNA signals. (A) Unsynchronized mock- and RNase A–treated U2OS were fixed and processed for immunofluorescence with m6A antibodies. DAPI stains nuclei. Scale bars (10 μm) are shown. Images were acquired by the LSM 900 confocal microscope. The m6A-RNA (m6A) signal in both U2OS and mitotic U2OS was quantified using ZEN 3.3 software (Zeiss). For quantification, the nuclear intensity of m6A signals in RNase-treated cells was measured and expressed as a percentage relative to the signals in mock-treated cells. The results are represented as mean ± SD. of five independent experiments analyzing a total of 200 cells. Two-tailed Student’s t test was used. *** p ≤ 0.001. (B–D) U2OS were treated with NP-40 as above and the resulting cell ghosts were fixed and processed for immunofluorescence using m6A and #C10. Shown are mitotic, B, and nonmitotic, C, U2OS with an FMRP bridge reacting with m6A antibodies. Scale bars (10 μm) are shown. For FMRP-bridge quantification, D, image acquisitions were done with the H-TIRF microscope as above. The indicated percentage of FMRP bridges (1 bridge/cell) positive for m6A (left histogram) is represented as mean ± SD of four independent experiments with a total of 2000 analyzed cells. (E) Unsynchronized mock- and RNase-treated U2OS were fixed and processed for immunofluorescence using S9.6 antibodies. The nuclear intensity of S9.6 signals in RNase-treated cells was measured and expressed as a percentage relative to the signals in mock-treated cells. Data are represented as mean ± SD of five independent experiments analyzing a total of 200 cells. Two-tailed Student’s t test was used. *** p ≤ 0.001. Scale bars (10 μm) are shown. (F, G) U2OS were treated with NP-40 as above and the resulting cell ghosts were fixed and processed for immunofluorescence using S9.6 and #C10. Mitotic, F, and nonmitotic, G, cells with an FMRP bridge (indicated by arrows) reacting with S9.6 antibodies are shown. Image acquisitions and quantification were performed as above. The indicated percentage of FMRP bridges positive for S9.6—D, right histogram—is representative of four independent experiments with a total of 3000 analyzed cells. Scale bars (10 μm) are shown. (H) Unsynchronized mock- and RNase-treated U2OS were fixed and processed for immunofluorescence using #C10. The indicated percentage of FMRP bridges represents data as mean ± SD of three independent experiments counting 2000 cells. Two-tailed Student’s t test was used. * p ≤ 0.05.
FIGURE 5:
FIGURE 5:
Nuclear FMRP isoforms regulate the accumulation of DNA bridges. (A) Positions of shRNAs and siRNAs. Iso6/12 are produced by splicing of (Ex)on14 and ligation of Ex13 with Ex15. To target iso6/12, we designed an sh-N1 and two siRNAs (N1 and N2) that are specific to the exonic 13–15 junction. (B) U2OS expressing either a control shRNA (sh-Ctr), sh-T1 (that targets all FMR1 mRNA isoforms), or sh-N1 (that targets specifically iso6/12 mRNAs) were collected, and their protein extracts analyzed by Western blot with mAb1C3 detecting iso1/7. Tubulin serves as a loading control for FMRP quantification representing more than four independent experiments. Data are represented as mean ± SD of four independent experiments. Two-tailed Student’s t test was used. ** p ≤ 0.01. ns: not significant. (C) RT-PCR of total RNA isolated from U2OS expressing shRNAs using specific oligos to either iso6/12 (top panel) or tubulin (bottom panel) used as a control. Shown are the resulting PCR products that are migrated by electrophoresis on agarose gels. (D) U2OS expressing the indicated shRNAs were lysed and their total RNA was isolated. The level of iso6/12 mRNA relative to GAPDH, RPL27, or R18S was quantified by RT-qPCR using the ΔΔCt method. Data are the mean ± SD of four independent experiments. Two-tailed Student’s t test was used. * p ≤ 0.05 and ** p ≤ 0.01. (E) U2OS expressing either sh-Ctr, sh-T1, or sh-N1 (described above) were processed for immunofluorescence with anti-BLM antibodies. Image acquisitions were done with the H-TIRF microscope. Cells were counted using the analyzing tool of the ImageJ software and BLM bridges (DAPI negative) detected in mitotic cells were manually counted. The indicated percentages of BLM bridges represent data of at least three independent experiments analyzing 1000 cells and are represented as mean ± SD. Two-tailed Student’s t test was used. * p ≤ 0.05 and ** p ≤ 0.01. Representative images of mitotic U2OS with BLM bridges are shown. (F) U2OS and U2OS stably expressing either GFP-iso6 or the control GFP were processed for immunofluorescence with anti-BLM antibodies. Image acquisitions were done with the H-TIRF microscope. Cells were counted using the analyzing tool of the ImageJ software and BLM bridges (DAPI negative) were manually counted. The indicated percentages of BLM bridges represent data from two independent experiments analyzing 200 cells. Data are represented as mean ± SD.
FIGURE 6:
FIGURE 6:
Nuclear FMRP isoforms alter DNA damage signaling. (A, B) U2OS expressing the indicated shRNA, A, or siRNAs, B, were harvested and their protein extracts were analyzed by Western blot using the indicated antibodies. Tubulin serves as a loading control. Depletion of FMRP was validated by Western blot analysis of iso1/7 levels, A and B, and by RT-qPCR assessing the levels of iso6/12 as described in Figure 5D and Supplemental Figure 6B. Data (γH2AX fold change) represent the results of six, A, and three, B, independent experiments. Data are represented as mean ± SD and two-tailed Student’s t test was used. ** p ≤ 0.01 and *** p ≤ 0.001. (C, D) U2OS expressing the indicated shRNAs were either left untreated, C, or treated with APH (0.3 μM for 24 h), D. Depletion of iso1/7 was validated by Western blot as in A and B, and depletion of iso6/12 was validated by RT-qPCR as described in Figure 5D and Supplemental Figure 7B. Cells were then processed for Western blot analysis using the γH2AX and tubulin antibodies, as above. Data (γH2AX fold change) represent five independent experiments, and are represented as mean ± SD. Two-tailed Student’s t test was used. ** p ≤ 0.01; * p ≤ 0.05. (E) U2OS expressing either sh-Ctr, sh-T1, or sh-N1 were processed for immunofluorescence with anti-γH2AX antibodies. Images were acquired by the LSM confocal microscope. The indicated percentage of cells with more than 10 γH2AX foci represents the results of two independent experiments counting 500 cells. Scale bars (10 μm) are shown. Depletion of iso1/7 and iso6/12 was validated as above. (F) APH-treated U2OS were processed for immunofluorescence with anti-γH2AX antibodies and #C10. Images were acquired by the LSM 900 confocal microscope. Shown are representative images of a total of 100 analyzed cells showing no significant localization of FMRP at γH2AX foci. Scale bars (10 μm) are shown. (G) Mock U2OS and U2OS stably expressing either GFP or GFP-iso6 were collected and their protein extracts were analyzed by Western blot with antibodies against either γH2AX or tubulin, which serves as a loading control (Top), or with anti-GFP antibodies (Bottom). Data (γH2AX fold change) are represented as mean ± SD of three independent experiments. Two-tailed Student’s t test was used. *** p ≤ 0.001.
FIGURE 7:
FIGURE 7:
Clonogenic, FACS, and MTT assays in iso6/12-depleted U2OS. (A) RT-qPCR validating depletion of iso6/12 in U2OS-expressing sh-N1 used in B–D. Data are represented as mean ± SD and two-tailed Student’s t test was used. * p ≤ 0.05. (B) Clonogenic assay. U2OS expressing the sh-Ctr and U2OS expressing sh-N1 were trypsinized, counted, replated, and treated with 1 mM of APH for 24 h. At the end of the treatment, cells were washed and incubated for 6–9 d in the absence of the drug before fixation. Populations > 20 cells were counted as one surviving colony. Data were calculated as the percentage of surviving U2OS expressing sh-N1 colonies relative to the number found in U2OS expressing sh-Ctr plates. Results are expressed as the mean ± SD of six measurements. Two-tailed Student’s t test was used. *** p ≤ 0.001; **** p ≤ 0.0001. Representative colony images are shown. (C) MTT viability assay. The indicated shRNA-expressing U2OS were treated with either DMSO or APH (0.3 μM) for 24 h, washed with PBS, and incubated for up to 48 h in the absence of the drug. MTT solvent was added at the last 2 h of incubation. The absorbance was measured at 560 and 630 nm. Viability data are presented as the percentage of the absorbance values of U2OS expressing the sh-N1 relative to U2OS expressing the sh-Ctr. Data are represented as mean ± SD of four independent experiments. Two-tailed Student’s t test was used. ** p ≤ 0.01. (D) FACS analysis. Unsynchronized U2OS expressing either the sh-Ctr or the sh-N1 were analyzed by FACS. Data are calculated as the percentage of U2OS expressing either sh-N1 or sh-Ctr in G1, S, and G2/M. Results are expressed as the mean ± SD of four independent measurements. Two-tailed Student’s t test was used. ns: not significant. Representative cell cycle profiles are shown (Bottom).

References

    1. Adjibade P, Simoneau B, Ledoux N, Gauthier WN, Nkurunziza M, Khandjian EW, Mazroui R (2020). Treatment of cancer cells with Lapatinib negatively regulates general translation and induces stress granules formation. PLoS One 15, e0231894. - PMC - PubMed
    1. Aguilera A, Garcia-Muse T (2012). R loops: from transcription byproducts to threats to genome stability. Mol Cell 46, 115–124. - PubMed
    1. Alarcon CR, Lee H, Goodarzi H, Halberg N, Tavazoie SF (2015). N6-methyladenosine marks primary microRNAs for processing. Nature 519, 482–485. - PMC - PubMed
    1. Albers E, Sbroggio M, Pladevall-Morera D, Bizard AH, Avram A, Gonzalez P, Martin-Gonzalez J, Hickson ID, Lopez-Contreras AJ (2018). Loss of PICH results in chromosomal instability, p53 activation, and embryonic lethality. Cell Rep 24, 3274–3284. - PMC - PubMed
    1. Allison DF, Wang GG (2019). R-loops: formation, function, and relevance to cell stress. Cell Stress 3, 38–46. - PMC - PubMed

Publication types

LinkOut - more resources