. 2023 Mar 28;42(3):112203.
doi: 10.1016/j.celrep.2023.112203. Epub 2023 Mar 6.

A non-hallucinogenic LSD analog with therapeutic potential for mood disorders

Affiliations

A non-hallucinogenic LSD analog with therapeutic potential for mood disorders

Vern Lewis et al. Cell Rep. .

Abstract

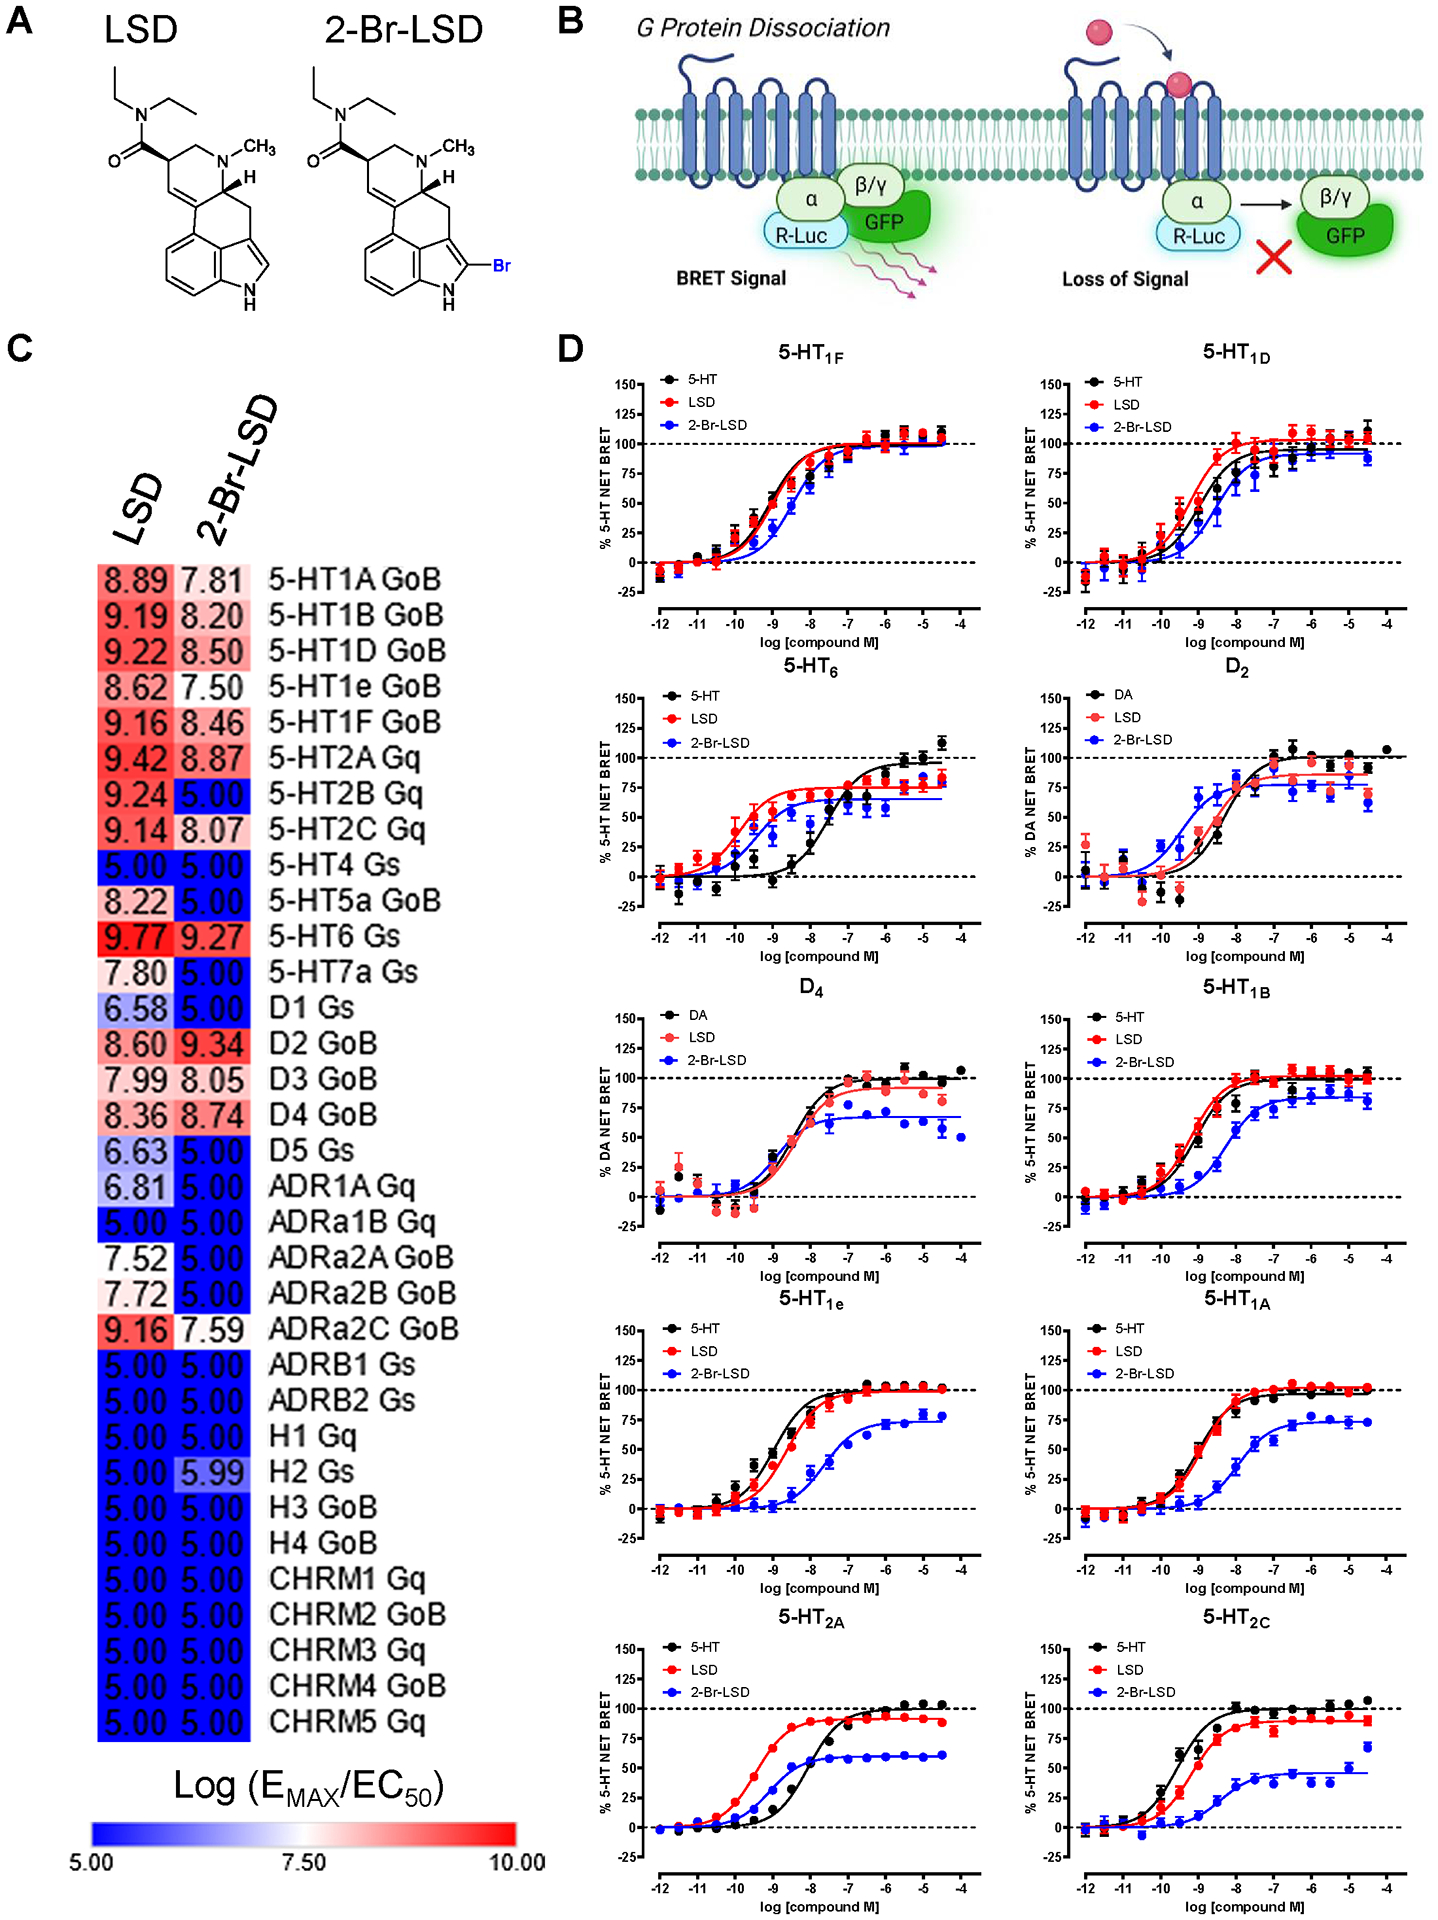
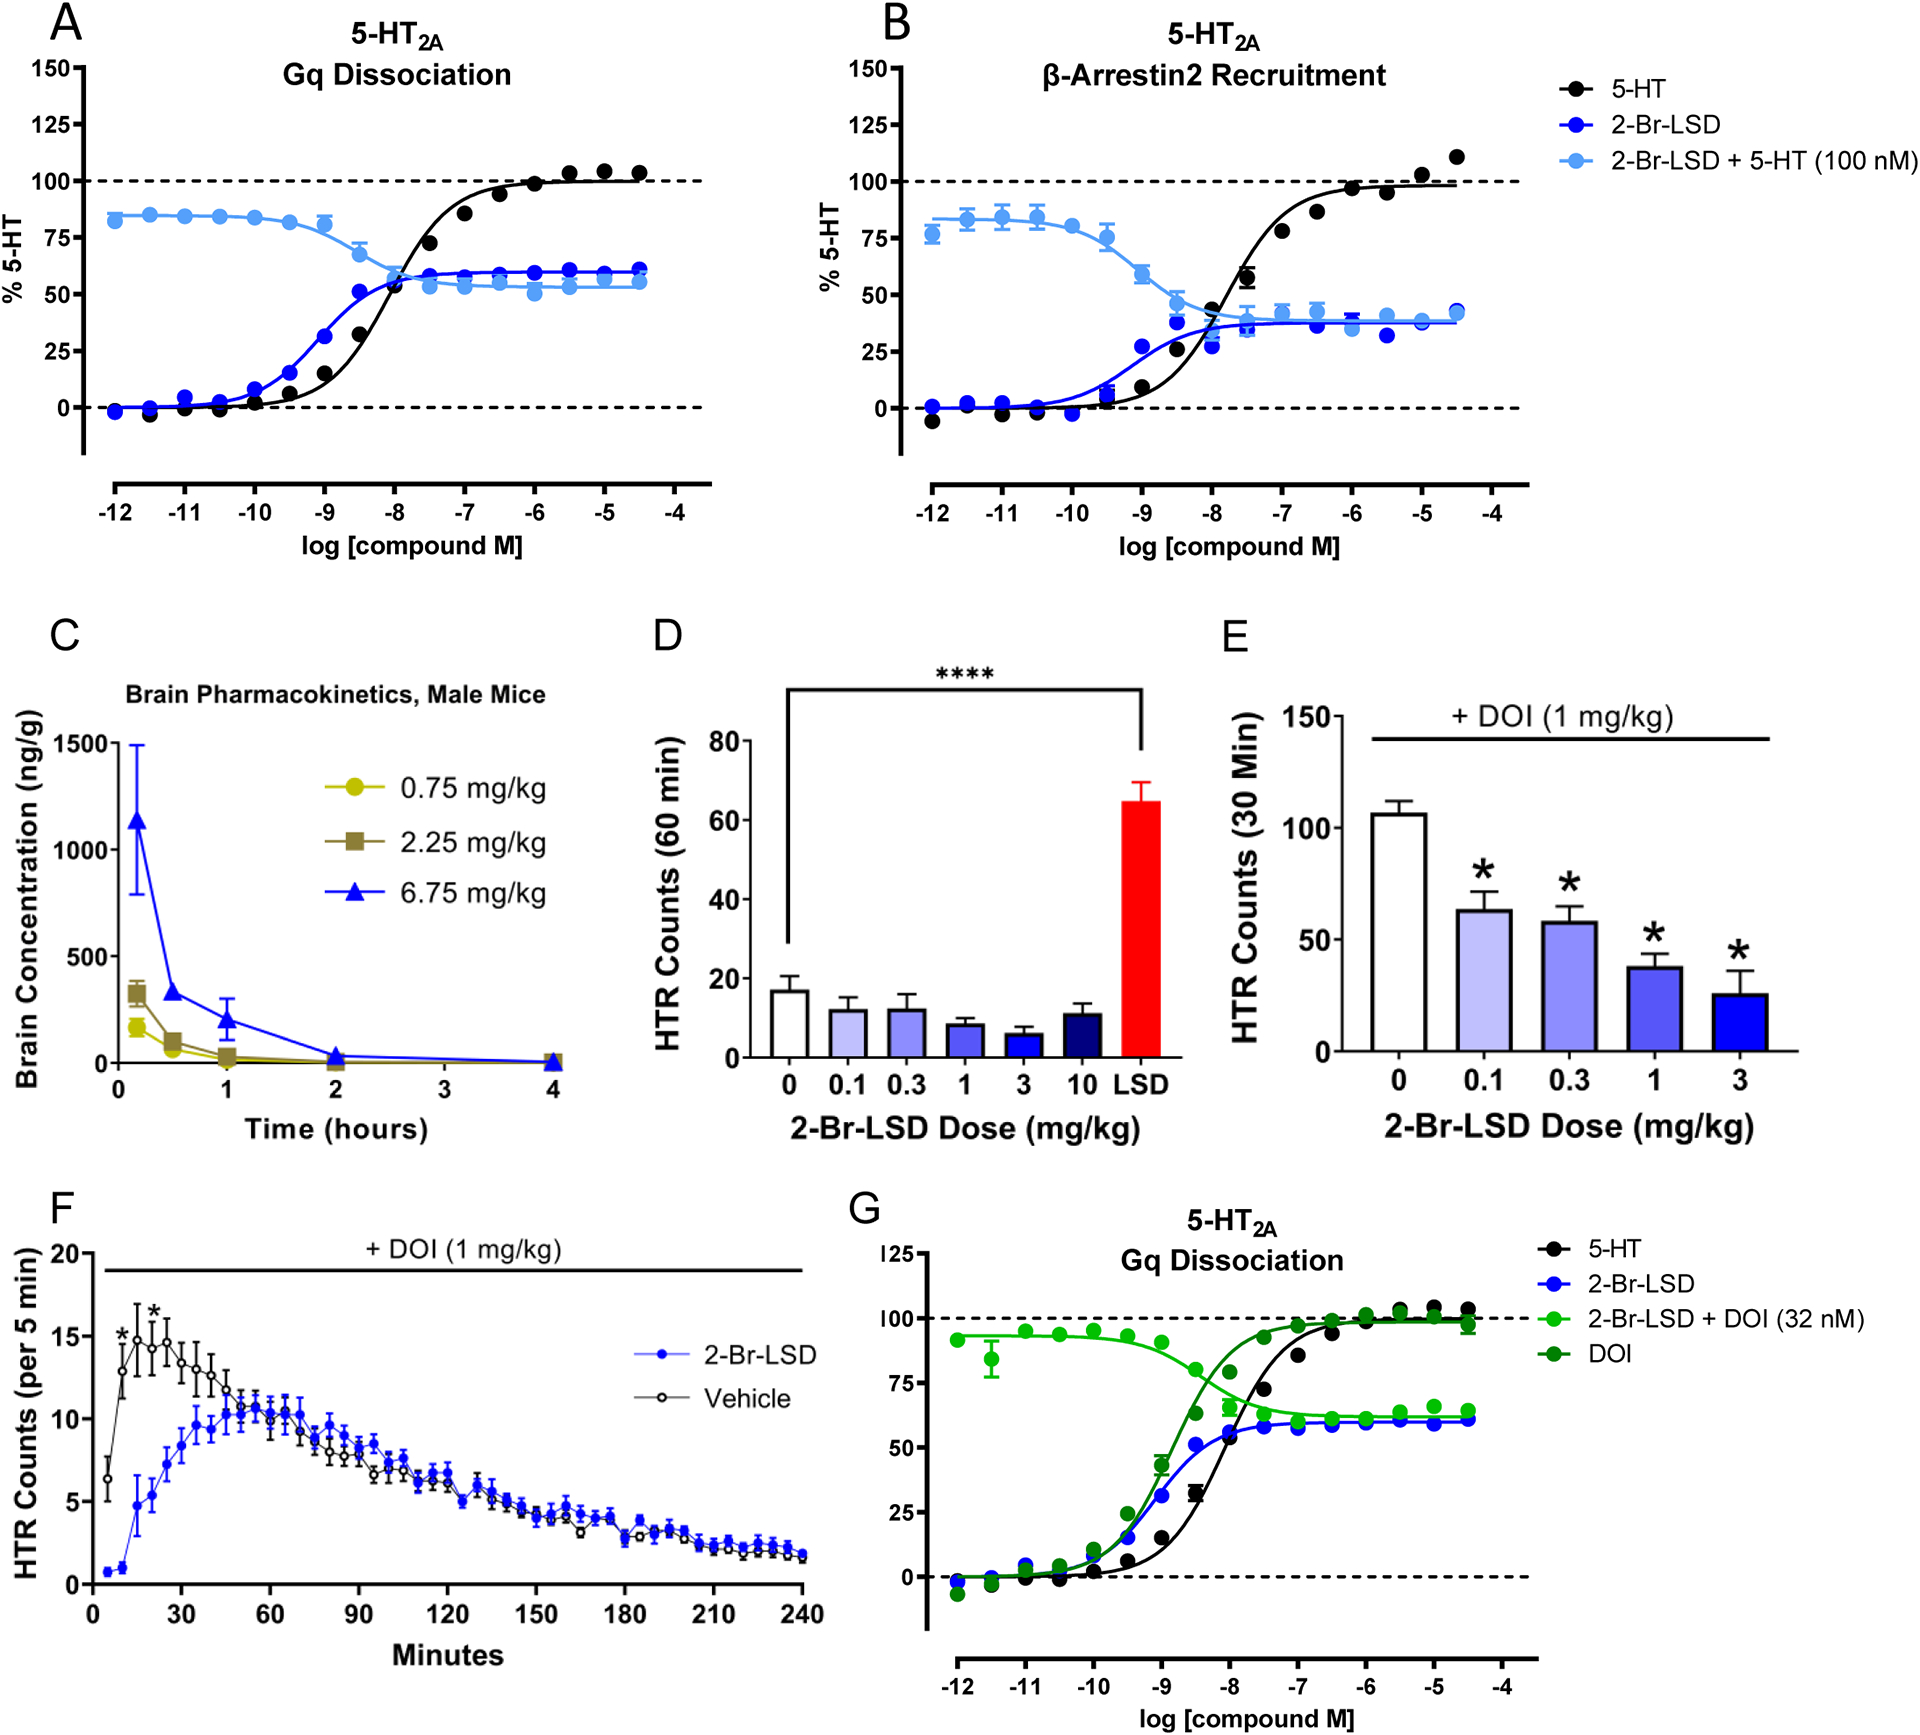
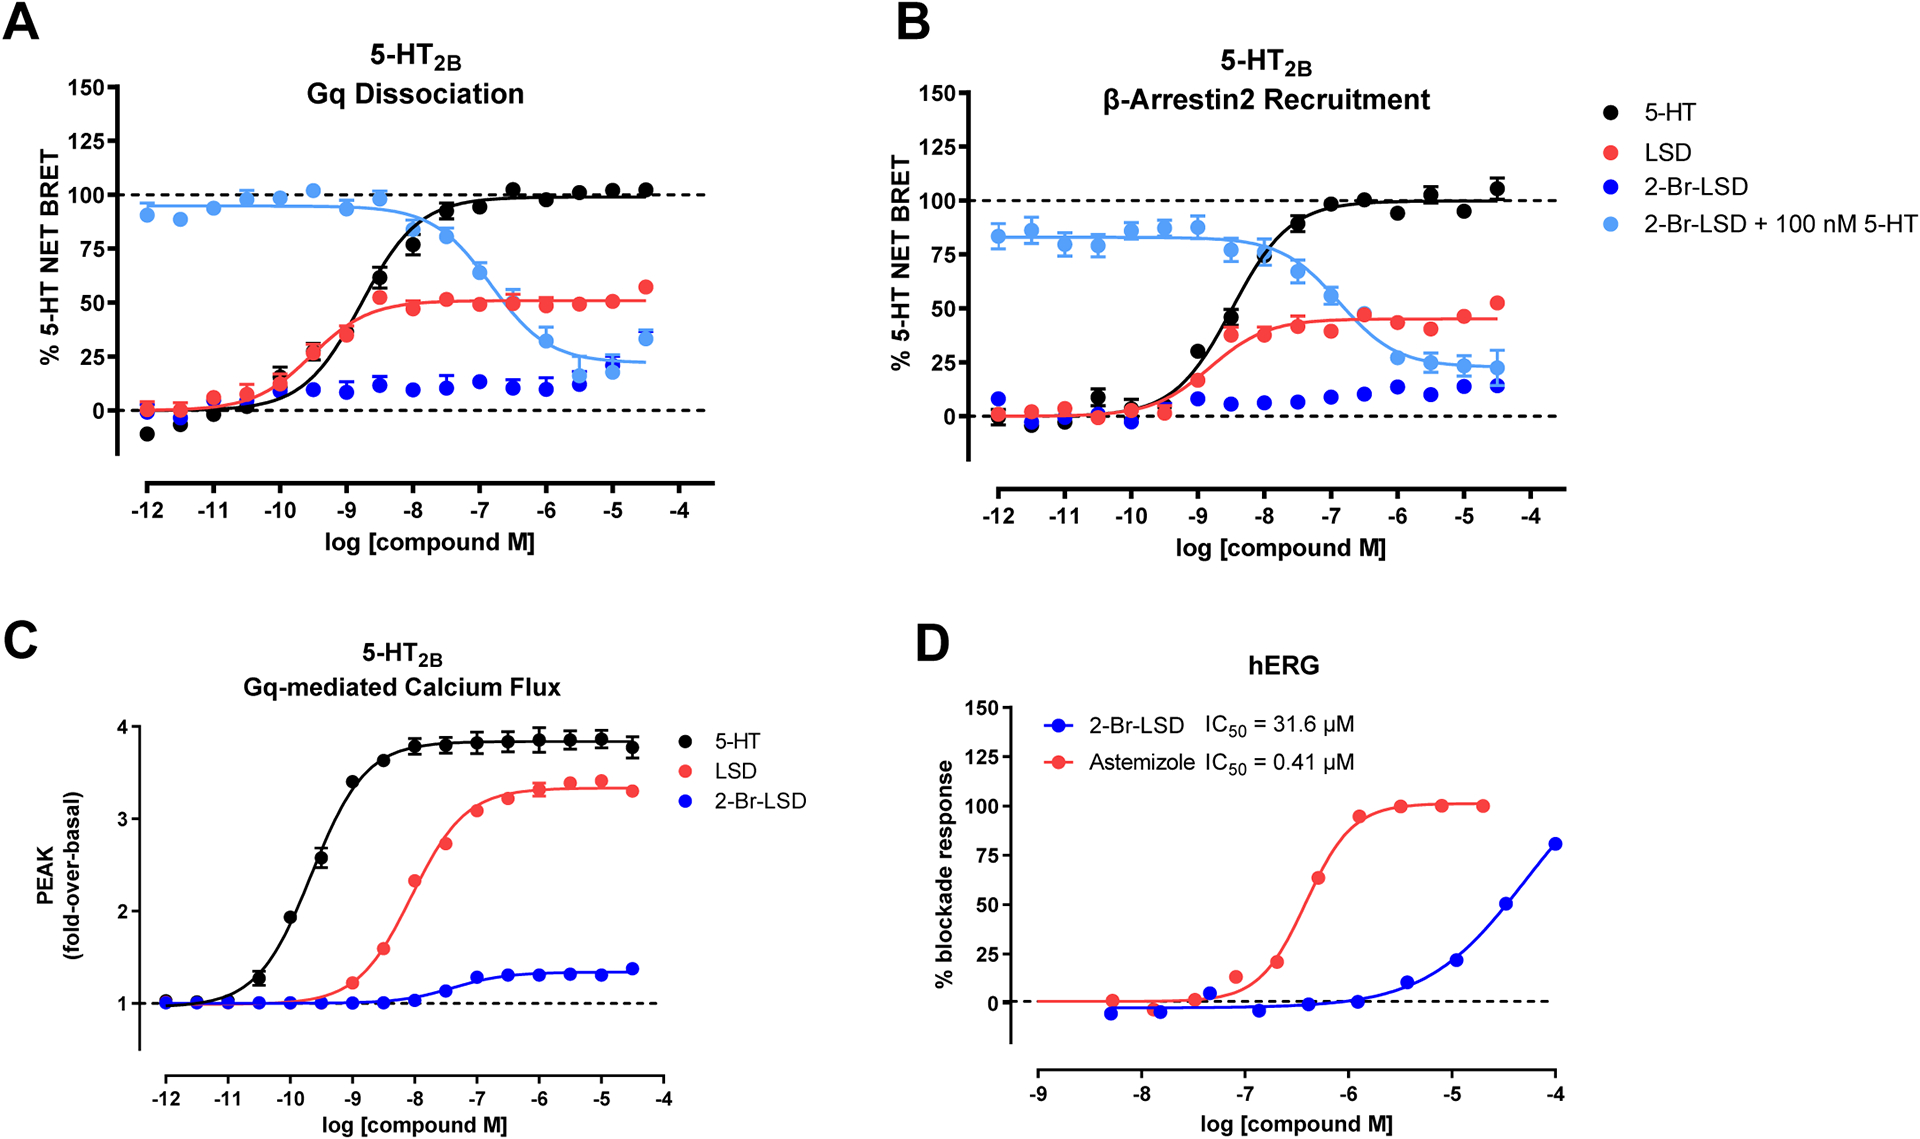
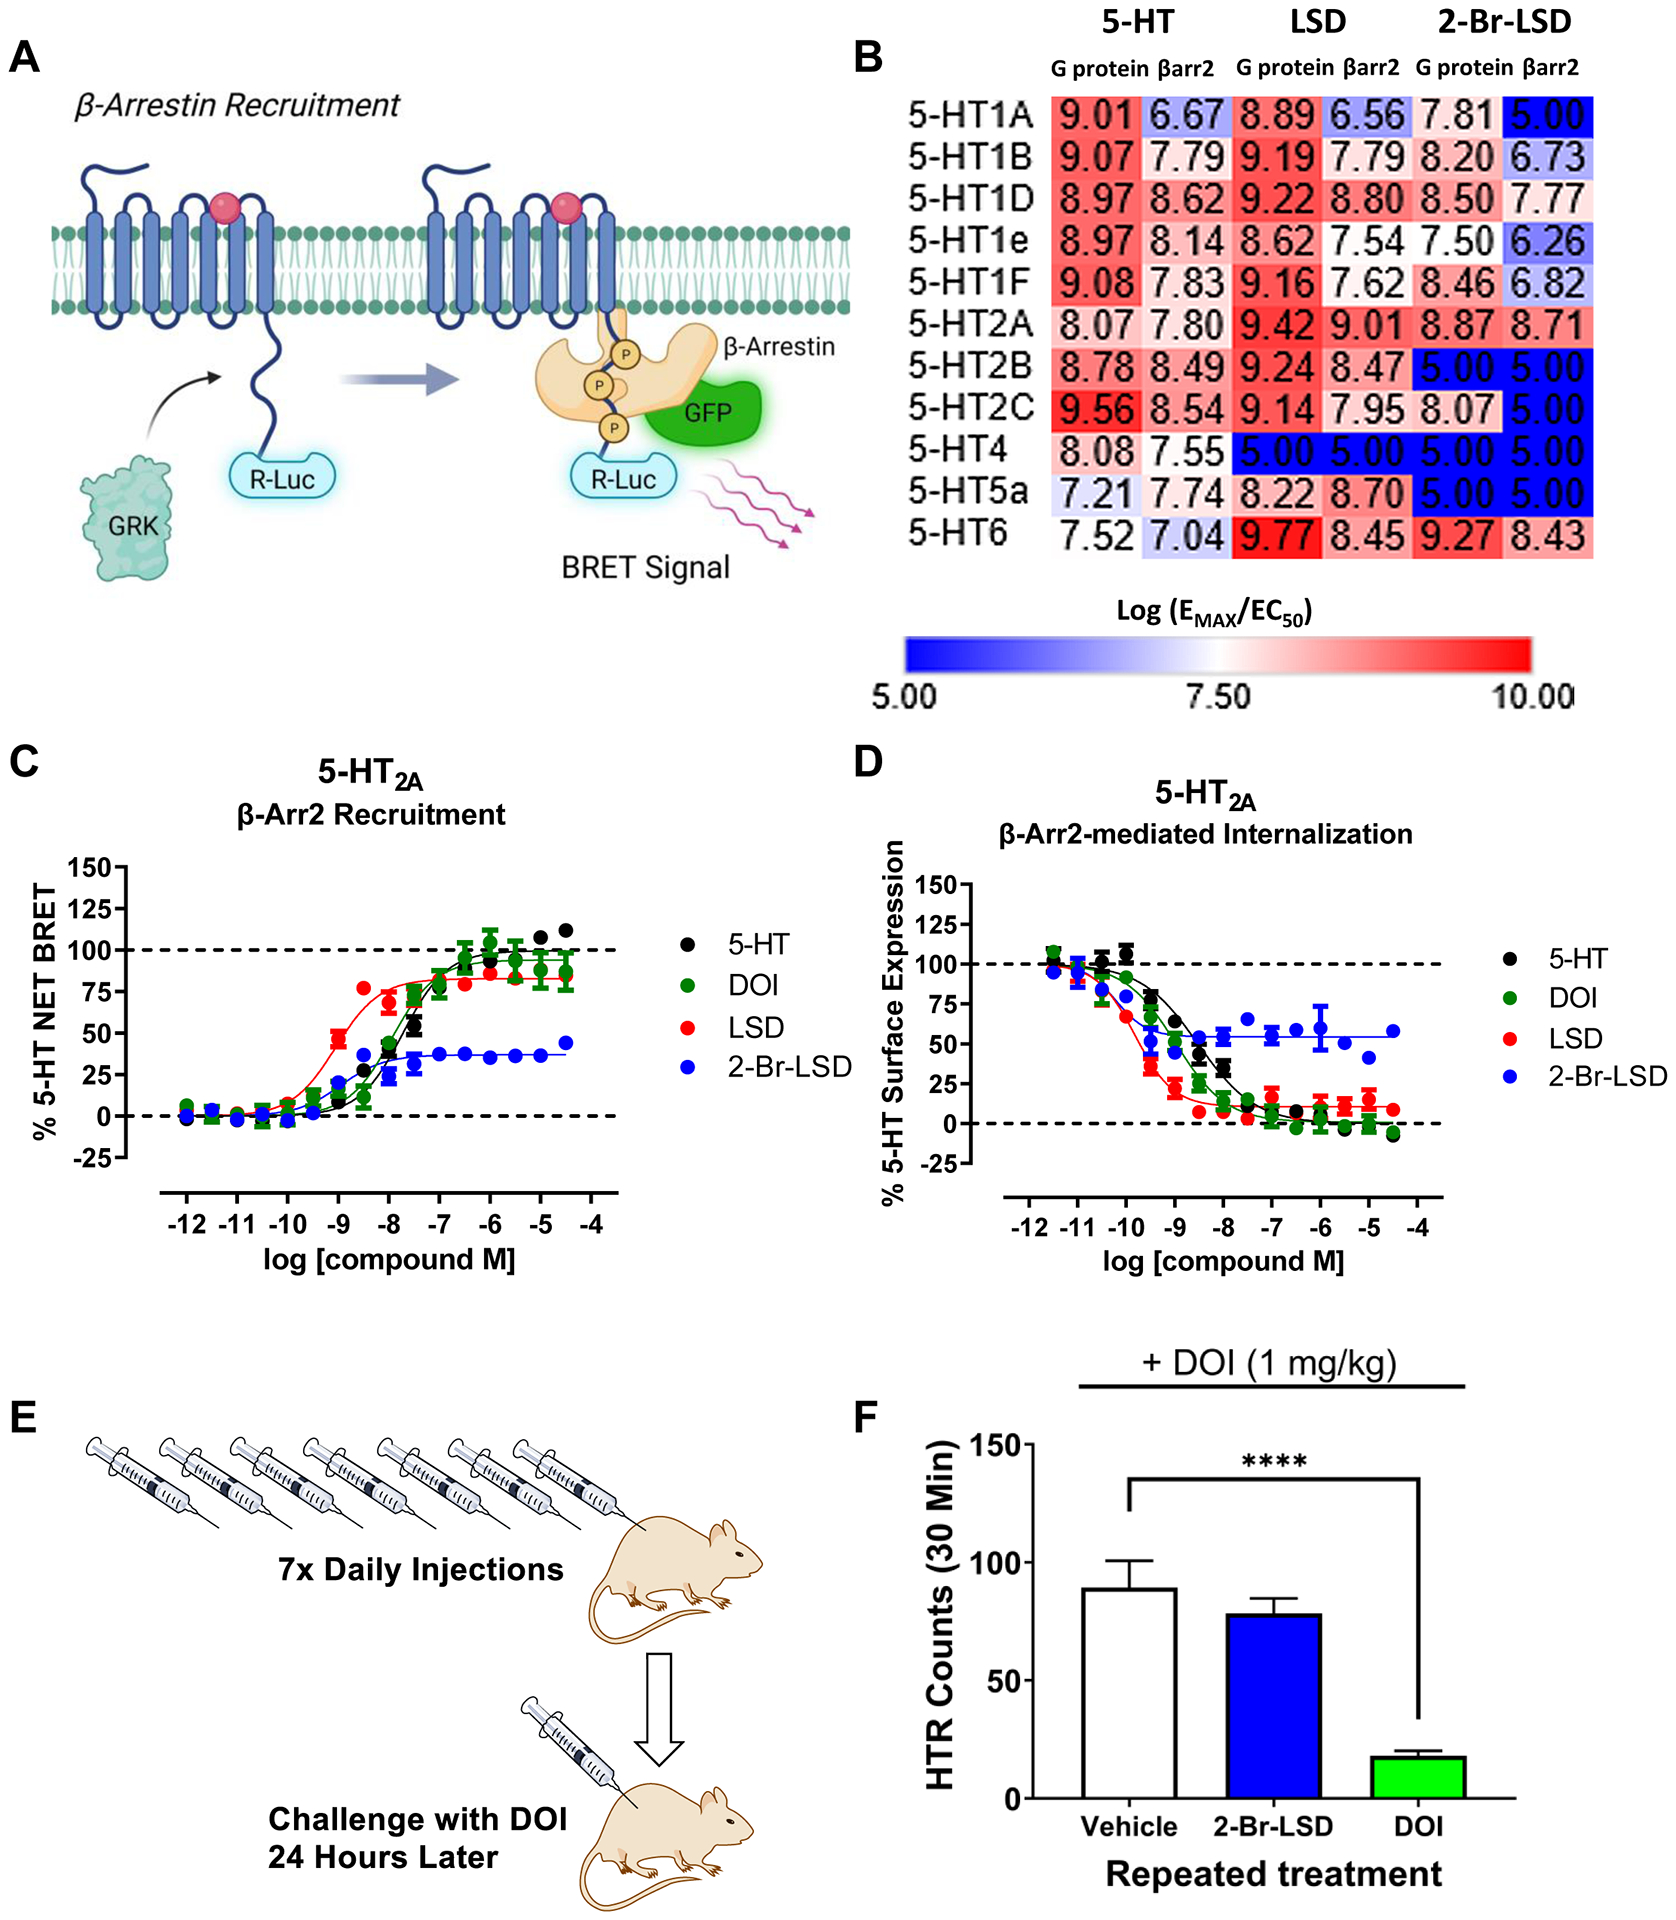
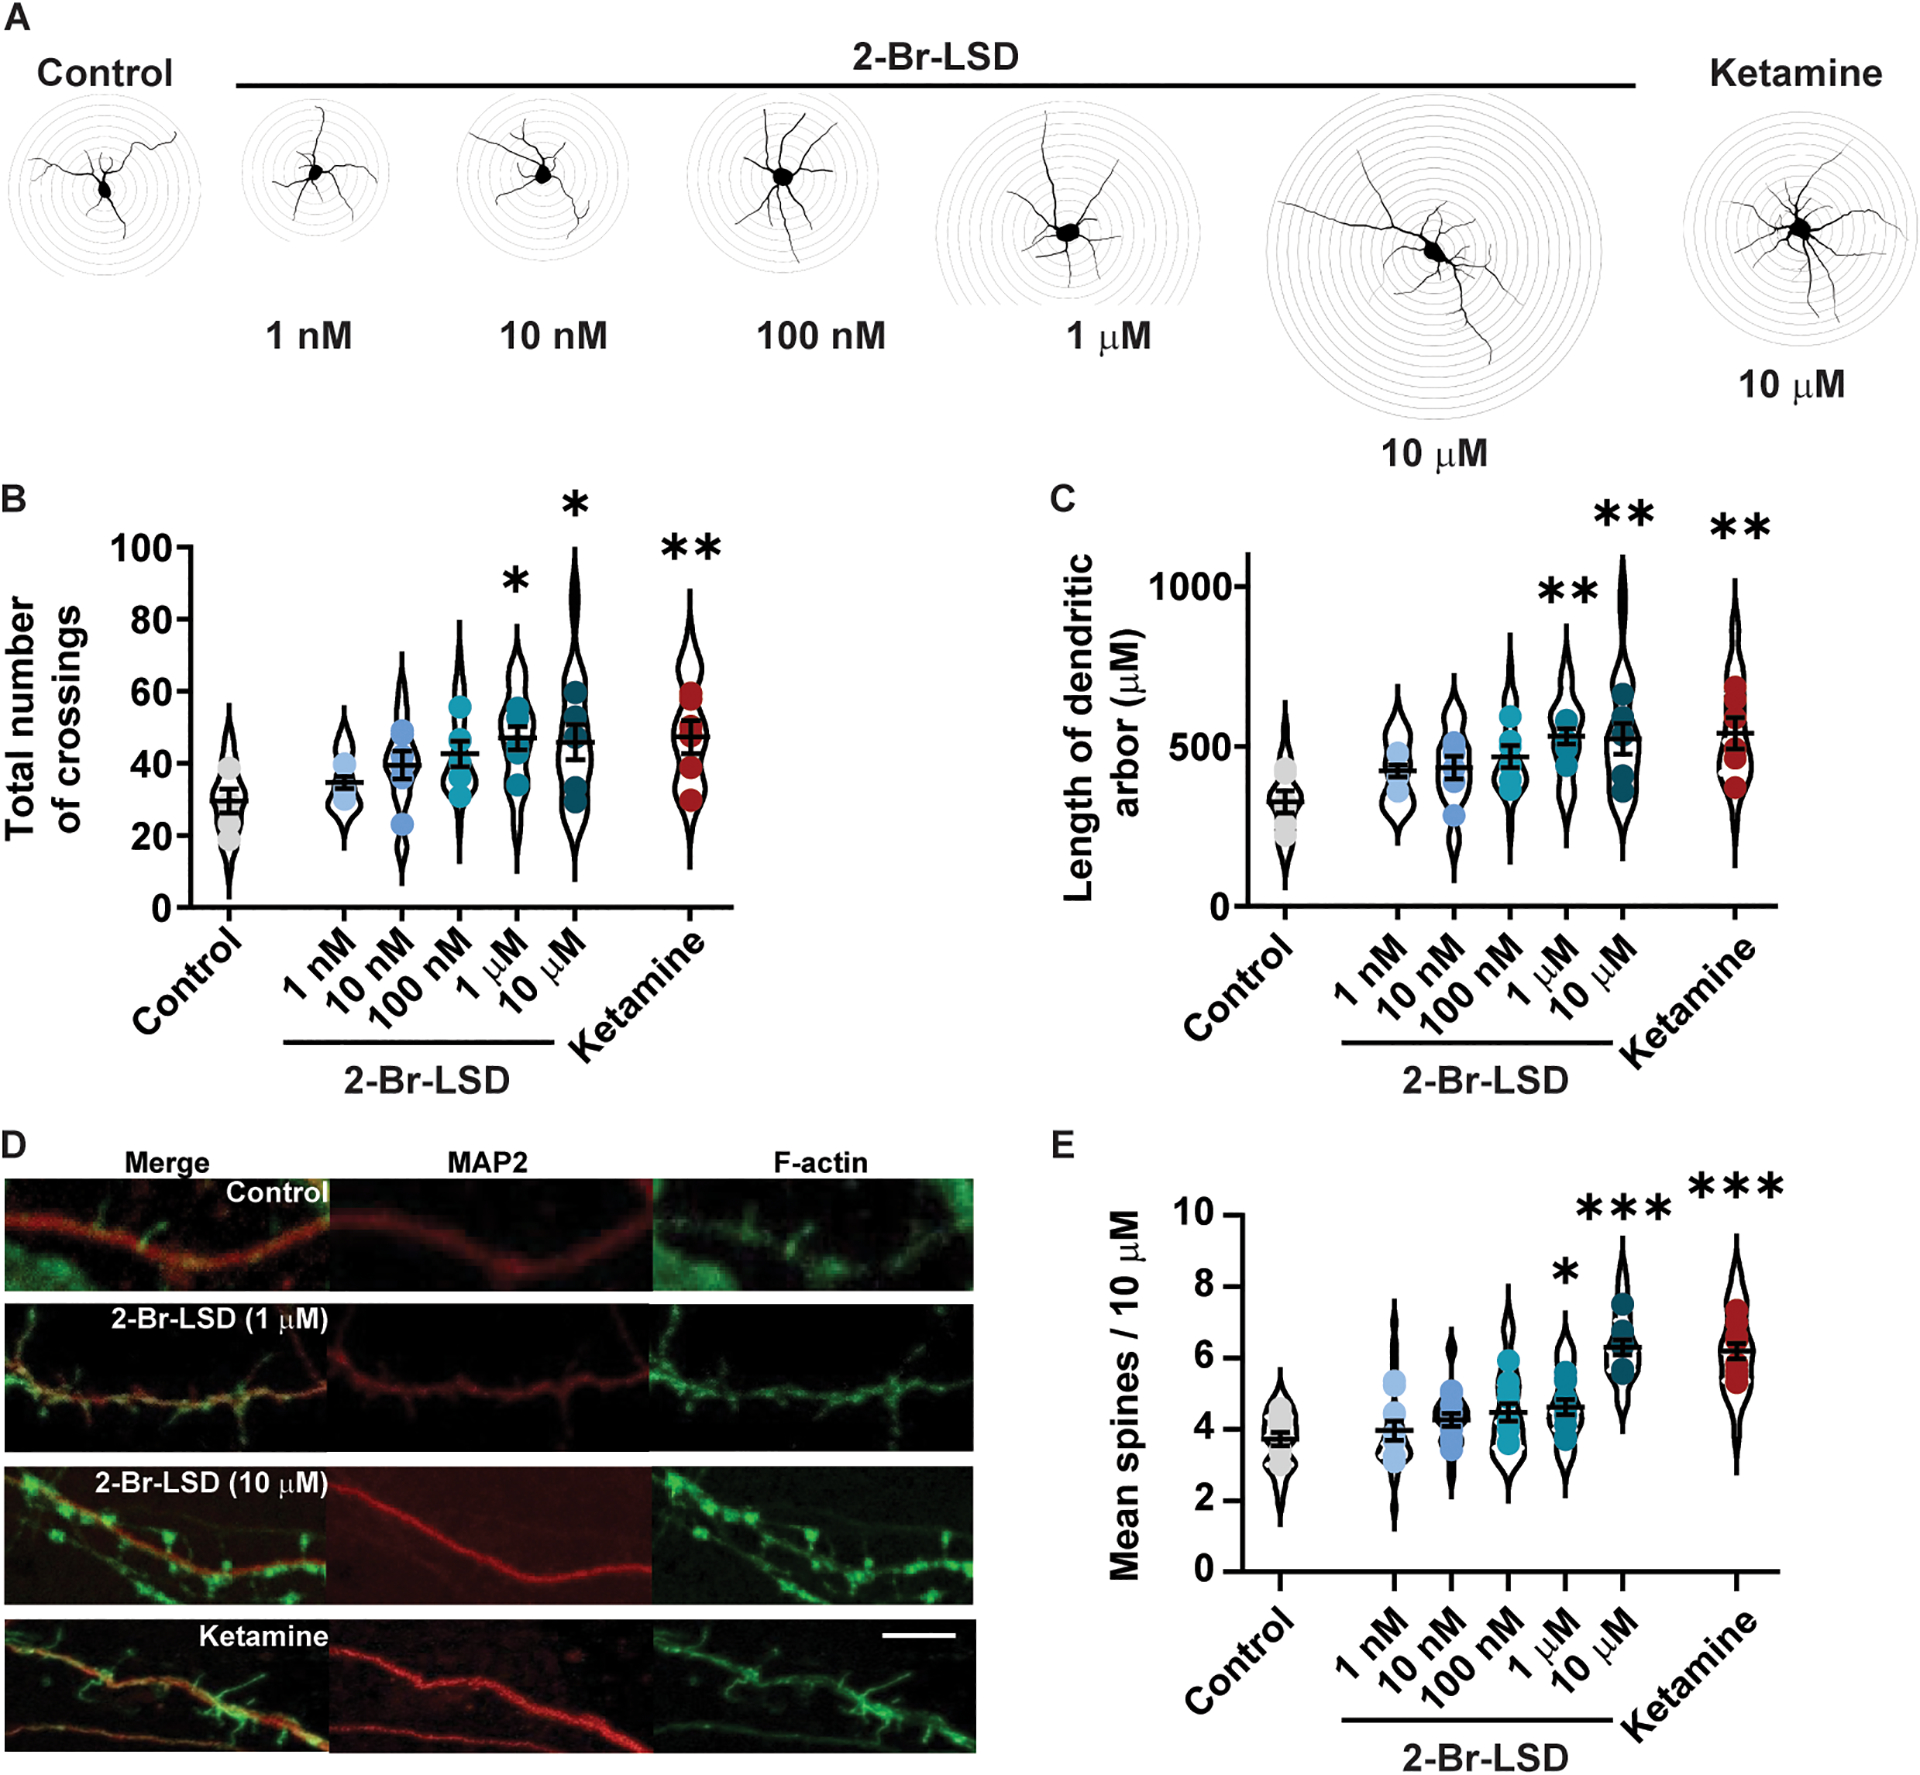
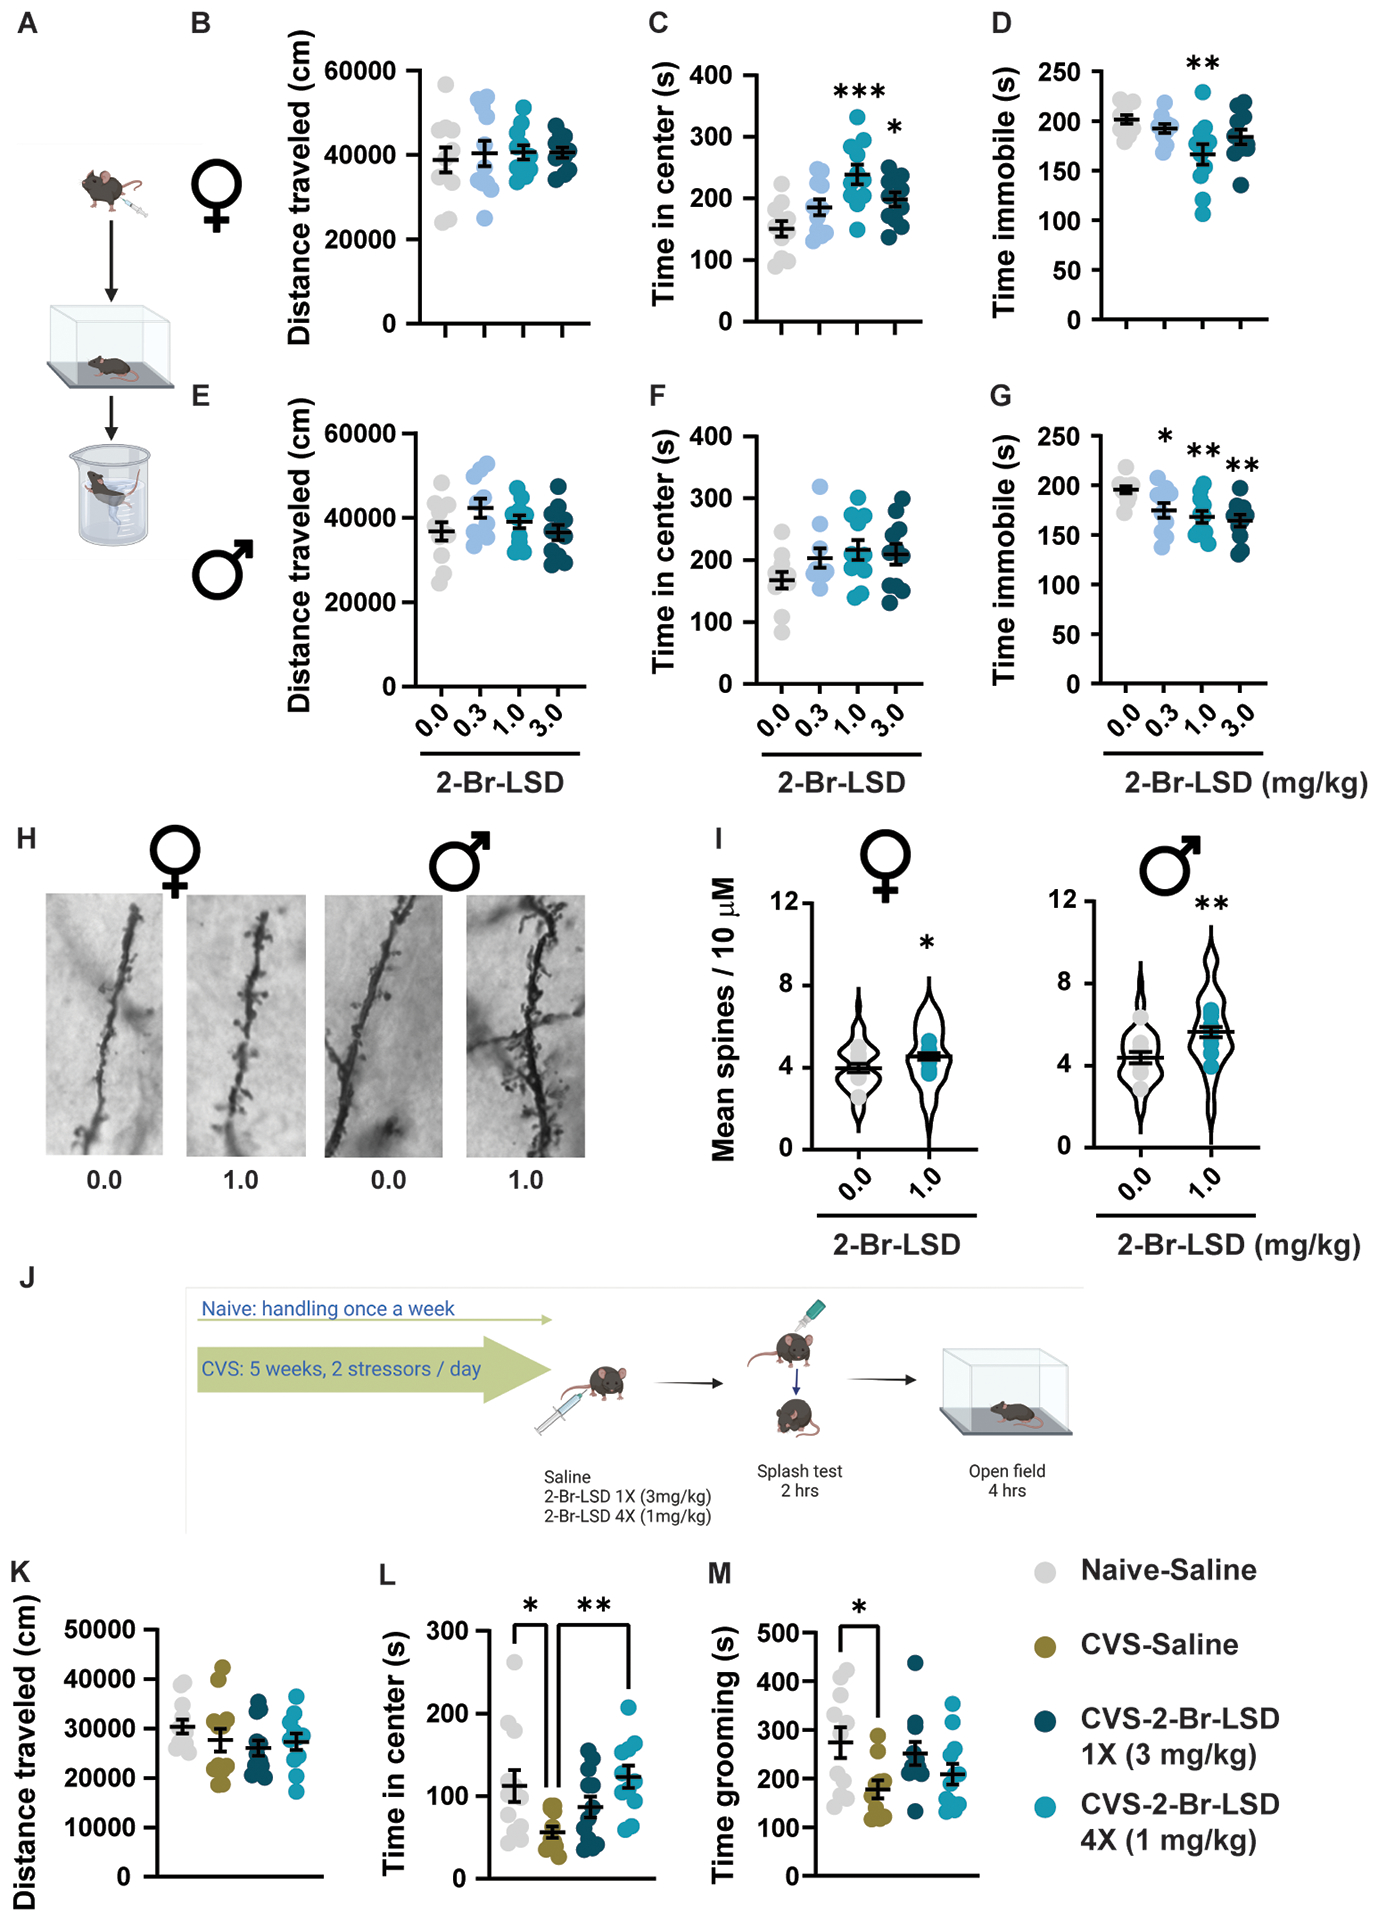
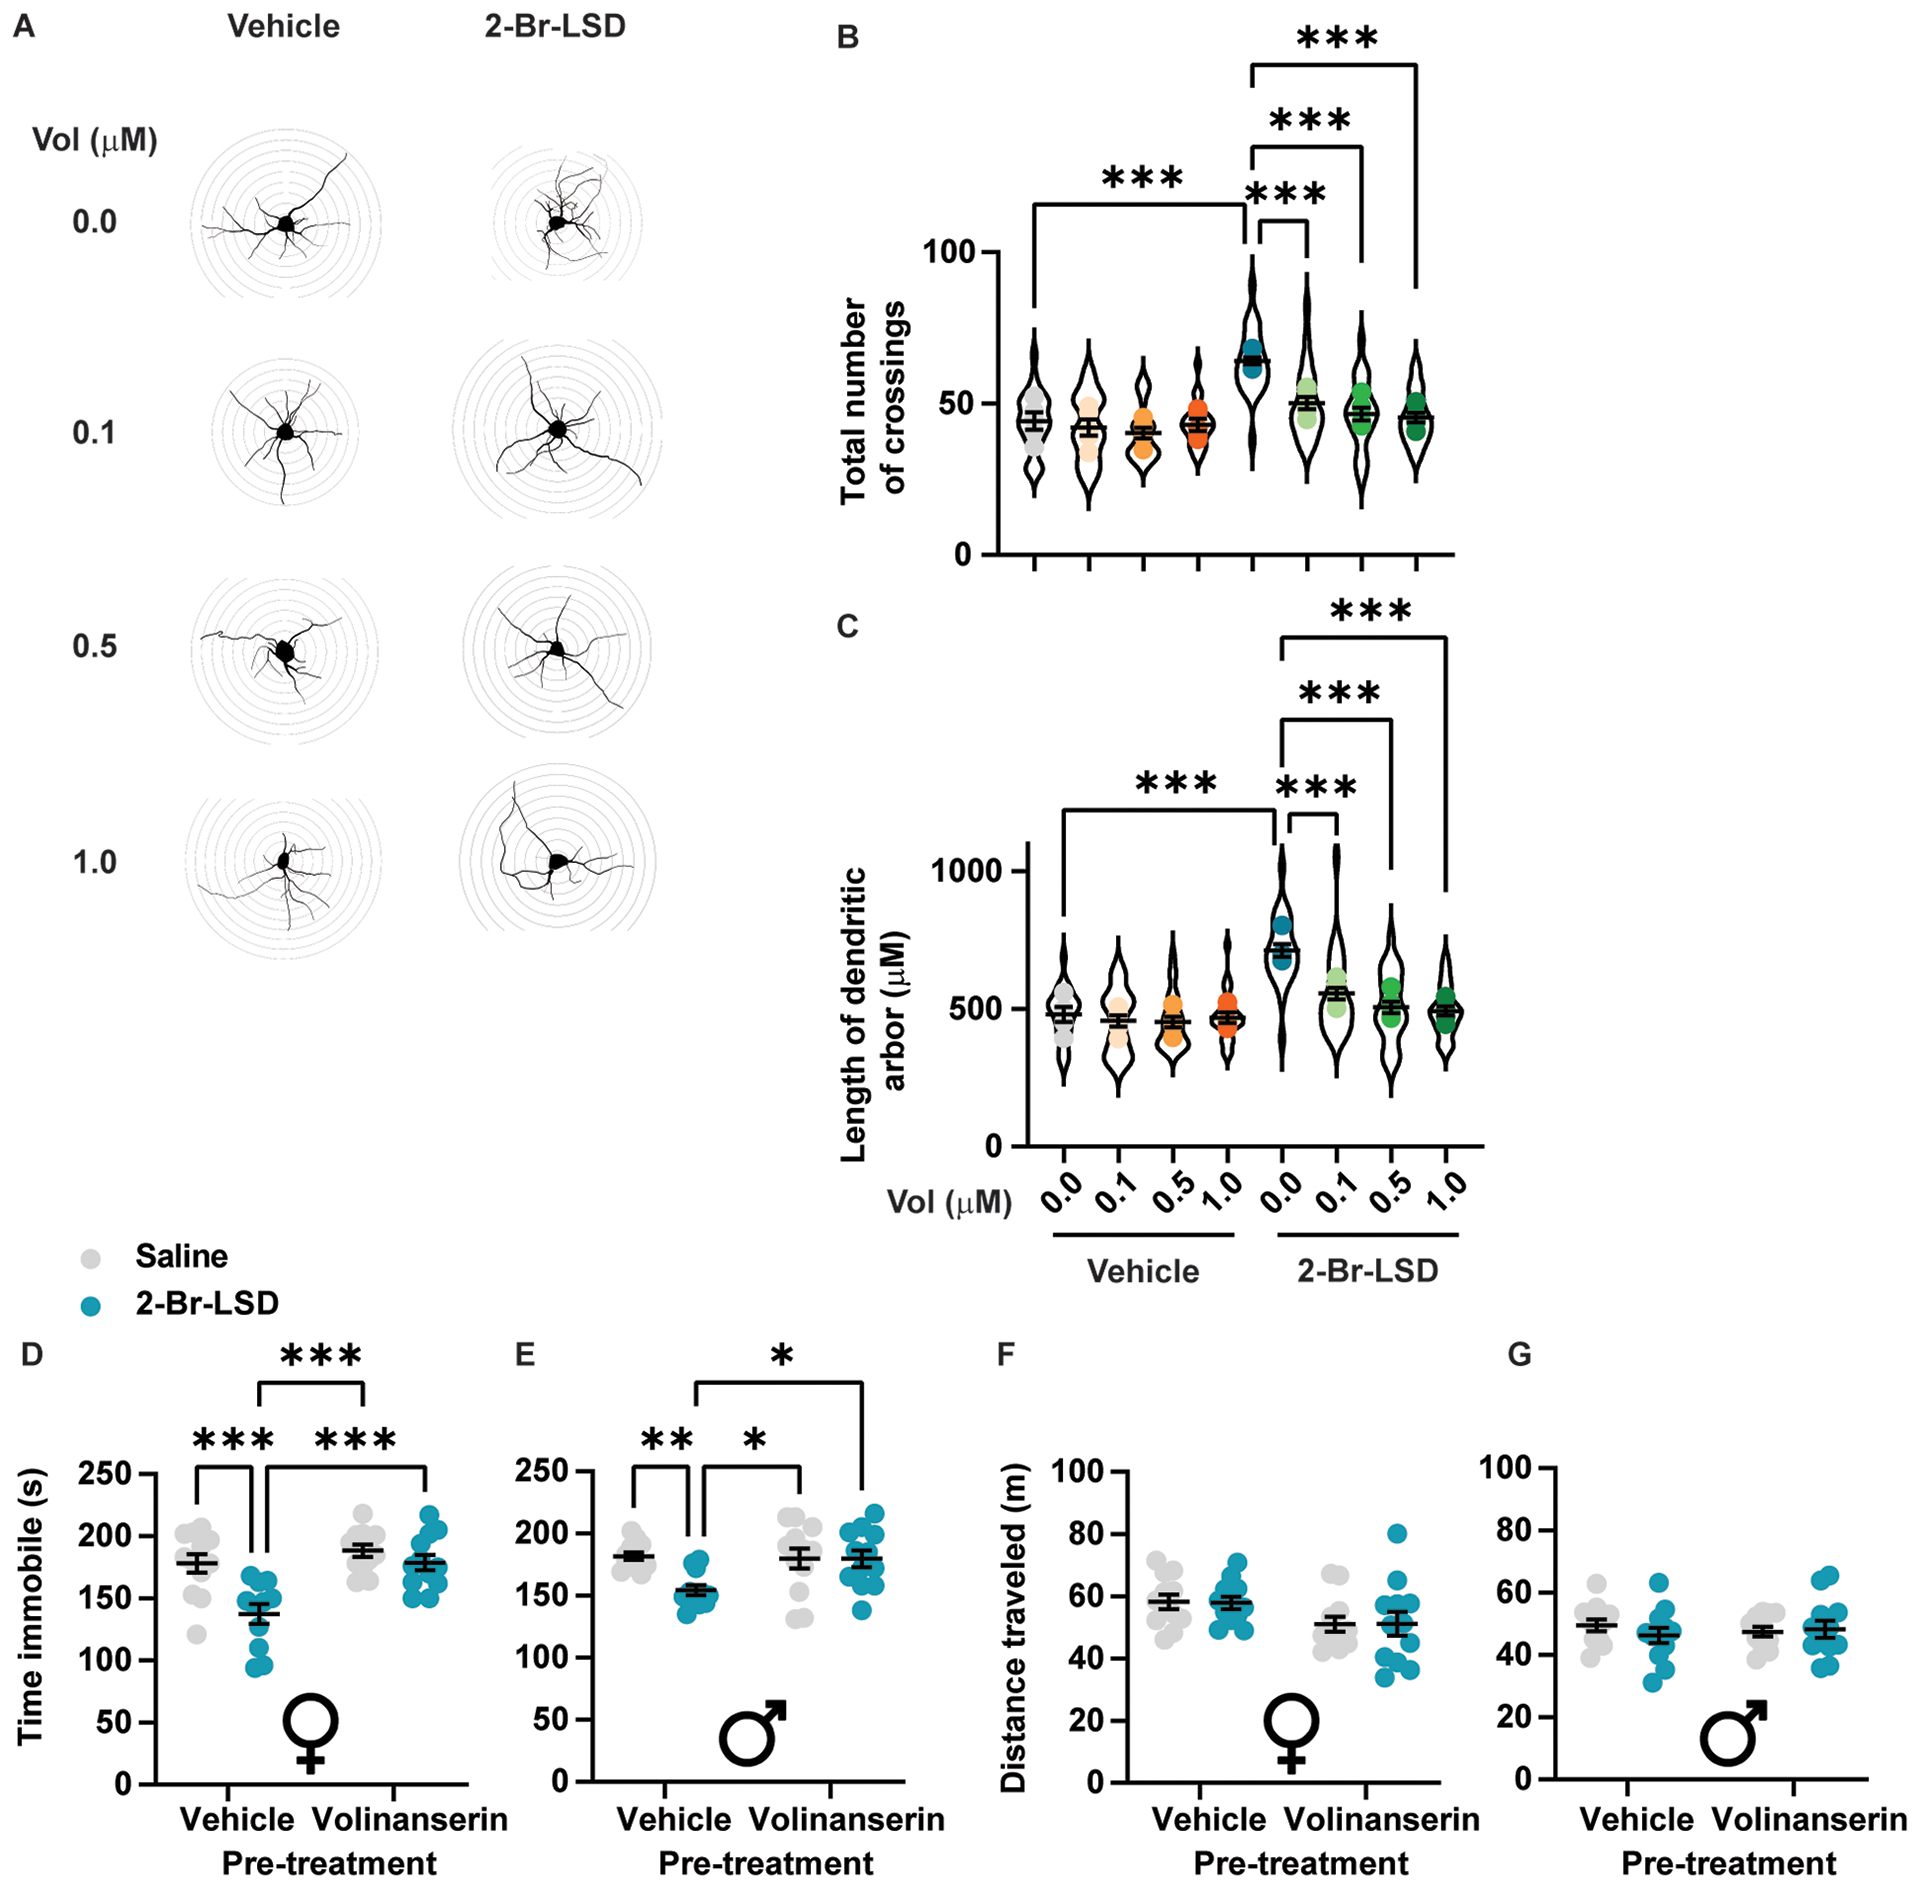
Hallucinations limit widespread therapeutic use of psychedelics as rapidly acting antidepressants. Here we profiled the non-hallucinogenic lysergic acid diethylamide (LSD) analog 2-bromo-LSD (2-Br-LSD) at more than 33 aminergic G protein-coupled receptors (GPCRs). 2-Br-LSD shows partial agonism at several aminergic GPCRs, including 5-HT2A, and does not induce the head-twitch response (HTR) in mice, supporting its classification as a non-hallucinogenic 5-HT2A partial agonist. Unlike LSD, 2-Br-LSD lacks 5-HT2B agonism, an effect linked to cardiac valvulopathy. Additionally, 2-Br-LSD produces weak 5-HT2A β-arrestin recruitment and internalization in vitro and does not induce tolerance in vivo after repeated administration. 2-Br-LSD induces dendritogenesis and spinogenesis in cultured rat cortical neurons and increases active coping behavior in mice, an effect blocked by the 5-HT2A-selective antagonist volinanserin (M100907). 2-Br-LSD also reverses the behavioral effects of chronic stress. Overall, 2-Br-LSD has an improved pharmacological profile compared with LSD and may have profound therapeutic value for mood disorders and other indications.

Keywords: 5-HT2A; 5-HT2B; CP: Molecular biology; CP: Neuroscience; G protein-coupled receptor; depression; hallucinogen; neuroplasticity; psychedelic; serotonin; stress; tolerance.


Conflict of interest statement

Declaration of interests A.G. and H.S. are employees of BetterLife Pharma Inc.

Figures

Figure 1.
Figure 1.. Profiling 2-Br-LSD across the Serotonergic and Aminergic GPCRome
(A) Chemical structures of LSD and 2-Br-LSD. (B) Aminergic-ome G protein dissociation BRET assay schematic. (C) Heat map showing relative agonist activity (log(EMAX/EC50) comparing LSD to 2-Br-LSD at 33 aminergic GPCR targets measuring G protein dissociation at 37°C and 60 minutes (see Table S1). (D) Top ten targets of 2-Br-LSD agonist activity in the BRET aminergic GPCRome activity assays comparing 2-Br-LSD (blue) to LSD (red) and positive control (black; 5-HT for serotonin receptors and DA for dopamine receptors). Data represent mean ± SEM from at least n=3 independent experiments performed in triplicate, and are all normalized to their respective positive control. Related to Fig. S1, S2 and Tables S1–S3.
Figure 2.
Figure 2.. 2-Br-LSD 5-HT2A partial agonist activity, pharmacokinetics, and effect on the head-twitch response (HTR)
2-Br-LSD partial agonist and antagonist activity at 5-HT2A measuring Gq dissociation (A) and β-arrestin2 recruitment (B) in BRET assays. Data represent mean ± SEM from at least n=3 independent experiments performed in triplicate. Antagonist activity KB was calculated using IC50, 5-HT competing concentration, and 5-HT EC50. (C) Brain concentration-time curves for 2-Br-LSD in male mice. Data are presented as group means ± SEM. 2-Br-LSD was injected at t = 0. (D) Comparison of the effect of different doses of 2-Br-LSD and LSD (0.1 mg/kg IP, n=5–6/group) on the HTR. Data are presented as group means and SEM over the entire 60-minute test session. ****p<0.0001, significant difference between groups (unpaired t-test). (E) Effect of pretreatment with 2-Br-LSD on the HTR induced by DOI. Mice were pretreated IP with vehicle or 2-Br-LSD (n=6–7/group); 10 minutes later, all mice were treated IP with 1 mg/kg DOI and then HTR activity was recorded. Data are presented as group means and SEM over the entire 30-minute test session. *p<0.01, **p<0.001, ***p<0.0001, significant difference vs. vehicle control (Dunnett’s test). (F) Time-course of the interaction between 2-Br-LSD and DOI in the HTR paradigm. Mice were pretreated IP with vehicle (n=8) or 2-Br-LSD (1 mg/kg, n=8); 10 minutes later, all mice were treated IP with 1 mg/kg DOI and then HTR activity was recorded. Data are presented as group means ± SEM during consecutive 5-minute time blocks. *p<0.05, significant difference between groups (Sidak’s test). (G) Partial antagonism of 2-Br-LSD, assessed by measuring DOI-induced 5-HT2A Gq dissociation in BRET assays. Antagonist activity KB was calculated using IC50, DOI competing concentration, and EC50. Data represent mean ± SEM from at least n=3 independent experiments performed in triplicate. Related to Fig. S3 and Table S4.
Figure 3.
Figure 3.. 2-Br-LSD has a safer cardiovascular profile compared to LSD
2-Br-LSD agonist and antagonist activity at 5-HT2B measuring Gq dissociation (A) and β-arrestin2 recruitment (B) in BRET assays, and in Gq-mediated calcium flux assays (C). Data represent mean and SEM from at least n=3 independent experiments performed in triplicate. Antagonist activity KB was calculated using, IC50, 5-HT competing concentration and EC50. (D) hERG inhibition by 2-Br-LSD (blue) indicating IC50 (half maximal inhibition) of 31.6 μM. Positive control astemizole (red) IC50 = 0.41 μM. Related to Tables S5, S6.
Figure 4.
Figure 4.. 2-Br-LSD produces weak 5-HT2A β-arrestin recruitment and has reduced potential to induce tolerance in vivo
(A) 5-HT-ome β-arrestin2 recruitment BRET assay schematic. (B) Heat map showing relative activity (log(EMAX/EC50) comparing 2-Br-LSD to LSD and 5-HT. (C) Graphs of β-arrestin2 recruitment of 2-Br-LSD (blue) to LSD (red), DOI (green) and 5-HT (black) as measured in the β-arr2 recruitment BRET assay. (D) Graphs of loss of surface expression of 2-Br-LSD (blue) to LSD (red), DOI (green) and 5-HT (black) as measured in NanoBit internalization assay. Data represent mean ± SEM from at least n=3 independent experiments performed in triplicate normalized to percent 5-HT response. (E,F) Lack of tolerance to a 5-HT2A agonist after repeated treatment with 2-Br-LSD. Mice were injected IP once per day with vehicle (n=7), 2-Br-LSD (3 mg/kg, n=7), or DOI (10 mg/kg, n=7) for 7 consecutive days and then challenged with DOI (1 mg/kg IP) 24 hours after the last injection. Data are presented as group means ± SEM over the entire 30-minute test session. ****p<0.0001, significant difference between groups (Dunnett’s test). Related to Fig. S4.
Figure 5.
Figure 5.. 2-Br-LSD treatment increases dendritic arbour complexity and spine growth in rat cortical pyramidal primary neurons.
(A) Representative Sholl tracings of primary neuronal cultures treated at day in vitro (DIV) 3 with 2-Br-LSD (1, 10, 100 nM or 1, 10 μM) or ketamine (10 μM) for 3 h. Then, dendrites were identified by MAP2 staining at DIV 6 and arbor complexity was assessed by Sholl analysis (distance between each Sholl radii is 10 μm). (B) The total number of Sholl radii crossings by MAP2 positive neurites following 2-Br-LSD or ketamine treatment to rat cortical neurons (as described in A), compared to the vehicle control. Violin plots represent the distribution of total crossings by individual neurons (n=30/treatment), and points represent the averages per independent experiment (n=6/treatment). (C) Total dendritic arbor length from neurons from A and B. (D) Representative images of dendritic spines in rat cortical neurons treated with 2-Br-LSD or ketamine (concentrations as in A) at DIV 18 (3 h). Dendrites were imaged at DIV 19 using a combination of F-Actin staining (using phalloidin; green; right panels) and anti-MAP2 antibody (red, center panels), merged image is in the right panels. Scale bar = 3 μm. (E) The total number of spines per 10 μm section of the longest apical dendrite was scored starting from the first branch point. Violin plots represent average spine density per neuron (n=15/treatment), and points represent averages by independent experiment (n=10/treatment). Horizontal lines represent the mean ± SEM. *p<0.05, **p<0.01 and ***p<0.001 Bonferroni’s test vs. control (vehicle-treated neurons). Related to Fig. S5.
Figure 6.
Figure 6.. 2-Br-LSD promotes exploration, active coping and spinogenesis in mice.
(A) Female and male mice (n=10–11/group/sex) were treated with 2-Br-LSD (0.3, 1 or 3 mg/kg IP) or vehicle. 24 hrs after injection, mice were tested in the open field and, one hour later, in the forced swim test. (B) and (E) Total distance travelled in the open field, 24 hrs after vehicle or 2-Br-LSD treatment in female and male mice, respectively. (C) and (F) Time in the center of the open field by female and male mice. (D) and (G) Time immobile during the last four minutes in the forced swim test in female and male mice. (H) Representative light microscopy images of dendritic segments of pyramidal neurons of the prefrontal cortex stained using Golgi-Cox. Male and female mice were treated with vehicle or 2-Br-LSD (1 mg/kg IP). (I) Mean spine density per 10 μm dendrite segments in female (left panel) and male (right panel) mice treated with vehicle or 2-Br-LSD. The violin plots represent the distribution of spine density averages per neuron (Four 10-μm segments per neuron, 5–6 neurons per mouse, 55–60 neurons/treatment/sex). Dots represent the average spine density per mouse (n=10–11 mice/treatment/sex). (J) Female mice were subjected to 5 weeks of chronic variable stress (CSV), consisting of 2 different stressors per day presented randomly. At day 28, after the beginning of the stress, mice were injected IP with vehicle or 2-Br-LSD every 48 h until day 34, so 3 groups were generated: CVS-Saline (4X saline injections), CVS-2-Br-LSD 1X (3 mg/kg) (3 saline injections and one dose of 2-Br-LSD) and CVS-2-Br-LSD 4X (1 mg/kg) (4 doses of 2-Br-LSD). A group of female mice were single-housed and left without manipulation, except for 4 saline injections on the same days as the other groups (Naïve-Saline). Mice were then tested in the splash test and the open field, 2 and 4 h after the last injection). (K) Distance travelled in the open field by female mice treated as described in J (n=12/group). (L) Time spent in the center of the open field of mice in K. (M) Time spent self-grooming in the splash test by female mice treated as in J (n=10–12/group). Horizontal lines represent the mean ± SEM. *p<0.05, **p<0.01 and ***p<0.001 Bonferroni’s test vs. control or vs. CVS-Saline mice. Related to Fig. S5 and S6.
Figure 7.
Figure 7.. 2-Br-LSD mechanism of action involves 5-HT2A receptor activation.
(A) Representative tracings of primary rat cortical neurons (DIV 3) treated with the selective 5-HT2A antagonist volinanserin (Vol) at 0.1, 0.5 or 1 μM, followed by either vehicle or 2-Br-LSD (1 μM). Sholl radii are spaced 10 μm. (B) Total number of Sholl crossings for neurons treated as in A. (C) Total dendritic arbour length for neurons treated as in A. For both B and C, violin plot represents the distribution of individual cells (n=15/treatment), while dots represent the averages per independent experiment (n=5/treatment). (D) Female mice were pretreated with vehicle or Vol (0.125 mg/kg), followed by either vehicle or 2-Br-LSD (1 mg/kg). Immobility in the FST was measured 25 h after the second injection (n=11–12/group). (E) Male mice were treated as in D and measured for immobility in the FST (n=12/group). (F) Distance travelled in the open field was measured 24 h after treatments in D for female mice. (G) Distance travelled in the open field was measured 24 h after treatments in D for male mice (n=12). Horizontal lines represent the mean ± SEM. *p<0.05, **p<0.01 and ***p<0.001 Bonferroni’s test vs. the indicated group. Related to Fig. S6.

References

    1. Kessler RC, Sampson NA, Berglund P, Gruber MJ, Al-Hamzawi A, Andrade L, Bunting B, Demyttenaere K, Florescu S, de Girolamo G, et al. (2015). Anxious and non-anxious major depressive disorder in the World Health Organization World Mental Health Surveys. Epidemiol Psychiatr Sci 24, 210–226. 10.1017/S2045796015000189. - DOI - PMC - PubMed
    1. Kalin NH (2020). The Critical Relationship Between Anxiety and Depression. Am J Psychiatry 177, 365–367. 10.1176/appi.ajp.2020.20030305. - DOI - PubMed
    1. Lader M (2007). Limitations of current medical treatments for depression: disturbed circadian rhythms as a possible therapeutic target. Eur Neuropsychopharmacol 17, 743–755. 10.1016/j.euroneuro.2007.05.004. - DOI - PubMed
    1. Frodl T (2017). Recent advances in predicting responses to antidepressant treatment. F1000Res 6. 10.12688/f1000research.10300.1. - DOI - PMC - PubMed
    1. Hibicke M, Landry AN, Kramer HM, Talman ZK, and Nichols CD (2020). Psychedelics, but Not Ketamine, Produce Persistent Antidepressant-like Effects in a Rodent Experimental System for the Study of Depression. ACS Chem Neurosci 11, 864–871. 10.1021/acschemneuro.9b00493. - DOI - PubMed

Publication types