. 2023 Apr;37(4):e22845.
doi: 10.1096/fj.202201344R.

CDK6 activity in a recurring convergent kinase network motif

Affiliations

CDK6 activity in a recurring convergent kinase network motif

Christina G Gangemi et al. FASEB J. 2023 Apr.

Abstract

In humans, more than 500 kinases phosphorylate ~15% of all proteins in an emerging phosphorylation network. Convergent local interaction motifs, in which ≥two kinases phosphorylate the same substrate, underlie feedback loops and signal amplification events but have not been systematically analyzed. Here, we first report a network-wide computational analysis of convergent kinase-substrate relationships (cKSRs). In experimentally validated phosphorylation sites, we find that cKSRs are common and involve >80% of all human kinases and >24% of all substrates. We show that cKSRs occur over a wide range of stoichiometries, in many instances harnessing co-expressed kinases from family subgroups. We then experimentally demonstrate for the prototypical convergent CDK4/6 kinase pair how multiple inputs phosphorylate the tumor suppressor retinoblastoma protein (RB) and thereby hamper in situ analysis of the individual kinases. We hypothesize that overexpression of one kinase combined with a CDK4/6 inhibitor can dissect convergence. In breast cancer cells expressing high levels of CDK4, we confirm this hypothesis and develop a high-throughput compatible assay that quantifies genetically modified CDK6 variants and inhibitors. Collectively, our work reveals the occurrence, topology, and experimental dissection of convergent interactions toward a deeper understanding of kinase networks and functions.

Keywords: convergence; inhibitor; kinase; protein engineering; signaling network.


Figures

FIGURE 1
FIGURE 1
Substrate‐centric analysis of convergent motifs for Ser/Thr and Tyr phosphorylation events. (A) cKSRs are defined as kinase‐substrate interactions in which ≥two kinases phosphorylate a common substrate (general cKSRs) or a common site on a substrate (site‐specific cKSRs). These interactions are involved in, for example, amplification events, pathway crosstalk, and feedback loops. (B, C) Distribution histograms of general cKSRs for Ser/Thr phosphorylation (B) and Tyr phosphorylation (C). Bars indicate how many substrates are phosphorylated by the indicated number of kinases. Pie charts indicate the percentage of substrates that are phosphorylated by ≥two kinases and the total number of analyzed substrates (s). (D, E) Distribution histograms of site‐specific cKSRs for Ser/Thr phosphorylation (D) and Tyr phosphorylation (E). Bars indicate how many sites are phosphorylated by the indicated number of kinases. Pie charts indicated the percentage of sites that are phosphorylated by ≥two kinases and the total number of analyzed sites (s).
FIGURE 2
FIGURE 2
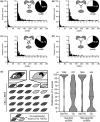
Kinase‐centric analysis of convergent motifs for Ser/Thr and Tyr phosphorylation events. (A, B) Distribution histograms for Ser/Thr kinases (B) and Tyr kinases (C) in general cKSRs. Bars indicate how many kinases phosphorylate the indicated number of substrates. Pie charts indicate the percentage of kinases that participate in general cKSRs and the total number of kinases (k). (C, D) Distribution histograms for Ser/Thr kinases (B) and Tyr kinases (C) in site‐specific cKSRs. Bars indicate how many kinases phosphorylate the indicated number of sites. Pie charts indicate the percentage of kinases that participate in site‐specific cKSRs and the total number of kinases (k). (E) Co‐expression analysis of converging kinases in cancer cell lines. For each group of kinases that phosphorylate the same substrate or site, the number of 1393 cancer cell lines that co‐express these kinases was counted. From this, a co‐expression score was calculated as the ratio of cells with (dark gray) and without (light gray) co‐expression. Violin plots summarize the distribution of these scores for the analyzed number of substrates or sites (s) (dashed line: median; TPM threshold: 10).
FIGURE 3
FIGURE 3
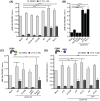
Overexpression of CDK6 and variants does not increase pRB levels. (A) Immunoblot analysis of pRB in MCF‐7 cells expressing CDK6 and its variants. (B) Densitometry analysis of data shown in (A) expressed as a ratio of pRB to total RB. (C) Immunoblot analysis of pRB in MCF‐7 cells expressing CDK6 and its variants when co‐transfected with Cyclin D3. (D) Densitometry analysis of data shown (C) expressed as a ratio of pRB to total RB. (A and C) Representative experiments are shown. (B and D) n = 3. Data are mean ± SEM. One‐way ANOVA test with Dunnett's method correction compared with mock‐transfected control: No significance was detected.
FIGURE 4
FIGURE 4
Kinase inhibition with LY reveals CDK6 activity. (A) Immunoblot analysis of pRB in MCF‐7 cells expressing CDK6 and its variants when co‐transfected with Cyclin D3 and treated with LY or DMSO. (B) Densitometry analysis of data shown in (A) expressed as a ratio of pRB to total RB. (C) Immunoblot analysis of pRB in MCF‐7 cells expressing CDK6 and Cyclin D3, treated with increasing concentrations of LY. (D) Densitometry analysis of data shown in (C) expressed as a ratio of pRB to total RB. (A and C) Representative experiments are shown. (B and D) One‐way ANOVA test with Dunnett's method correction compared with mock‐transfected LY‐treated control. (B) n = 4 and (D) n = 3. Data are mean ± SEM. ***p ≤ .001, ****p ≤ .0001.
FIGURE 5
FIGURE 5
Energy transfer‐based assay of CDK6 variants and modulators. (A) Ratios of pRB to total RB for MCF‐7 cells expressing CDK6 and its variants co‐transfected with Cyclin D3. (B) LY‐treated conditions from (A) normalized to mock LY‐treated control. (C) Ratios for cells expressing CDK6 containing pdDronpa1 insertions within an internal loop (loop pdD1) or at the N‐terminus (N‐term pdD1). (D) Ratios for cells expressing p18INK4c (p18) in combination with CDK6 or R31C variant and Cyclin D3. (A–D) One‐way ANOVA test with Dunnett's method correction compared with mock‐transfected LY‐treated control. n = 3. Data are mean ± SEM. *p ≤ .05, **p ≤ .01, ***p ≤ .001, ****p ≤ .0001.

References

    1. Aebersold R, Mann M. Mass‐spectrometric exploration of proteome structure and function. Nature. 2016;537:347‐355. - PubMed
    1. Riley NM, Coon JJ. Phosphoproteomics in the age of rapid and deep proteome profiling. Anal Chem. 2016;88:74‐94. - PMC - PubMed
    1. Lemeer S, Heck AJ. The phosphoproteomics data explosion. Curr Opin Chem Biol. 2009;13:414‐420. - PubMed
    1. Hornbeck PV, Zhang B, Murray B, Kornhauser JM, Latham V, Skrzypek E. PhosphoSitePlus, 2014: mutations, PTMs and recalibrations. Nucleic Acids Res. 2015;43:D512‐D520. - PMC - PubMed
    1. Colinge J, César‐Razquin A, Huber K, Breitwieser FP, Májek P, Superti‐Furga G. Building and exploring an integrated human kinase network: global organization and medical entry points. J Proteomics. 2014;107:113‐127. - PMC - PubMed

Publication types

MeSH terms

LinkOut - more resources