

Forest growth responds more to air pollution than soil acidification
- PMID: 36888624
- PMCID: PMC9994739
- DOI: 10.1371/journal.pone.0256976
Forest growth responds more to air pollution than soil acidification
Abstract
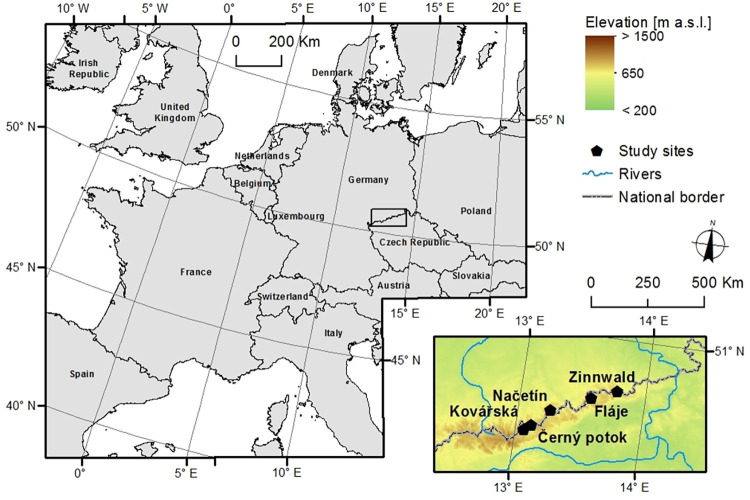
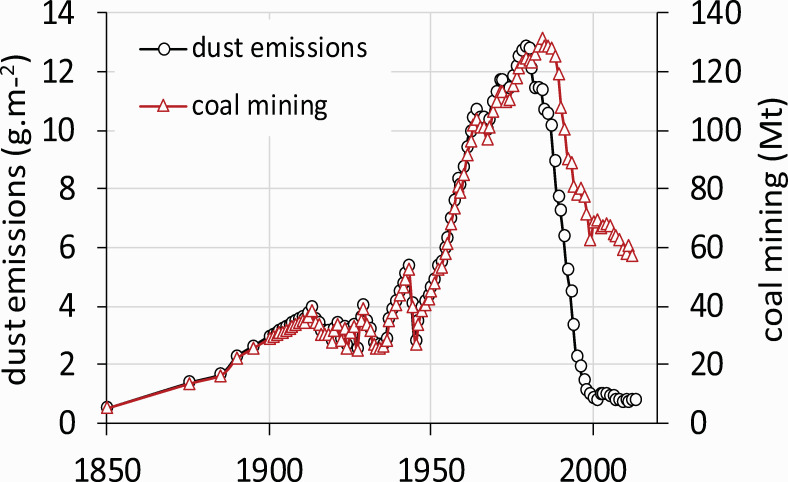
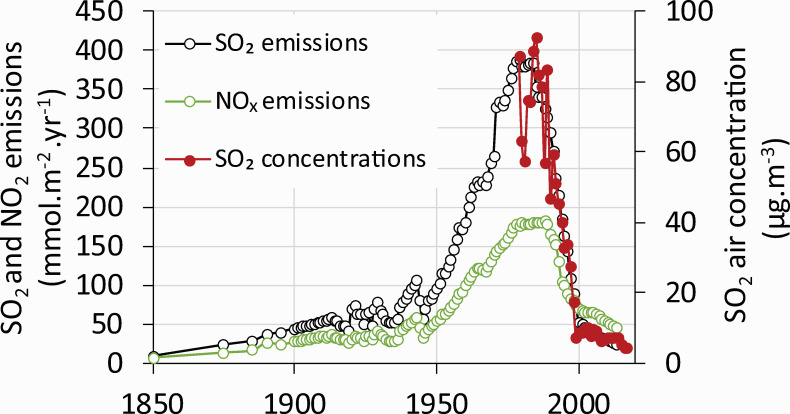
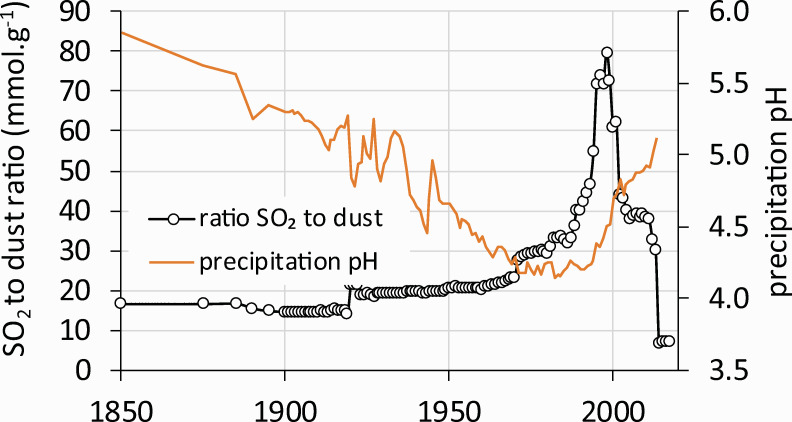
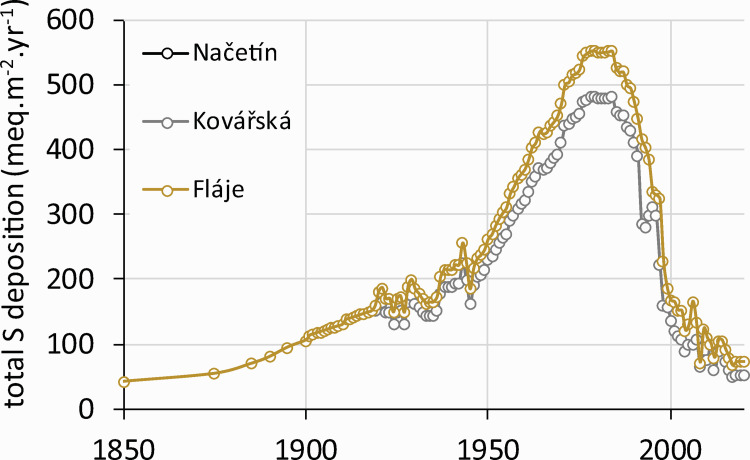
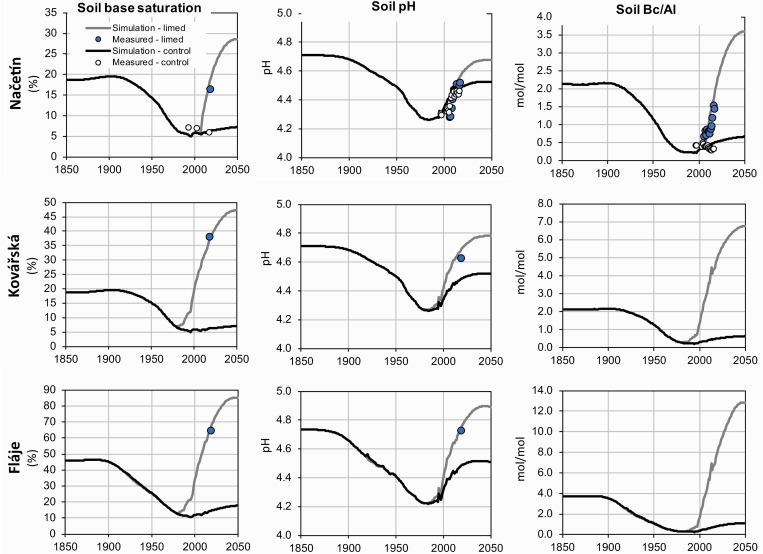
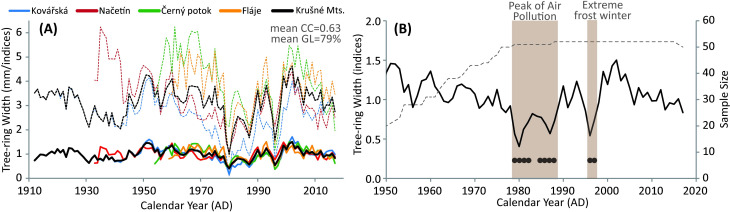
The forests of central Europe have undergone remarkable transitions in the past 40 years as air quality has improved dramatically. Retrospective analysis of Norway spruce (Picea abies) tree rings in the Czech Republic shows that air pollution (e.g. SO2 concentrations, high acidic deposition to the forest canopy) plays a dominant role in driving forest health. Extensive soil acidification occurred in the highly polluted "Black Triangle" in Central Europe, and upper mineral soils are still acidified. In contrast, acidic atmospheric deposition declined by 80% and atmospheric SO2 concentration by 90% between the late 1980s and 2010s. In this study we oserved that annual tree ring width (TRW) declined in the 1970s and subsequently recovered in the 1990s, tracking SO2 concentrations closely. Furthermore, recovery of TRW was similar in unlimed and limed stands. Despite large increases in soil base saturation, as well as soil pH, as a result of repeated liming starting in 1981, TRW growth was similar in limed and unlimed plots. TRW recovery was interrupted in 1996 when highly acidic rime (originating from more pronounced decline of alkaline dust than SO2 from local power plants) injured the spruce canopy, but recovered soon to the pre-episode growth. Across the long-term site history, changes in soil chemistry (pH, base saturation, Bc/Al soil solution ratio) cannot explain observed changes in TRW at the two study sites where we tracked soil chemistry. Instead, statistically significant recovery in TRW is linked to the trajectory of annual SO2 concentrations or sulfur deposition at all three stands.
Copyright: © 2023 Hruška et al. This is an open access article distributed under the terms of the Creative Commons Attribution License, which permits unrestricted use, distribution, and reproduction in any medium, provided the original author and source are credited.
Conflict of interest statement
The authors have declared that no competing interests exist.
Figures
References
-
- Moldan B, Schnoor JL. Czechoslovakia: examining a critically ill environment. Environ. Sci. Technol. 1992; 26(1): 14–21. doi: 10.1021/es00025a001 - DOI
-
- Hůnová I. Ambient Air Quality in the Czech Republic: Past and Present. Atmosphere. 2020; 11(2): 214. doi: 10.3390/atmos11020214 - DOI
-
- Kubíková J. Forest dieback in Czechoslovakia. Vegetatio. 1991; 93: 101–108.
-
- Sullivan TJ, Driscoll CT, Beier CM, Burtraw D, Fernandez IJ, Galloway JN, et al.. Air pollution success stories in the United States: the value of long-term observations. Environ Sci Policy. 2018; 84: 69–73. doi: 10.1016/j.envsci.2018.02.016 - DOI
Publication types
MeSH terms
Substances
LinkOut - more resources
Full Text Sources
Medical
Miscellaneous
