. 2023 Mar 8;19(3):e1011192.
doi: 10.1371/journal.ppat.1011192. eCollection 2023 Mar.

Tirap controls Mycobacterium tuberculosis phagosomal acidification

Affiliations

Tirap controls Mycobacterium tuberculosis phagosomal acidification

Imène Belhaouane et al. PLoS Pathog. .

Abstract

Progression of tuberculosis is tightly linked to a disordered immune balance, resulting in inability of the host to restrict intracellular bacterial replication and its subsequent dissemination. The immune response is mainly characterized by an orchestrated recruitment of inflammatory cells secreting cytokines. This response results from the activation of innate immunity receptors that trigger downstream intracellular signaling pathways involving adaptor proteins such as the TIR-containing adaptor protein (Tirap). In humans, resistance to tuberculosis is associated with a loss-of-function in Tirap. Here, we explore how genetic deficiency in Tirap impacts resistance to Mycobacterium tuberculosis (Mtb) infection in a mouse model and ex vivo. Interestingly, compared to wild type littermates, Tirap heterozygous mice were more resistant to Mtb infection. Upon investigation at the cellular level, we observed that mycobacteria were not able to replicate in Tirap-deficient macrophages compared to wild type counterparts. We next showed that Mtb infection induced Tirap expression which prevented phagosomal acidification and rupture. We further demonstrate that the Tirap-mediated anti-tuberculosis effect occurs through a Cish-dependent signaling pathway. Our findings provide new molecular evidence about how Mtb manipulates innate immune signaling to enable intracellular replication and survival of the pathogen, thus paving the way for host-directed approaches to treat tuberculosis.


Conflict of interest statement

The authors have declared that no competing interests exist.

Figures
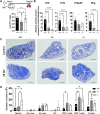
Fig 1
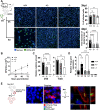
Fig 1. Comparative study of bacterial load, recruited immune cells and cytokine expression in lungs of infected Tirap +/+, +/- and -/- mice.
C57BL/6 WT (+/+), Tirap+/- (+/-) and Tirap-/- (-/-) mice were intranasally infected with Mtb H37Rv (105 CFU/20μL). 28 days post-infection, mice were sacrificed to study their pathological state. (A) Mycobacterial load was determined by plating lung lysates and counting Colony-Forming Units (CFU) 2 weeks after plating. Shown are mean ± SEM of at least 9 infected mice per condition of three independent experiments. (B) Histograms showing relative cytokine amounts in lung lysates of infected +/+, +/- and -/- mice compared to mock-infected mice. Shown are mean ± SEM of 7 infected mice per condition of one representative out of two independent experiments. (C) Toluidine blue staining of non-infected (control) and infected (28 days post-infection) slice lungs (5 μm) from WT, Tirap+/- and Tirap-/- mice. Bar: 10 mm. (D) Histogram depicting changes of immune cells populations during Mtb H37Rv infection, as determined by flow cytometry using specific cell surface markers. Cell numbers were normalized to the total cell number analyzed in the whole lung. Shown are mean ± SEM of cells obtained from three individual mice per group representative of two independent experiments. dpi: days post-infection, ns: non-significant, * P value < 0.05, ** P value < 0.01, as determined by one-way ANOVA test.
Fig 2
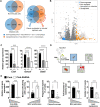
Fig 2. Tirap expression and localization in Mtb-infected BMDMs: Impact on bacterial growth and cytokine expression.
(A) BMDMs were grown in 384-well plates, infected with Mtb H37Rv-GFP (MOI of 2) and analyzed by automated confocal microscopy. Shown are representative images of Tirap+/+, Tirap+/- and Tirap-/- BMDMs at 3 hpi (upper panel) and 4 dpi (lower panel). Segmentation algorithms were applied to input images to detect nuclei labeled by Hoechst 33342 (cyan) and the GFP signal of Mtb H37Rv (green) to determine infection rate 3 hpi (upper histogram) and replication fold increase from 3 hpi to 4 dpi (lower histogram). Shown are mean ± SEM of at least 8 analyzed wells per condition of one representative out of three independent experiments. Bar: 50 μm. (B) BMDMs were grown in 24-well plates, infected with Mtb H37Rv (MOI of 2) and lysed at 2, 24, 48 and 72 hpi. Serial dilutions of lysates were plated out to determine bacterial load by counting CFUs. Shown are mean ± SEM of 4 wells per condition of one representative out of two independent experiments. (C) Histograms showing relative cytokine amounts in supernatant of infected WT, Tirap+/- and Tirap-/- BMDMs 96 hpi compared to non-infected cells. Shown are mean ± SEM of three infected wells. (D) Histogram showing mean ± SEM of relative Tirap gene expression. WT, Tirap+/- and Tirap-/- BMDMs were infected with Mtb H37Rv at MOI of 2 for 3 h. Non-infected (NI) WT cells served as control. Transcription of Tirap was assessed by quantitative RT-PCR and normalized to the expression of Gapdh, used in all samples as a housekeeping gene. (E) RAW264.7 cells were transfected with mCherry-Tirap vector expressing lentivirus for 48 h prior to infection with Mtb H37Rv-GFP. Confocal microscopy imaging shows subcellular localization of Tirap (m-cherry) and Mtb H37Rv-GFP (green). Bar: 5 μm. NI: non-infected, Inf: infected, hpi: hours post-infection, dpi: days post-infection, ns: non-significant, * P value < 0.05, ** P value < 0.01, *** P value < 0.001, **** P value < 0.0001, as determined by one-way ANOVA test.
Fig 3
Fig 3. Tirap implication in phagosomal maturation and lipid droplet formation.
Typical images and related quantifications (representative of two independent experiments) of phagosome acidification (A), phagosome rupture (B) and lipid droplet formation (C) of Mtb H37Rv infected BMDMs treated (D) or not with ConA. (A) DAPI-labelled cell nuclei are shown in blue, Mtb H37Rv-DsRed in red and acidic-pH-sensitive LysoTracker staining in green. The LysoTracker signal was set to the minimum in non-infected controls. Bar: 10 μm. Histograms showing mean ± SEM obtained from 7 wells of the percentage of bacteria displaying a Lysotracker signal within the cells. (B) Representative images showing cells displaying CCF4-AM staining (green) or CCF4 staining (blue) corresponding to phagosomal rupture. Histograms showing mean ± SEM obtained from 7 wells of the percentage of BMDMs detected with phagosomal rupture 24 hpi. Bar: 5 μm. (C) Representative images showing LD in Mtb infected cells. DAPI-labelled cell nuclei are in blue, Mtb H37Rv-GFP is in green, and LD staining (LipidTox) is in red. Bar: 5 μm. Histogram showing the average number ± SEM of LD per cell at 96 hpi obtained from at least 6 wells. LD: lipid droplets, * P value < 0.05, ** P value < 0.01, *** P value < 0.001, **** P value < 0.0001, as determined by one-way ANOVA test.
Fig 4
Fig 4. Identification of differentially regulated genes between +/+, +/- and -/- BMDMs during Mtb infection.
(A) Total RNA was extracted from non-infected and infected (3 h) WT, Tirap+/- and Tirap-/- BMDMs and sequenced with the Illumina system and Deseq2 analysis as described in the Materials and Methods section. (B) Volcano plot of RNAseq data from non-infected versus infected cells showing the adjusted p-value (false discovery rate, FDR -log10) versus fold change, FC (log2). The 100 genes with an FDR < 0.01 and FC > 2 are shown in blue and orange for downregulated and upregulated genes, respectively. (C) Histograms showing mean ± SEM of gene expression levels in BMDMs from WT, Tirap+/- and Tirap-/- mice 3 hpi. Cish and Gmcsf expression was quantified by quantitative RT-PCR. Stat5 expression level is reported from RNAseq data. (D) Schema of the different subcellular events studied in infected RAW264.7 cells silenced for Cish gene expression. (E) RAW264.7 cells were grown in 384-well plates, infected with Mtb H37Rv (MOI of 2) and analyzed by automated confocal microscopy. Histograms show the quantification of Cish gene expression and different phenotypic subcellular events during Mtb infection of WT (Cont) and silenced (Cish-shRNA) RAW264.7 cells. ** P value < 0.01, *** P value < 0.001, **** P value < 0.0001, as determined by one-way ANOVA test.
Fig 5
Fig 5. Tirap implication in Mtb effectors secretion.
(A) BMDMs were seeded into 96-well plates and loaded with homologous (pos) or control (-) peptides or infected with Mtb H37Rv-DsRed. 24 hours post incubation, cells were washed and co-cultured with transduced anti-Ag85 or anti-Esat6 reporter T-cell hybridomas. These were then analyzed by automated confocal microscopy. Shown are representative images of DAPI labelled T-cells (blue) and Antigen specific T-cells (green). Histograms showing mean ± SEM of percentage of ESAT-6 or Ag85 specific T-cells obtained from 5 analysed wells. (B) BMDMs from WT, Tirap+/- and Tirap-/- mice were infected with an attenuated strain of Mtb (H37Ra-GFP) (MOI of 2) and analyzed by automated confocal microscopy. The histogram shows the replication fold increase from 3 hpi to 4 dpi. Shown are mean ± SEM obtained from at least 12 analyzed wells per condition. (C) WT (+/+), knocked-out (-/-) for Myd88, TLR2, TLR4 and TLR9 BMDMs were infected with H37Rv-GFP (MOI of 2) and analyzed by automated confocal microscopy. The histogram shows the replication fold increase from 3 hpi to 4 dpi. Shown are mean ± SEM obtained from at least 4 analyzed wells per condition of one representative out of two independent experiments. *** P value < 0.001 as determined by one-way ANOVA test.
Fig 6
Fig 6. Summary.
(A) The outcome of Mtb infection is dependent on Tirap expression and depends on whether the mouse has homozygous (susceptibility) or heterozygous (resistance) Tirap KO phenotype. Although homozygous mice show the same susceptibility phenotype, the lungs of WT mice are characterized by a greater inflammatory state than the lungs of completely deficient mice. The latter, in turn, present a neutrophil-rich environment that may be permissive to Mtb replication. At the macrophage level, both homozygous and heterozygous deficiency in Tirap expression restrict intracellular Mtb growth. Efficient killing of the pathogen is promoted by inhibition formation of LD, prevention of production of inappropriate amounts of inflammatory cytokines and induction of a proper MCV maturation. (B) Infection of macrophages by Mtb, which leads to the recruitment of Tirap to Mtb-containing vacuoles under WT conditions, limits the acidification of MCVs, induces their rupture and allows Mtb access to the cytosol, where the generation of lipid droplets is induced and fuels the growth of pathogens in host cells. Although our model clearly shows the involvement of the Cish-STAT5 pathway in targeting MCV maturation, the molecular link with the involvement of Tirap remains to be explored.

References

    1. Barreiro LB, Ben-Ali M, Quach H, Laval G, Patin E, Pickrell JK, et al.. Evolutionary dynamics of human Toll-like receptors and their different contributions to host defense. PLoS Genet. 2009;5(7):e1000562. doi: 10.1371/journal.pgen.1000562 - DOI - PMC - PubMed
    1. Noreen M, Arshad M. Association of TLR1, TLR2, TLR4, TLR6, and TIRAP polymorphisms with disease susceptibility. Immunol Res. 2015;62(2):234–52. doi: 10.1007/s12026-015-8640-6 - DOI - PubMed
    1. D’Onofrio V, Monnier AA, Kremer C, Stappers MHT, Netea MG, Gyssens IC. Lesion size is associated with genetic polymorphisms in TLR1, TLR6, and TIRAP genes in patients with major abscesses and diabetic foot infections. Eur J Clin Microbiol Infect Dis. 2020;39(2):353–60. doi: 10.1007/s10096-019-03732-7 - DOI - PMC - PubMed
    1. Collin M, Dickinson R, Bigley V. Haematopoietic and immune defects associated with GATA2 mutation. Br J Haematol. 2015;169(2):173–87. doi: 10.1111/bjh.13317 - DOI - PMC - PubMed
    1. Rajpoot S, Wary KK, Ibbott R, Liu D, Saqib U, Thurston TLM, et al.. TIRAP in the Mechanism of Inflammation. Front Immunol. 2021;12:697588. doi: 10.3389/fimmu.2021.697588 - DOI - PMC - PubMed

Publication types

Substances