Structural Racism and Pedestrian Safety: Measuring the Association Between Historical Redlining and Contemporary Pedestrian Fatalities Across the United States, 2010‒2019
- PMID: 36888942
- PMCID: PMC10003496
- DOI: 10.2105/AJPH.2022.307192
Structural Racism and Pedestrian Safety: Measuring the Association Between Historical Redlining and Contemporary Pedestrian Fatalities Across the United States, 2010‒2019
Abstract
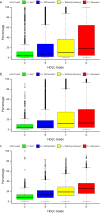
Objectives. To examine the association between historical redlining and contemporary pedestrian fatalities across the United States. Methods. We analyzed 2010-2019 traffic fatality data, obtained from the Fatality Analysis Reporting System, for all US pedestrian fatalities linked by location of crash to 1930s Home Owners' Loan Corporation (HOLC) grades and current sociodemographic factors at the census tract level. We applied generalized estimating equation models to assess the relationship between the count of pedestrian fatalities and redlining. Results. In an adjusted multivariable analysis, tracts graded D ("Hazardous") had a 2.60 (95% confidence interval = 2.26, 2.99) incidence rate ratio (per residential population) of pedestrian fatalities compared with tracts graded A ("Best"). We found a significant dose‒response relationship: as grades worsened from A to D, rates of pedestrian fatalities increased. Conclusions. Historical redlining policy, initiated in the 1930s, has an impact on present-day transportation inequities in the United States. Public Health Implications. To reduce transportation inequities, understanding how structurally racist policies, past and present, have an impact on community-level investments in transportation and health is crucial. (Am J Public Health. 2023;113(4):420-428. https://doi.org/10.2105/AJPH.2022.307192).
Figures


Comment in
-
Home Owners' Loan Corporation Maps and Place-Based Injury Risks: A Complex History.Am J Public Health. 2023 Apr;113(4):356-358. doi: 10.2105/AJPH.2023.307242. Am J Public Health. 2023. PMID: 36888953 Free PMC article. No abstract available.
Similar articles
-
Structural Racism, Historical Redlining, and Incidence of Kidney Failure in US Cities, 2012-2019.J Am Soc Nephrol. 2023 Sep 1;34(9):1493-1503. doi: 10.1681/ASN.0000000000000165. Epub 2023 Jun 12. J Am Soc Nephrol. 2023. PMID: 37303086 Free PMC article.
-
Race, historical redlining, and contemporary transportation noise disparities in the United States.J Expo Sci Environ Epidemiol. 2025 Jan;35(1):50-61. doi: 10.1038/s41370-024-00682-x. Epub 2024 May 17. J Expo Sci Environ Epidemiol. 2025. PMID: 38760532
-
Historical Redlining and Present-Day Nonsuicide Firearm Fatalities.Ann Intern Med. 2024 May;177(5):592-597. doi: 10.7326/M23-2496. Epub 2024 Apr 23. Ann Intern Med. 2024. PMID: 38648643
-
The relationship between impact speed and the probability of pedestrian fatality during a vehicle-pedestrian crash: A systematic review and meta-analysis.Accid Anal Prev. 2019 Aug;129:241-249. doi: 10.1016/j.aap.2019.05.033. Epub 2019 Jun 5. Accid Anal Prev. 2019. PMID: 31176144
-
The Relationship of Historical Redlining with Present-Day Neighborhood Environmental and Health Outcomes: A Scoping Review and Conceptual Model.J Urban Health. 2022 Dec;99(6):959-983. doi: 10.1007/s11524-022-00665-z. Epub 2022 Aug 1. J Urban Health. 2022. PMID: 35915192 Free PMC article.
Cited by
-
The impact of historical redlining on neurosurgeon distribution and reimbursement in modern neighborhoods.Front Public Health. 2024 May 7;12:1364323. doi: 10.3389/fpubh.2024.1364323. eCollection 2024. Front Public Health. 2024. PMID: 38774047 Free PMC article.
-
Applying individual- and residence-based equity measures to characterize disparities in crash outcomes.J Safety Res. 2025 Feb;92:522-531. doi: 10.1016/j.jsr.2025.01.006. Epub 2025 Feb 5. J Safety Res. 2025. PMID: 39986871
-
Emergency Department Visits for Pedestrians Injured in Motor Vehicle Traffic Crashes - United States, January 2021-December 2023.MMWR Morb Mortal Wkly Rep. 2024 May 2;73(17):387-392. doi: 10.15585/mmwr.mm7317a1. MMWR Morb Mortal Wkly Rep. 2024. PMID: 38696330 Free PMC article.
-
A Standard Measure of Structural Racism, Do We Have One? Can We Have One? A Narrative Review of Commonly Used Measures and Domains of Use.J Racial Ethn Health Disparities. 2024 Sep 16. doi: 10.1007/s40615-024-02179-7. Online ahead of print. J Racial Ethn Health Disparities. 2024. PMID: 39285153 Review.
-
Racial residential segregation is associated with ambient air pollution exposure after adjustment for multilevel sociodemographic factors: Evidence from eight US-based cohorts.Environ Epidemiol. 2025 Jan 20;9(1):e367. doi: 10.1097/EE9.0000000000000367. eCollection 2025 Feb. Environ Epidemiol. 2025. PMID: 39839804 Free PMC article.
References
-
- Office of Disease Prevention and Health Promotion, US Department of Health and Human Services. 2022. https://health.gov/healthypeople
-
- Governors Highway Safety Association. Pedestrian traffic fatalities by. 2022. https://www.ghsa.org/resources/Pedestrians22
-
- Governors Highway Safety Association. 2021. https://www.ghsa.org/resources/Analysis-of-Traffic-Fatalities-by-Race-an...
Publication types
MeSH terms
LinkOut - more resources
Full Text Sources
Miscellaneous

