

Phenotypic changes in low-density lipoprotein particles as markers of adverse clinical outcomes in COVID-19
- PMID: 36889041
- PMCID: PMC9969752
- DOI: 10.1016/j.ymgme.2023.107552
Phenotypic changes in low-density lipoprotein particles as markers of adverse clinical outcomes in COVID-19
Abstract
Background and aims: Low-density lipoprotein (LDL) plasma concentration decline is a biomarker for acute inflammatory diseases, including coronavirus disease-2019 (COVID-19). Phenotypic changes in LDL during COVID-19 may be equally related to adverse clinical outcomes.
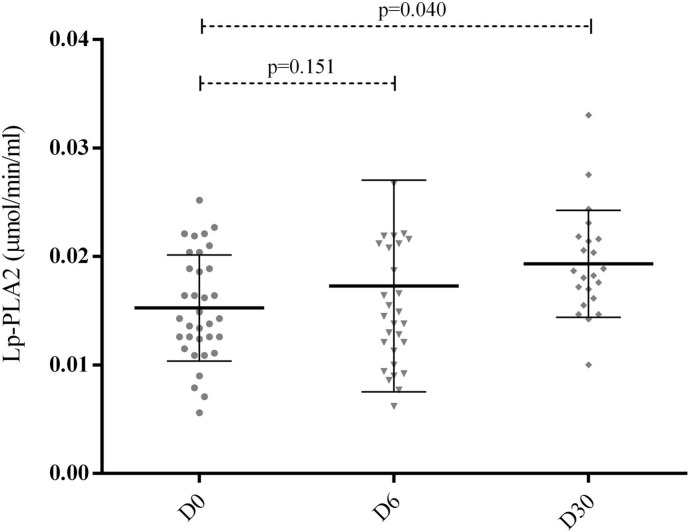
Methods: Individuals hospitalized due to COVID-19 (n = 40) were enrolled. Blood samples were collected on days 0, 2, 4, 6, and 30 (D0, D2, D4, D6, and D30). Oxidized LDL (ox-LDL), and lipoprotein-associated phospholipase A2 (Lp-PLA2) activity were measured. In a consecutive series of cases (n = 13), LDL was isolated by gradient ultracentrifugation from D0 and D6 and was quantified by lipidomic analysis. Association between clinical outcomes and LDL phenotypic changes was investigated.
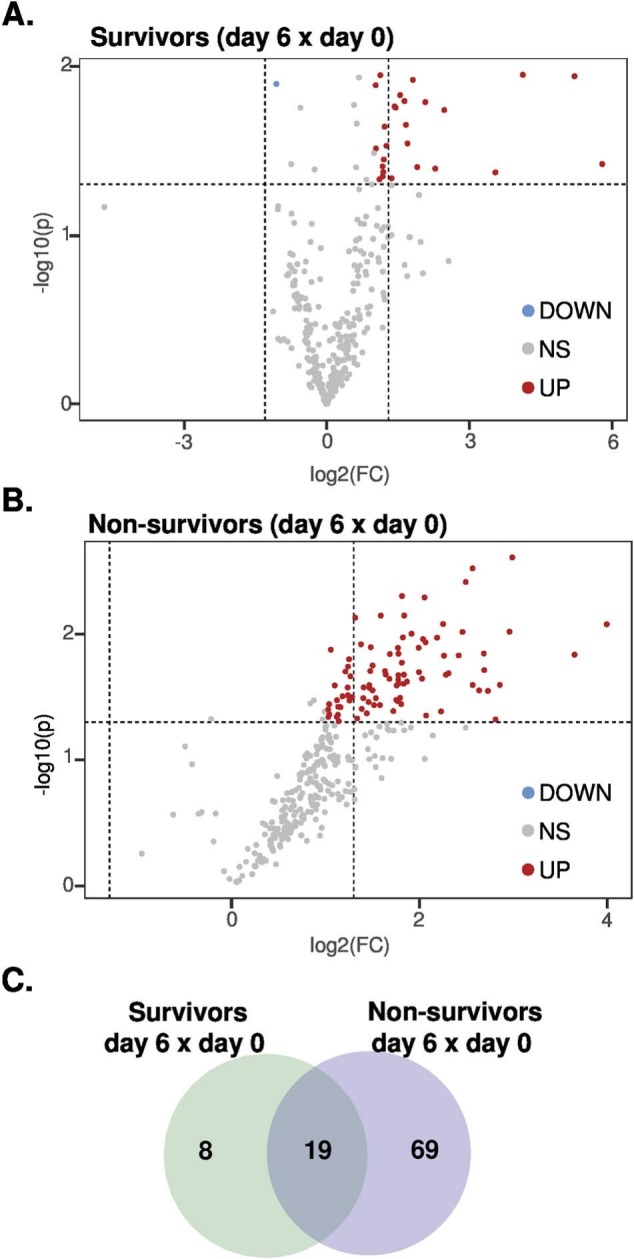
Results: In the first 30 days, 42.5% of participants died due to Covid-19. The serum ox-LDL increased from D0 to D6 (p < 0.005) and decreased at D30. Moreover, individuals who had an ox-LDL increase from D0 to D6 to over the 90th percentile died. The plasma Lp-PLA2 activity also increased progressively from D0 to D30 (p < 0.005), and the change from D0 to D6 in Lp-PLA2 and ox-LDL were positively correlated (r = 0.65, p < 0.0001). An exploratory untargeted lipidomic analysis uncovered 308 individual lipids in isolated LDL particles. Paired-test analysis from D0 and D6 revealed higher concentrations of 32 lipid species during disease progression, mainly represented by lysophosphatidyl choline and phosphatidylinositol. In addition, 69 lipid species were exclusively modulated in the LDL particles from non-survivors as compared to survivors.
Conclusions: Phenotypic changes in LDL particles are associated with disease progression and adverse clinical outcomes in COVID-19 patients and could serve as a potential prognostic biomarker.
Keywords: COVID-19; Lipoprotein-associated phospholipase A2; Oxidized low-density lipoprotein; Quantitative lipidomics.
Copyright © 2023. Published by Elsevier Inc.
Conflict of interest statement
Declaration of Competing Interest Dr. Miguel Sáinz-Jaspeado works at Mercodia company (Mercodia AB, Uppsala, Sweden) as product Manager & Medical Science Liaison and, kindly provided the enzyme-linked immunoassay (ELISA) kits for oxidized low-density lipoprotein measures.
Figures


References
-
- Rott D., Klempfner R., Goldenberg I., Leibowitz D. Cholesterol levels decrease soon after acute myocardial infarction. The Israel Med. Associat. J. IMAJ. 2015;17(6):370–373. - PubMed
-
- Cheng K.H., Chu C.S., Lin T.H., Lee K.T., Sheu S.H., Lai W.T. Lipid paradox in acute myocardial infarction-the association with 30-day in-hospital mortality. Crit. Care Med. 2015;43(6):1255–1264. - PubMed
-
- Reddy V.S., Bui Q.T., Jacobs J.R., Begelman S.M., Miller D.P., French W.J., et al. Relationship between serum low-density lipoprotein cholesterol and in-hospital mortality following acute myocardial infarction (the lipid paradox) Am. J. Cardiol. 2015;115(5):557–562. - PubMed
-
- Acikgoz E., Acikgoz S.K., Yaman B., Kurtul A. Lower LDL-cholesterol levels associated with increased inflammatory burden in patients with acute ST-segment elevation myocardial infarction. Rev Assoc Med Bras(1992) 2021;67(2):224–229. - PubMed
Publication types
MeSH terms
Substances
LinkOut - more resources
Full Text Sources
Medical
