. 2023 Mar 7;35(3):438-455.e7.
doi: 10.1016/j.cmet.2023.02.004.

Estradiol regulates leptin sensitivity to control feeding via hypothalamic Cited1

Affiliations

Estradiol regulates leptin sensitivity to control feeding via hypothalamic Cited1

Ismael González-García et al. Cell Metab. .

Abstract

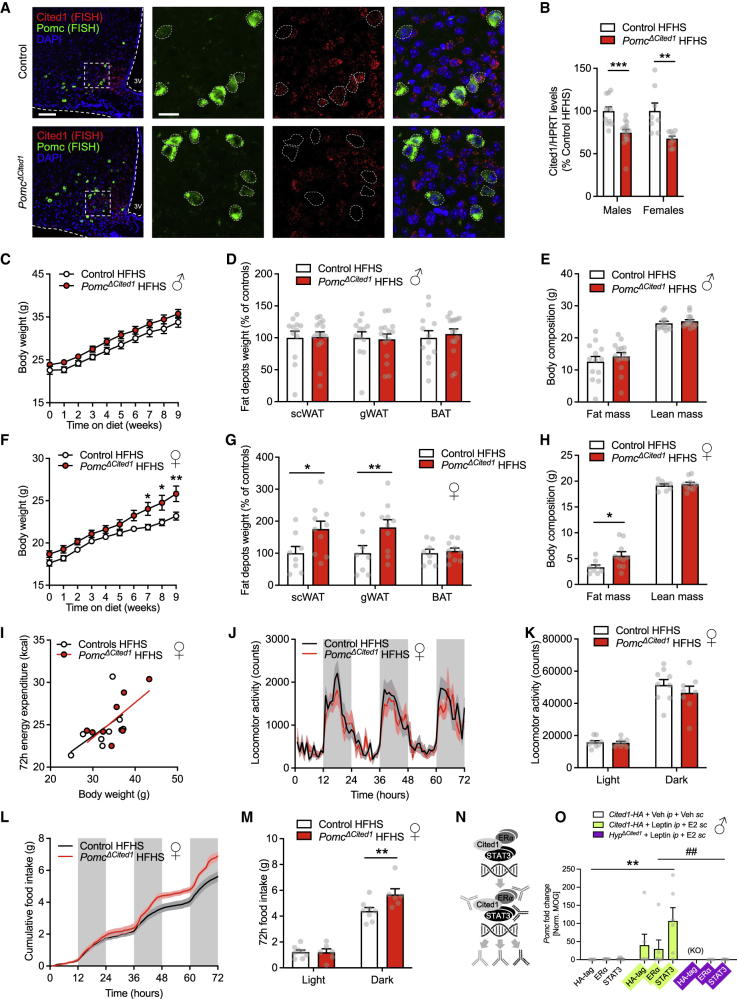
Until menopause, women have a lower propensity to develop metabolic diseases than men, suggestive of a protective role for sex hormones. Although a functional synergy between central actions of estrogens and leptin has been demonstrated to protect against metabolic disturbances, the underlying cellular and molecular mechanisms mediating this crosstalk have remained elusive. By using a series of embryonic, adult-onset, and tissue/cell-specific loss-of-function mouse models, we document an unprecedented role of hypothalamic Cbp/P300-interacting transactivator with Glu/Asp-rich carboxy-terminal domain 1 (Cited1) in mediating estradiol (E2)-dependent leptin actions that control feeding specifically in pro-opiomelanocortin (Pomc) neurons. We reveal that within arcuate Pomc neurons, Cited1 drives leptin's anorectic effects by acting as a co-factor converging E2 and leptin signaling via direct Cited1-ERα-Stat3 interactions. Together, these results provide new insights on how melanocortin neurons integrate endocrine inputs from gonadal and adipose axes via Cited1, thereby contributing to the sexual dimorphism in diet-induced obesity.

Keywords: ARC; Pomc; diet-induced obesity; estradiol; hypothalamus; leptin.


Conflict of interest statement

Declaration of interests M.H.T. is a member of the scientific advisory board of ERX Pharmaceuticals, Inc., Cambridge, MA. He was a member of the Research Cluster Advisory Panel (ReCAP) of the Novo Nordisk Foundation between 2017 and 2019. He attended a scientific advisory board meeting of the Novo Nordisk Foundation Center for Basic Metabolic Research, University of Copenhagen, in 2016. He received funding for his research projects by Novo Nordisk (2016–2020) and Sanofi-Aventis (2012–2019). He consulted for Böhringer Ingelheim Pharma GmbH & Co. KG (2020). He delivered a scientific lecture for Sanofi-Aventis Deutschland GmbH in 2020. He is an editorial board member of Cell Metabolism. He confirms that to the best of his knowledge none of the above were involved in the preparation of this paper.

Figures

None
Graphical abstract
Figure 1
Figure 1
Central nervous system characterization and effect of Cited1 ablation on energy balance (A) Left and lower right panels: representative images of a coronal brain section HA-Tag immunoreactivity (magenta) from Cited1-HA mice. Upper right panel: graphical representation of a mouse brain sagittal section. The dashed line indicates the anteroposterior location of the brain slice depicted in the immunofluorescence images from the same panel. Scale bars, 2 mm (left panel) and 200 μm (lower right panel). (B) Representative confocal images depicting HA-Tag immunoreactivity (red) and DAPI (blue) in peripheral tissues of Cited1-HA mice. Scale bars, 500 μm (uterus, ovary, epididymis, testis, and kidney) and 200 μm (pituitary, adrenal gland, and blood vessels of the WAT). (C and D) Body weight of WT or Cited1-KO male mice fed with chow or HFHS. n = 4–17 mice per group. (E and F) Fat and lean mass, and relative scWAT, gWAT, and BAT depot weights of WT or Cited1-KO male mice fed with HFHS. n = 4–17 mice per group. (G and H) Body weight of WT or Cited1-KO female mice fed with chow or HFHS. n = 3–16 mice per group. (I and J) Fat and lean mass and relative scWAT, gWAT, and BAT depot weights of WT or Cited1-KO female mice fed with HFHS. n = 6–16 mice per group. (K and L) Cumulative and total (light versus dark phase) food intake of WT or Cited1-KO female mice fed with HFHS. n = 5–7 mice per group. (M and N) Time-dependent and total (light versus dark phase) locomotor activity of WT or Cited1-KO female mice fed with HFHS. n = 6–8 mice per group. (O) ANCOVA of the total energy expenditure (72 h) versus body weight of WT or Cited1-KO female mice fed with HFHS. n = 6–8 mice per group. (P) Relative body weight change (%) of WT or Cited1-KO male or female mice fed with HFHS. n = 6–16 mice per group. (Q) Ratio of scWAT versus gWAT depot weights of WT or Cited1-KO male or female mice fed with HFHS. n = 5–17 mice per group. (R) Relative body weight change (%) of WT, Cited1 (paternal heterozygous), Cited1 (maternal heterozygous), or Cited1-KO male mice fed with HFHS. n = 5–9 mice per group. Data are expressed as mean ± SEM (C–N and P–R) and individual values (O). Statistical analyses include two-way ANOVA (C–N and P–R) and ANCOVA (O). p < 0.05, ∗∗p < 0.01, ∗∗∗p < 0.001, and ∗∗∗∗p < 0.0001. 3V, third ventricle; ARC, arcuate nucleus of the hypothalamus.
Figure 2
Figure 2
Effect of estradiol manipulation on the Cited1 regulation in obesity (A and B) Body weight and body weight gain of WT or Cited1-KO ovariectomized female mice fed with HFHS. n = 7–8 mice per group. (C–E) Body weight, body weight gain, and fat and lean mass of WT or Cited1-KO male mice fed with HFHS and treated with E2 subcutaneously (s.c.) (2.8 μg/day). n = 6–9 mice per group. (F and G) Cumulative and total (light versus dark phase) food intake of WT or Cited1-KO male mice fed with HFHS and treated with E2 s.c. (2.8 μg/day). n = 4–7 mice per group. (H and I) Time-dependent and total (light versus dark phase) locomotor activity of WT or Cited1-KO male mice fed with HFHS and treated with E2 s.c. (2.8 μg/day). n = 4–6 mice per group. (J) ANCOVA of the total energy expenditure (72 h) versus body weight of WT or Cited1-KO male mice fed with HFHS and treated with E2 s.c. (2.8 μg/day). n = 4–7 mice per group. Data are expressed as mean ± SEM (A–I) and individual values (J). Statistical analyses include two-way ANOVA (A–I) and ANCOVA (J). p < 0.05 and ∗∗p < 0.01.
Figure 3
Figure 3
Effect of the loss of hypothalamic Cited1 on energy balance (A) Violin plots depict the expression of Agrp, Pomc, Cited1, and Tubb3 genes across neuronal clusters identified by Campbell et al. Neurons were identified on the basis of expression of the canonical neuronal marker Tubb3 gene. The shape of the violin plot indicates the distribution of cell depending on their level of expression. (B) Representative confocal micrographs depicting ERα (yellow) and HA-Tag (magenta) immunoreactivity in the ARC of Cited1-HA mice. Scale bars, 200 μm (upper panel) and 20 μm (lower panel). (C) Upper panel: quantification of the relative number of hypothalamic ERα positive neurons which co-express Cited1 in Cited1-HA mice. Lower panel: quantification of the relative number of hypothalamic Cited1-positive neurons that co-express ERα in Cited1-HA mice. n = 4 mice per group; 6 sections/mouse. (D and E) Body weight of control or HypΔCited1 male mice fed with chow or HFHS. n = 5–9 mice per group. (F and G) Body weight of control or HypΔCited1 female mice fed with chow or HFHS. n = 6–13 mice per group. (H and I) Relative scWAT, gWAT, and BAT weights, and fat and lean mass of control or HypΔCited1 female mice fed with HFHS. n = 8–13 mice per group. (J and K) Cumulative and total (light versus dark phase) food intake of control or HypΔCited1 female mice fed with HFHS. n = 8–13 mice per group. (L) Gene expression levels in the hypothalamus of control or HypΔCited1 female mice fed with HFHS. n = 6–11 mice per group. (M) Upper panel: graphical representation of the experimental paradigm performed. Lower panel: food intake change percentage of ovariectomized control or HypΔCited1 female mice fed chow diet and treated either with vehicle or E2 s.c. (1 μg/mice). n = 5–6 mice per group. (N) Schematic illustration and GFP immunofluorescence representative image depicting the stereotactical targeting of the mediobasal hypothalamus of Cited1loxP/loxP with AAV-GFP treatment. Scale bars, 200 μm. (O–S) Body weight; relative scWAT, gWAT, and BAT depot weights; fat and lean mass; and cumulative and total (light versus dark phase) food intake of control or MBHΔCited1(AAV-Cre) female mice fed with HFHS. n = 4–10 mice per group. Data are expressed as violin plot (A) mean ± SEM (D–M and O–S). Statistical analyses include two-way ANOVA (D–M and O–S). p < 0.05, ∗∗p < 0.01, ∗∗∗p < 0.001, ∗∗∗∗p < 0.0001, and ##p < 0.01. 3V, third ventricle; ARC, arcuate nucleus of the hypothalamus.
Figure 4
Figure 4
Cited1 mediates the crosstalk between estrogen and leptin signaling in the hypothalamus (A) Representative confocal micrographs depicting HA-Tag (magenta), tdTomato (cyan), and ERα (yellow) immunoreactivity in the ARC of Cited1-HA;LepR-Cre;Ai14-tdTomato mice fed with chow diet. Scale bars, 200 μm (upper panel) and 20 μm (lower panel). (B) Upper panel: graphical representation of the experimental paradigm performed. Lower panel: food intake change percentage of control or HypΔCited1 male mice fed chow diet and treated with vehicle and leptin intraperitoneally (i.p.) (3 mg/kg) (lower panel). n = 4 mice per group. (C) Upper panel: graphical representation of the experimental paradigm performed. Lower panel: food intake change percentage of control or HypΔCited1 female mice fed chow diet and treated with vehicle and leptin i.p. (3 mg/kg). n = 5 mice per group. (D) Upper panel: graphical representation of the experimental paradigm performed. Lower panel: food intake change percentage of ovariectomized control or HypΔCited1 female mice fed chow diet and treated either with vehicle s.c. and leptin i.p. (3 mg/kg) or E2 s.c. (1 μg/mice) and leptin i.p. (3 mg/kg) (lower panel). 10 = 12 mice per group. (E) Upper panel: graphical representation of the experimental paradigm performed. Lower panel: food intake change percentage of control or HypΔCited1 male mice fed with chow diet and treated with E2 s.c. (1 μg/mice) and leptin i.p. (3 mg/kg). n = 4 mice per group. (F) Serum leptin levels of control or HypΔCited1 female mice fed with chow or HFHS. n = 5–12 mice per group. (G) Serum leptin levels versus fat mass correlation of control or HypΔCited1 female mice fed with chow or HFHS. n = 5–12 mice per group. (H) Body weight of control or HypΔCited1 male mice fed with HFHS. The yellow bars indicate when the first and second E2-feeding behavior experiments were performed. n = 6–8 mice per group. (I) Serum leptin levels of control or HypΔCited1 male mice fed with chow or HFHS for 1 week or 6-weeks HFHS. n = 6–8 mice per group. (J) Upper panel: graphical representation of the experimental paradigm performed. Lower panel: food intake change percentage of control or HypΔCited1 male mice fed with HFHS and treated with E2 s.c. (1 μg/mice) after 1 week of HFHS exposure. n = 6–8 mice per group. (K) Upper panel: graphical representation of the experimental paradigm performed. Lower panel: food intake change percentage of control or HypΔCited1 male mice fed with HFHS and treated with E2 s.c. (1 μg/mice) after 6 weeks of HFHS exposure. n = 6–8 mice per group. Data are expressed as mean ± SEM (B–F and H–K) and individual values (G). Statistical analyses include two-way ANOVA (D, F, H, and I) and unpaired Student’s t tests (B, C, E, J, and K). p < 0.05, ∗∗p < 0.01, ∗∗∗p < 0.001, ∗∗∗∗p < 0.0001, and #p < 0.05. 3V, third ventricle.
Figure 5
Figure 5
Molecular characterization of Cited1 as a co-factor of E2 and leptin signaling pathways in the hypothalamus (A) Left: quantification of cFos+ neurons in the ARC of Cited1loxP/loxP female mice fed with chow diet and stereotactically injected with either AAV-Cre-GFP or AAV-GFP and treated with leptin i.p. n = 3–4 mice per group; 6 sections/mouse. Right: representative confocal micrographs depicting GFP (green) and cFOS immunoreactivity (magenta) in the ARC of control or MBHΔCited1(AAV-Cre) female mice fed with chow diet and treated with E2 s.c. (1 μg/mice) and leptin i.p. (3 mg/kg). Scale bars, 200 μm (right micrograph), 50 μm (left bottom micrograph), and 20 μm (left top micrograph). (B and C) Western blot chemiluminescence images and protein level quantification of HA-Tag, Stat3, ERα, GAPDH, and histone H3 in hypothalamic nuclear and cytosolic fractions of Cited1-HA male mice fed with chow diet and treated either with vehicle s.c. or E2 s.c. (1 μg/mice) and vehicle i.p. or leptin i.p. (3 mg/kg). n = 3 mice per group. (D and E) Western blot chemiluminescence representative images and protein level quantification of HA-Tag, Stat3, ERα, GAPDH, and histone H3 in hypothalamic nuclear and cytosolic fractions of Cited1-HA female mice fed with chow diet during metaestrus or proestrus and treated with either vehicle i.p. or leptin i.p. (3 mg/kg). n = 5 mice per group. (F) Estradiol levels of Cited1-HA female mice during metaestrus or proestrus and Cited1-HA male mice treated with E2 s.c. (1 μg/mice) and fed with chow diet. n = 6–10 mice per group. Data are expressed as mean ± SEM (A–F). Statistical analyses include two-way ANOVA (B–F) and unpaired Student’s t tests (A). p < 0.05, ∗∗p < 0.01, and ∗∗∗∗p < 0.0001. 3V, third ventricle.
Figure 6
Figure 6
Characterization of the Cited1 neuronal population and sex-dimorphic leptin action in the ARC hypothalamus (A) Representative confocal micrographs depicting GFP (green) and HA-Tag (magenta) immunoreactivity in the ARC of Cited1-HA;Pomc-GFP mice. Scale bars, 200 μm (top) and 50 μm (bottom). (B) Quantification of the relative number of hypothalamic Pomc neurons that co-express Cited1 in the Cited1-HA;Pomc-GFP male or female mice. n = 3 mice per group; 6 sections/mouse. (C) Representative confocal micrographs depicting HA-Tag (magenta), GFP (cyan), and ERα (yellow) immunoreactivity in the ARC of Cited1-HA;Pomc-GFP;LepR-Cre;Ai14-tdTomato male mice fed with chow diet. Scale bars, 20 μm. (D) Representative confocal micrographs depicting HA-Tag (blue), GFP (green), and tdTomato (red) immunoreactivity in the ARC of Cited1-HA;Pomc-GFP;LepR-Cre;Ai14-tdTomato male mice fed with chow diet. Scale bars, 200 μm (upper panel) and 20 μm (lower panel). (E) Left: quantification of cFOS/GFP+ neurons in the ARC of Pomc-GFP male and female mice fed with chow diet and treated either with vehicle or leptin i.p. (3 mg/kg). n = 5–6 mice per group; 6 sections/mouse. Right: representative confocal micrographs depicting GFP (green) and cFOS immunoreactivity (magenta) in the ARC of Pomc-GFP male and female mice fed with chow diet and treated either with vehicle or leptin i.p. (3 mg/kg). Scale bars, 200 μm (left micrograph) and 20 μm (right micrographs). (F) Quantification of GFP+ neurons in the ARC of Pomc-GFP male and female mice fed with chow diet. n = 9 mice per group; 6 sections/mouse. Data are expressed as mean (B) and mean ± SEM (E and F). Statistical analyses include two-way ANOVA (E) and unpaired Student’s t tests (F). ∗∗p < 0.01, ∗∗∗∗p < 0.0001, and ##p < 0.01. 3V, third ventricle.
Figure 7
Figure 7
Effect of Pomc neuron Cited1 KO in the development of diet-induced obesity (A) Representative confocal micrographs depicting Cited1 mRNA (red), Pomc mRNA (green), and DAPI (blue) in the ARC of control or PomcΔCited1 mice using RNAscope. The dashed lines highlight the soma of Pomc-positive neurons. Scale bars, 200 μm (left micrograph) and 50 μm (right micrograph). (B) Cited1 expression levels in the ARC of control or PomcΔCited1 male and female mice fed with HFHS. n = 8–15 mice per group. (C–E) Body weight; relative scWAT, gWAT, and BAT depot weights; and fat and lean mass of control or PomcΔCited1 male mice fed with HFHS. n = 12–16 mice per group. (F–M) Body weight; relative scWAT, gWAT, and BAT depot weights; fat and lean mass; ANCOVA of the total energy expenditure (72 h) versus body weight; time-dependent and total (light versus dark phase) locomotor activity; and cumulative and total (light versus dark phase) food intake of control or PomcΔCited1 female mice fed with HFHS. n = 6–10 mice per group. (N and O) Schematic illustration of the HT-ChIPmentation assay, and DNA binding by HT-ChIPm-qPCR of HA-Tag, ERα, or Stat3 of hypothalamic samples from Cited1-HA and HypΔCited1 male mice fed with chow diet and treated either with vehicle s.c. or E2 s.c. (1 μg/mice) and vehicle i.p. or leptin i.p. (3 mg/kg). n = 4–6 mice per group. Data are expressed as mean ± SEM (B–M and O). Statistical analyses include two-way ANOVA (B–M and O) and ANCOVA (I). p < 0.05, ∗∗p < 0.01, ∗∗∗p < 0.001, ∗∗∗∗p < 0.0001, and ##p < 0.01. 3V, third ventricle; FISH, fluorescence in situ hybridization; KO, knockout.

Comment in

References

    1. Sternson S.M., Atasoy D. Agouti-related protein neuron circuits that regulate appetite. Neuroendocrinology. 2014;100:95–102. doi: 10.1159/000369072. - DOI - PubMed
    1. Andermann M.L., Lowell B.B. Toward a wiring diagram understanding of appetite control. Neuron. 2017;95:757–778. doi: 10.1016/j.neuron.2017.06.014. - DOI - PMC - PubMed
    1. Quarta C., Claret M., Zeltser L.M., Williams K.W., Yeo G.S.H., Tschöp M.H., Diano S., Brüning J.C., Cota D. POMC neuronal heterogeneity in energy balance and beyond: an integrated view. Nat. Metab. 2021;3:299–308. doi: 10.1038/s42255-021-00345-3. - DOI - PMC - PubMed
    1. Kim J.D., Leyva S., Diano S. Hormonal regulation of the hypothalamic melanocortin system. Front. Physiol. 2014;5:480. doi: 10.3389/fphys.2014.00480. - DOI - PMC - PubMed
    1. Williams K.W., Elmquist J.K. From neuroanatomy to behavior: central integration of peripheral signals regulating feeding behavior. Nat. Neurosci. 2012;15:1350–1355. doi: 10.1038/nn.3217. - DOI - PMC - PubMed

Publication types

Grants and funding

LinkOut - more resources