. 2023 Jun:183:109600.
doi: 10.1016/j.radonc.2023.109600. Epub 2023 Mar 7.

Recurrence analysis of glioblastoma cases based on distance and dose information

Affiliations

Recurrence analysis of glioblastoma cases based on distance and dose information

Marco Langhans et al. Radiother Oncol. 2023 Jun.

Abstract

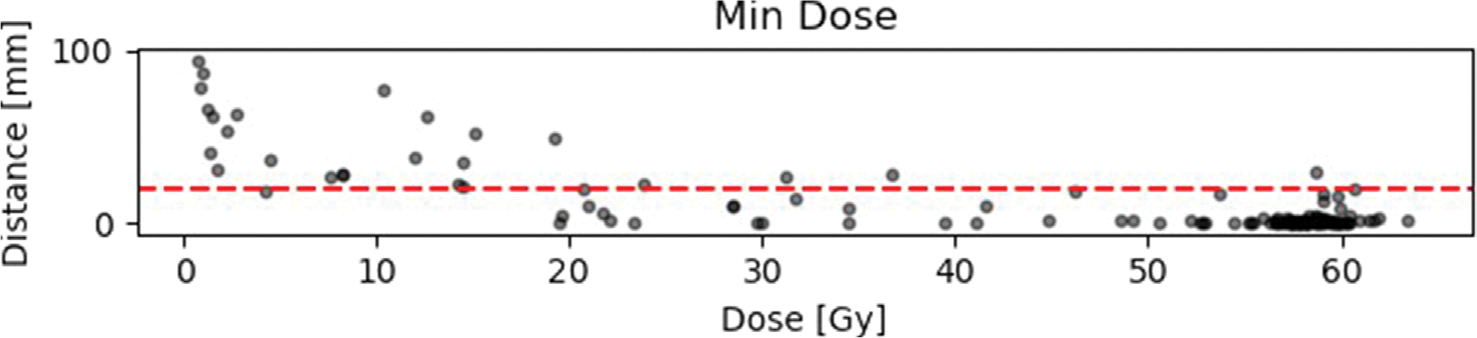
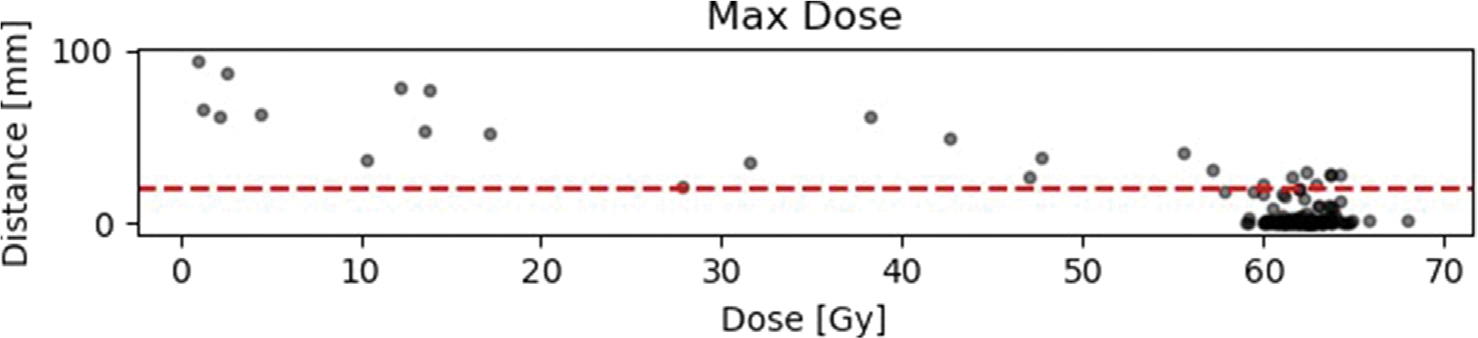
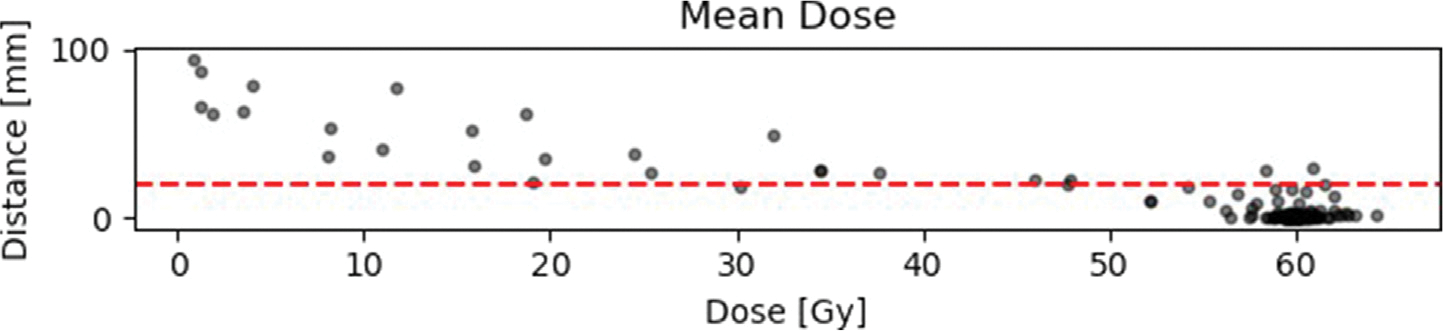
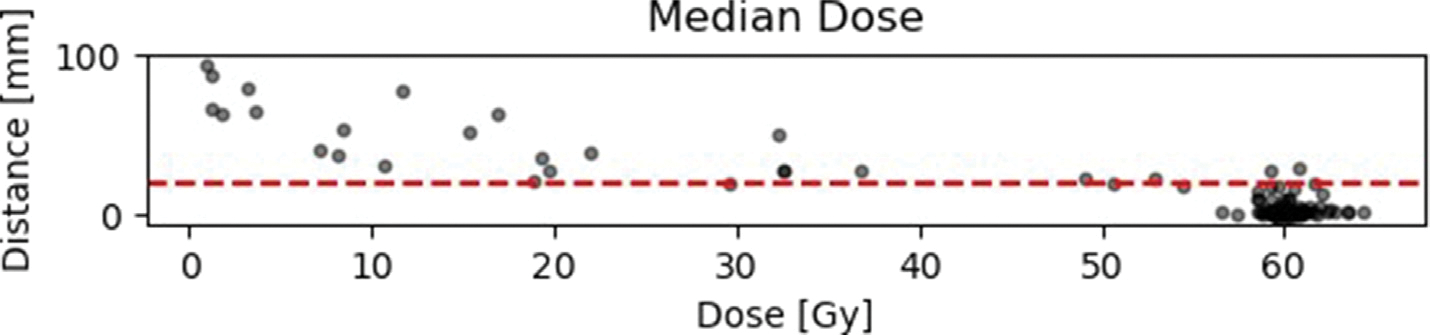
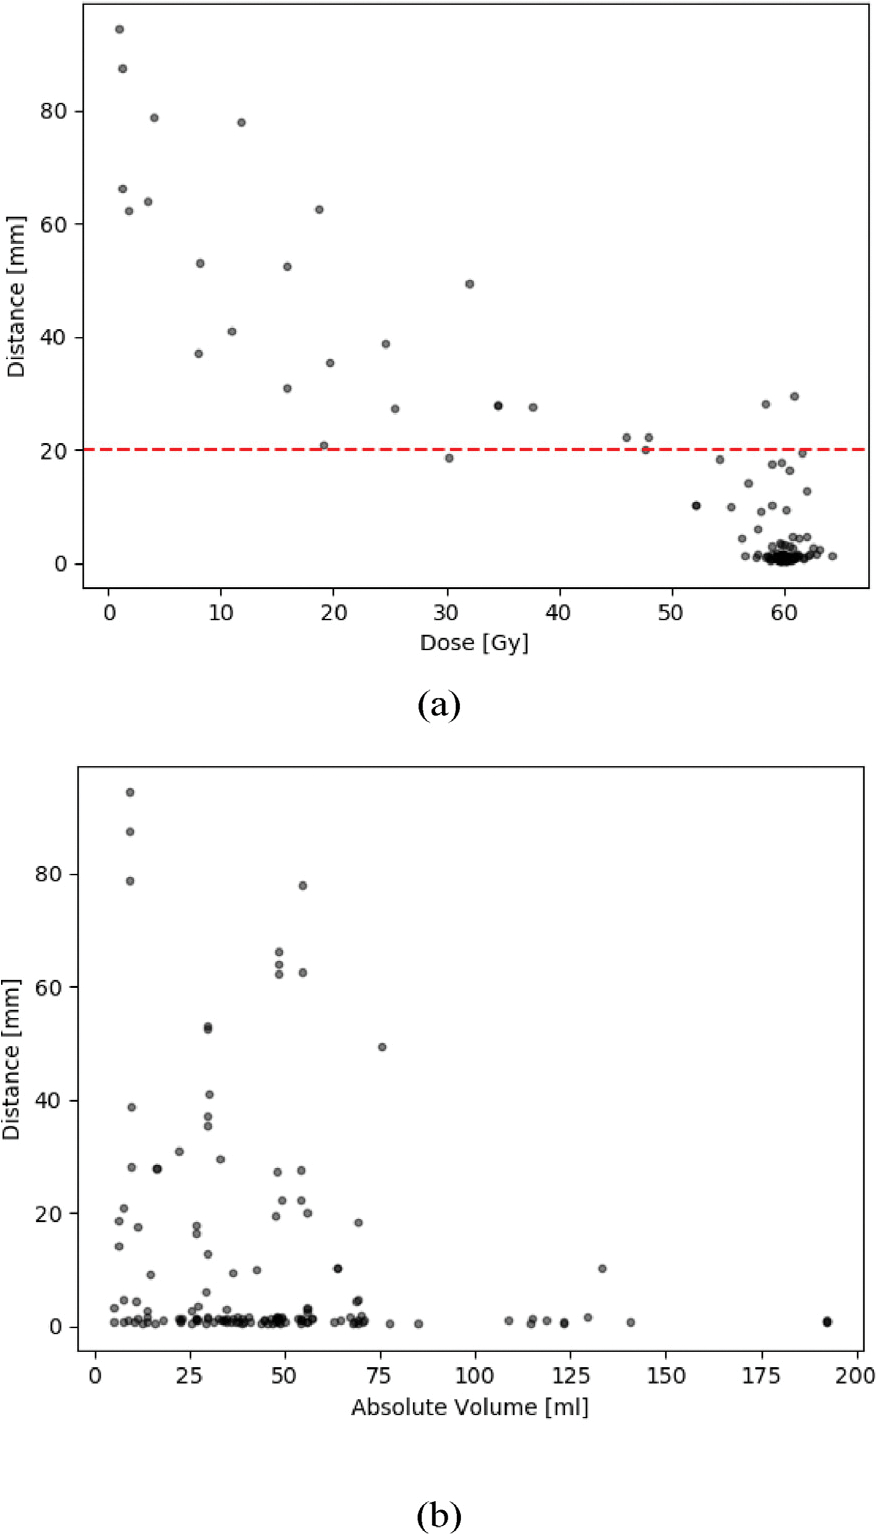
Background and purpose: Radiation therapy for glioblastoma (GBM) typically involves large target volumes. The aim of this study was to examine the recurrence pattern of GBM following modern radiochemotherapy according to EORTC guidelines and provide dose and distance information for the choice of optimal target volume margins.

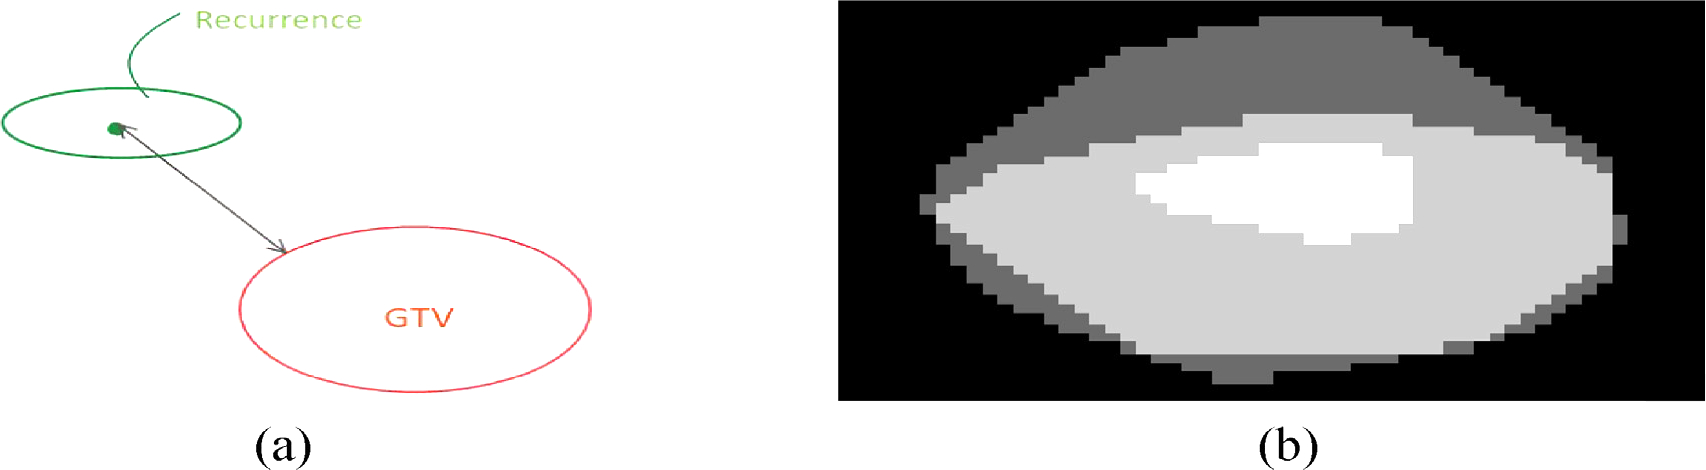
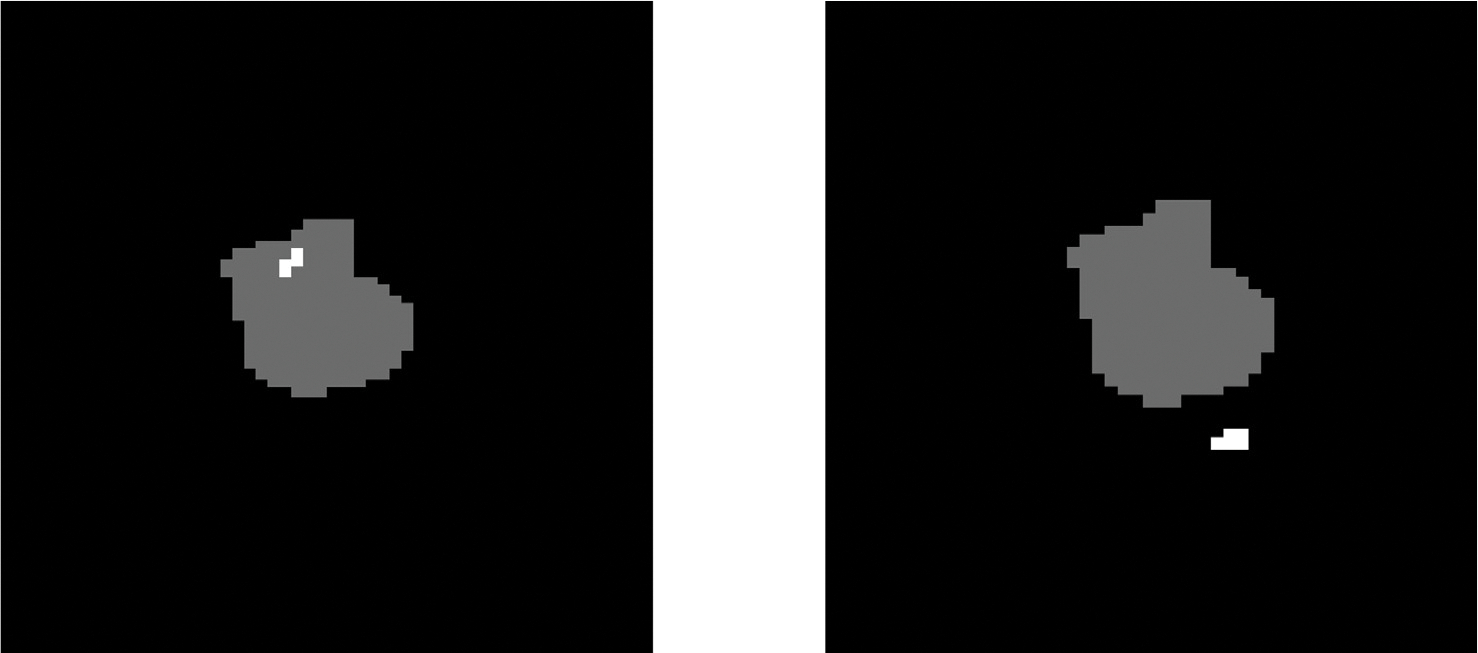
Materials and methods: In this study, the recurrences of 97 GBM patients, treated with radiochemotherapy from 2013 to 2017 at the Medical Center- University of Freiburg, Germany were analysed. Dose and distance based metrices were used to derive recurrence patterns.

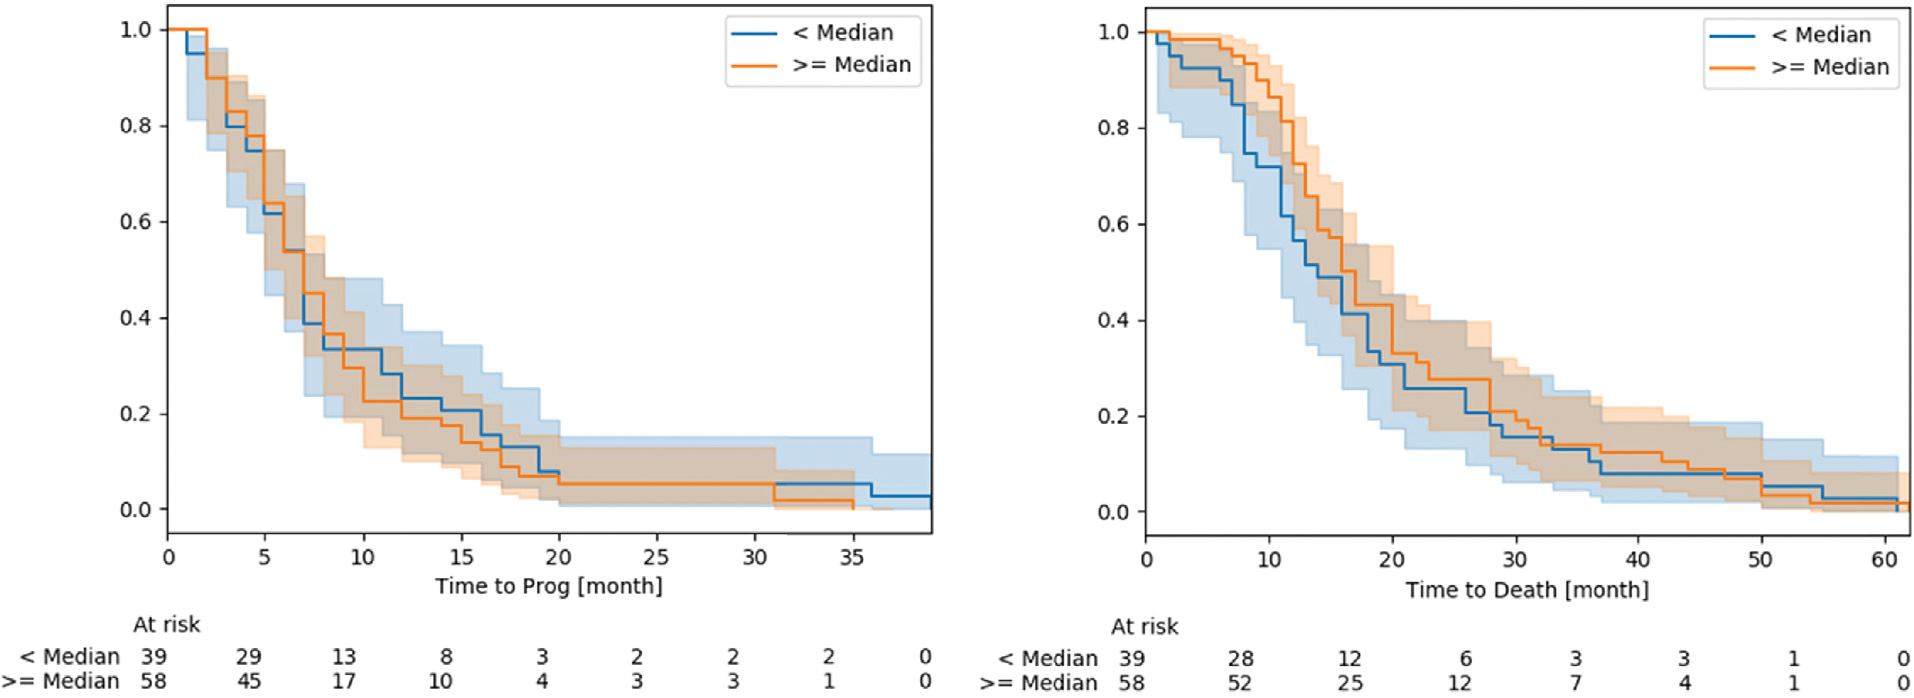
Results: The majority of recurrences (75%) occurred locally within the primary tumor area. Smaller GTVs had a higher rate of distant recurrences. Larger treated volumes did not show a clinical benefit regarding progression free and overall survival.

Conclusion: The identified recurrence pattern suggests that adjustments or reductions in target volume margins are feasible and could result in similar survival rates, potentially combined with a lower risk of side effects.

Keywords: Glioblastoma; Radiotherapy; Recurrence; Target volume.


Conflict of interest statement

Declaration of Competing Interest

The authors declare that they have no known competing financial interests or personal relationships that could have appeared to influence the work reported in this paper.

Figures

Fig. A5.
Fig. A5.
Results of the distance-dose analysis with respect to minimum, maximum and mean doses. The horizontal red line is equivalent to the suggested 2 cm margin in literature (for details and literature see 1).
Fig. A6.
Fig. A6.
Results of the distance-dose analysis with respect to median, standard deviation and relative volume RV. The horizontal red line is equivalent to the suggested 2 cm margin in literature (for details and literature see 1).
Fig. A7.
Fig. A7.
Results of the distance-dose analysis with respect to the overlapping relative volume. The horizontal red line indicates the recommended 2 cm margin in literature (for details and literature see 1).
Fig. A8.
Fig. A8.
Two dimensional slice showing the recurrence (white), the COM of which is 4 mm away from the GTV (grey) surface.
Fig. 1.
Fig. 1.
a: Schematical representation of the distance recurrence analysis. For illustration reasons the image is shown in R2 (instead of R3 - further details see text). b: Example of the marginal analysis (for illustration reasons the image is shown in R2 (instead of R3). White: GTV. Light-grey: VHD covered with 57 Gy. Dark-grey: Volume created by the marginal analysis using dmargin(GTV,HHD).
Fig. 2.
Fig. 2.
Examples for locations of recurrences (white) with respect to the GTV (grey). Left: central recurrence within the GTV. Right: marginal recurrence.
Fig. 3.
Fig. 3.
Kaplan Meier survival curves of Time to progression (left) and time to death (right), measured in months for both groups (smaller and larger or equal to the median dmargin(GTV,HHD). Shaded areas are the respective 95 % confidence levels. For details see text.
Fig. 4.
Fig. 4.
a: Results of the distance-dose analysis with respect to the mean dose. The horizontal red line indicates the suggested 2 cm margin in literature (for details and literature see 1). b: Here the d(GTV,Rec) of the recurrences from the GTV is plotted as a function of the absolute GTV Volume measured in ml.

References

    1. Bi WL, Beroukhim R, Beating the odds: extreme long-term survival with glioblastoma, Neuro-Oncology 16 (2014) 1159–1160. doi:10.1093/neuonc/nou166. - DOI - PMC - PubMed
    1. Niyazi M, Brada M, Chalmers AJ, Combs SE, Erridge SC, Fiorentino A, et al. ESTRO-ACROP guideline “target delineation of glioblastomas”. Radiother Oncol 2016;118:35–42. 10.1016/j.radonc.2015.12.003. - DOI - PubMed
    1. Greene-Schloesser D, Robbins ME, Peiffer AM, Shaw EG, Wheeler KT, Chan MD. Radiation-induced brain injury: a review. Front Oncol 2012;2:73. 10.3389/fonc.2012.00073. - DOI - PMC - PubMed
    1. Lee SW, Fraass BA, Marsh LH, Herbort K, Gebarski SS, Martel MK, Radany EH, Lichter AS, Sandler HM, Patterns of failure following high-dose 3-d conformal radiotherapy for high-grade astrocytomas: a quantitative dosimetric study., International journal of radiation oncology, biology, physics 43 (1999) 79–88. doi:10.1016/s0360-3016(98)00266-1. - DOI - PubMed
    1. McDonald MW, Shu H-K-G, Curran WJ, Crocker IR. Pattern of failure after limited margin radiotherapy and temozolomide for glioblas- toma. Int J Radiat Oncol Biol Phys 2011;79:130–6. 10.1016/j.ijrobp.2009.10.048. - DOI - PubMed

LinkOut - more resources