. 2023 Mar 8;14(1):1285.
doi: 10.1038/s41467-023-36969-0.

Longitudinal single-cell profiling of chemotherapy response in acute myeloid leukemia

Affiliations

Longitudinal single-cell profiling of chemotherapy response in acute myeloid leukemia

Matteo Maria Naldini et al. Nat Commun. .

Abstract

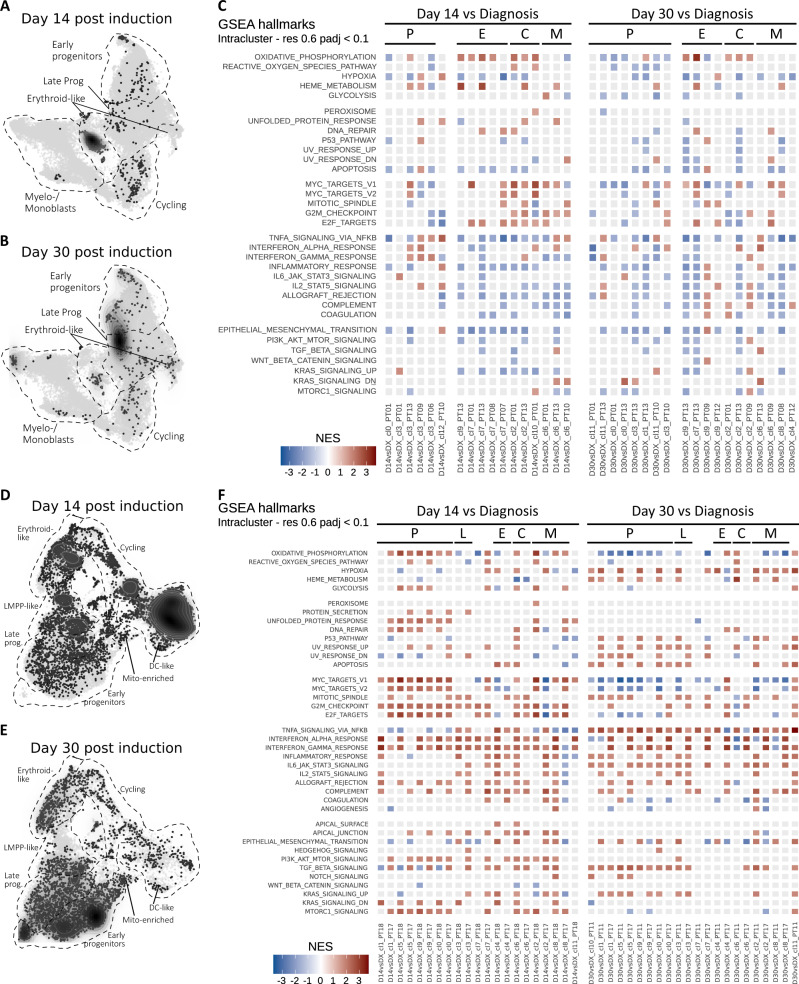
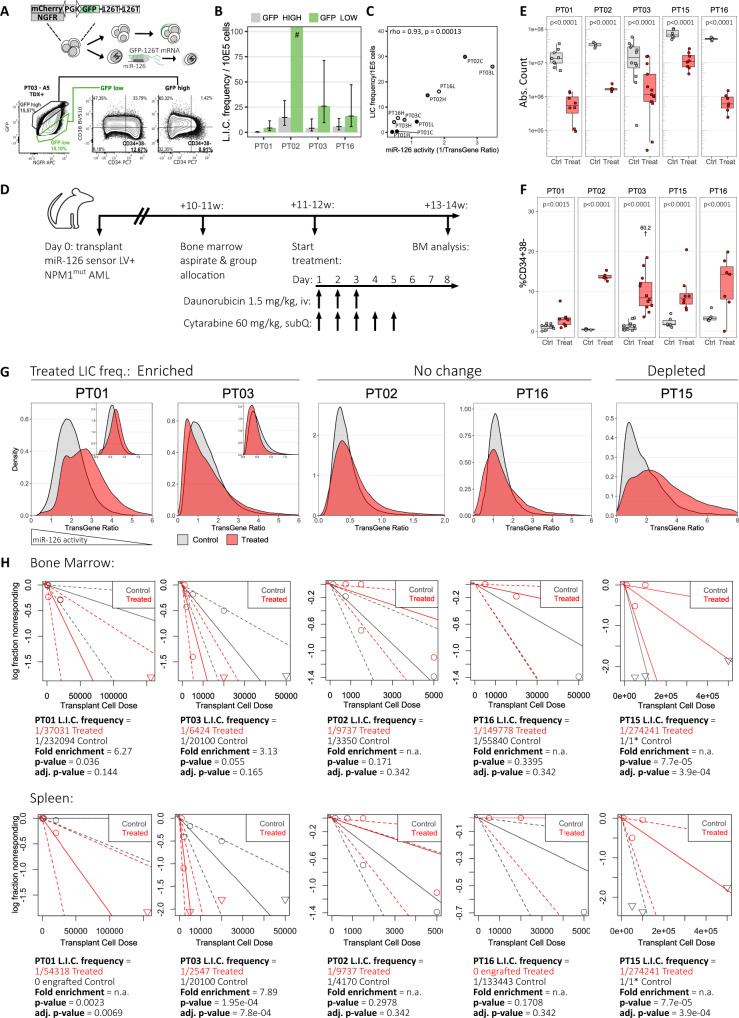
Acute myeloid leukemia may be characterized by a fraction of leukemia stem cells (LSCs) that sustain disease propagation eventually leading to relapse. Yet, the contribution of LSCs to early therapy resistance and AML regeneration remains controversial. We prospectively identify LSCs in AML patients and xenografts by single-cell RNA sequencing coupled with functional validation by a microRNA-126 reporter enriching for LSCs. Through nucleophosmin 1 (NPM1) mutation calling or chromosomal monosomy detection in single-cell transcriptomes, we discriminate LSCs from regenerating hematopoiesis, and assess their longitudinal response to chemotherapy. Chemotherapy induced a generalized inflammatory and senescence-associated response. Moreover, we observe heterogeneity within progenitor AML cells, some of which proliferate and differentiate with expression of oxidative-phosphorylation (OxPhos) signatures, while others are OxPhos (low) miR-126 (high) and display enforced stemness and quiescence features. miR-126 (high) LSCs are enriched at diagnosis in chemotherapy-refractory AML and at relapse, and their transcriptional signature robustly stratifies patients for survival in large AML cohorts.


Conflict of interest statement

The authors declare no competing interests.

Figures

Fig. 1
Fig. 1. Transcriptional landscape of human AML at single-cell resolution.
A Swimmer plots detailing the patients’ clinical course and timepoints selected for scRNAseq (red diamonds). Top horizontal axis: days from diagnosis. CR1, first complete remission. Rel1/2, first/second relapse; EM Rel, extramedullary relapse; NR, no response; MLFS, morphologic leukemia-free state; FLA-Ida, Fludarabine 50 mg/m2 D1-5, Cytarabine 1000 mg/m2 q12h D1-5, Idarubicin 10 mg/m2 D1-3, FLAG-Ida, as before, with granulocyte colony stimulating factor 30MU D0-5; 3 + 7, Cytarabine 100–200 mg/m2 D1-7 and Daunorubicin 60 mg/m2 D1-3; ICE, Idarubicin 12 mg/m2 D1-3, Cytarabine 100 mg/m2 D1-7, Etoposide 100 mg/m2 D1-5; MAMAC(3)5; m-Amsacrine 100 mg/m2 D1-(3)5, Cytarabine 1000 mg/m2 q12h D1-(3)5; A: Cytarabine monotherapy, with the number indicating the cumulative dose in g/m2 (e.g. A16, Cytarabine 16 g/m2); HMA: hypomethylating agent; HSCT I/II, first/second allogeneic hematopoietic stem cell transplantation; ASCT, autologous stem cell transplantation. B All single-cell RNA sequencing plots are based on uniform manifold approximation and projection (UMAP) embeddings; x-axis: UMAP_1, y-axis UMAP_2. UMAP plot of NPM1mut AML cells colored by unsupervised clustering (resolution 0.6) and labeled according to annotated cell phenotypes. n = 42,398 cells. C UMAP density plots of each patient’s AML blasts at diagnosis within the NPM1mutAML landscape. Cells are colored according to the patient’s treatment response: dark red for primary refractory, orange for relapse after CR, green for persistent CR. D Pseudotime trajectory (black lines) and pseudotime (color gradient) for AML cells at diagnosis projected on UMAP embedding. Trajectory root is set from the centroid of CD34 transcript expressing cells (white dot). E Left: UMAP plot of del(7) AML cells colored by unsupervised clustering (resolution 0.6) and labeled according to annotated cell phenotypes. Right: UMAP density plots displaying the distribution of each patient’s AML cells at diagnosis within the del(7) AML landscape. Cells are colored according to the patient’s treatment response: dark red for primary refractory and orange for relapse after CR. n = 33,308 cells.
Fig. 2
Fig. 2. Single-cell RNA sequencing of paired diagnosis/post-chemotherapy samples reveals an early proliferative response alongside with persisting quiescent progenitor blasts.
A UMAP density plot showing distribution of sequenced NPM1mut AML blasts at day 14 early post-chemotherapy (D14). n = 849 cells. B UMAP density plot showing distribution of sequenced NPM1mut AML blasts at day 30 post-chemotherapy (D30). n = 469 cells. C Tile plot of normalized enrichment scores (NES) from gene set enrichment analysis (GSEA) of hallmark terms on differentially expressed genes (DEG) between D14 or D30 and diagnosis (DX) blasts of NPM1mut AML patients within the indicated clusters (cl., see Fig. 1B for unsupervised clustering). Hallmarks (rows) are grouped by semantic similarity. Columns represent single-cluster, single-patient comparisons between the specified timepoints and are grouped by cluster phenotype (P, progenitor blasts; E, erythroid-like; C, cycling; M, myelo/monoblasts) and timepoint (Day 14; Day 30). Non-significant enrichment results are plotted in light grey (Benjamini–Hochberg adjusted p-value > 0.1). D UMAP density plot showing distribution of sequenced del(7) AML blasts at day 14 early post-chemotherapy. n = 8970 cells. E UMAP density plot showing distribution of sequenced del(7) AML blasts at day 30 post-chemotherapy. n = 3930. F Tile plot of normalized enrichment scores (NES) from GSEA of hallmark terms on DEG between D14 or D30 and diagnosis (DX) del(7) AML blasts within the indicated clusters (cl., see Fig. 1E for unsupervised clustering). P, progenitor blasts; L, LMPP-like blasts; E, erythroid-like; C, cycling; M, myelo/monoblasts), timepoint (day 14; day 30). Non-significant enrichment results are plotted in light grey (Benjamini–Hochberg adjusted p-value > 0.1).
Fig. 3
Fig. 3. Lentiviral miRNA-126 reporter allows prospective enrichment of LSCs in patient-derived AML xenografts and reveals AML subpopulations with diverging miR-126 activity upon chemotherapy.
A miR-126 reporter vector schematic: GFP and mCherry/NGFR are coordinately expressed by a promoter with bidirectional activity. The GFP 3′UTR is tagged with 2 miR-126 target sites resulting in miR-126high cells downregulating GFP compared to the untagged control (mCherry/NGFR) and being identifiable by flow cytometry within the GFPlow gate. B Limiting-dilution transplantation estimate of leukemia-initiating cell (L.I.C.) frequency for sorted GFPhigh/miR-126low and GFPlow/miR-126high populations. Barplot: mean, error bars: ±95% CI. # denotes failure to reach a limiting dose for PT02’s GFPlow subpopulation. C Correlation of L.I.C. frequency and miR-126 activity (1/TransGene Ratio) in xenotransplanted AML (n = 10). Spearman rho correlation coefficient and p-value are reported. D Mice engrafted with miR-126 reporter transduced NPM1mut AML were allocated into treated or control groups matching for AML burden (Supplementary Fig. 3E). Treated mice received daunorubicin/cytarabine chemotherapy. Control mice received equivalent saline doses. Mice were euthanized on day 8, when persisting AML was analyzed. E Day 8 absolute number of AML blasts in the BM of control (Ctrl) or treated (Treat) mice. n = 78 PDX from 5 patients over 7 independent experiments. Comparisons were performed by linear-mixed effects (LME) models accounting for mice injected with the same donor and experimental replicates. Adjusted p-values with Holm’s correction are reported. Data are presented as standard Tukey boxplots: center line: median; box: interquartile range; whiskers: IQR*1.5. F Percentage of transduced hCD34+38- immature blasts in the BM of Treat or Ctrl PDX. n, statistical testing and boxplot definition as per panel E. G miR-126 sensor vector TransGene Ratio (1/miR-126 activity) of day 8 residual BM AML from Treat (red) or Ctrl (grey) mice. Experimental replicates for PT01 and PT03 are displayed in the plot inlets. H Limiting-dilution transplant of day 8 BM AML cells recovered from Treat or Ctrl PDX. Proportion of non-engrafted mice (log) as a function of transplanted cell doses for the Treat (red line) or Ctrl group (grey line), with respective CI (dotted lines). Down-pointing triangles indicate doses with 100% engraftment. L.I.C. frequency estimation and p-values are reported below each plot. Engraftment was evaluated in the BM (top) or spleen (bottom) of recipient mice. Source data are provided as a Source Data file.
Fig. 4
Fig. 4. miR-126high LSCs co-express stem cell and lymphoid transcriptional profiles and up-regulate inflammatory signaling upon chemotherapy.
A Principal component analysis (PCA) on the top 1000 most variable genes prior to (left) or after batch correction for patient-derived variability (right). Samples are coded for sorted GFP subpopulations (green: GFPlow, grey: GFPhigh) and treatment groups (circles: control, triangles: chemotherapy-treated mice). n = 31 PDX from 4 patients. B Enrichment plot of Gene Set Enrichment Analysis (GSEA) of indicated gene lists within DEGs between GFPlow/miR-126high and GFPhigh/miR-126low blasts. Normalized Enrichment Score (NES) and q-value are reported for each signature. C Heatmap of agglomerated z-scores for selected Gene Ontology—Biological Processes (GO-BP) enriched terms (rows), grouped by semantic similarity, from the comparison of GFPlow/miR-126high vs. GFPhigh/miR-126low populations in over-representation analysis (ORA). Each column represents a sorted sample. Treatment group, patient ID and GFP population are annotated on top. n = 62 samples from 31 PDX from 4 patients. D Heatmap of agglomerated z-scores for enriched Hallmark gene sets (MSigDB H group) (rows) from the chemotherapy-treated vs. control comparison in GFPlow/miR-126high blasts only. Each column represents a sorted sample. Treatment group, patient ID and GFP population (GFPlow) are annotated on top. n = 31 samples from 31 PDX from 4 patients. E Heatmap of agglomerated z scores for enriched senescence-associated gene signatures (rows) from the chemotherapy-treated vs. control blast comparison. Each column represents a sorted sample. Treatment group, patient ID and GFP population (GFPlow or GFPhigh) are annotated on top. n = as per panel A. Source data are provided as a Source Data file.
Fig. 5
Fig. 5. Single-cell RNA sequencing of xenografts reveals persistance of miR-126high LSCs with enhanced transcriptional features of stemness upon in vivo chemotherapy.
A UMAP plot of day 8 BM AML blasts from treated or control PDX, colored by unsupervised clustering at resolution = 0.6. Dashed lines show manual annotation of clusters. n = 96,931 cells from 35 PDX from 4 patients. B UMAP density plots of AML blasts from control (top, black) or treated (bottom, red) xenografts. C UMAP density plots of sorted GFPlow/miR-126high blasts from control (top) or treated (bottom) xenografts. D 126High signature expression in scRNAseq AML blasts from control (top) or treated (bottom) xenografts. E Enrichment (right) or depletion (left) of scRNAseq cluster abundance in treated AML compared to the average abundance of each cluster in control xenografts from the same donor. n = 35 PDX from 4 patients over 4 independent experiments. Data are presented as standard Tukey boxplots (center line: median, box: interquartile range, whiskers: IQR*1.5). F Ridge plot of 126High signature expression across cells in scRNAseq from treated (red) or control (grey) xenografts. Single-cell events are displayed in the underlying rug plots. G Tile plot of normalized enrichment scores (NES) from GSEA of hallmark terms on DEGs between blasts from treated vs. control xenografts within the indicated clusters (see Fig. 5A for unsupervised clustering). Hallmarks (rows) are grouped by semantic similarity. Columns are ordered by decreasing 126High expression. Non-significant enrichment results are plotted in light grey (Benjamini–Hochberg adjusted p-value > 0.1). H Same as G but for senescence-associated gene signatures. I Percent of day 8 EdU-incorporating BM blasts within sorted GFPhigh or GFPlow AML cells from treated PDX. n = 16 PDX from 3 patients over 3 independent experiments. Comparisons between paired groups were performed with the two-sided paired Wilcoxon test. For PT01 and PT03 (n ≤ 5 with a minimum two-sided p-value=0.0625), a bootstrap sampling-based nonparametric test was employed and p-values are marked in italics. n = 16 PDX from 3 patients over 3 independent experiments. Data are presented as mean ± SD. J Percent of G0 GFPlow/miR-126high blasts at baseline (B/L) or after in vivo chemotherapy (Treat). n and statistical comparisons and data presentation as per panel I. K Volcano plot of DEGs between treated vs. control in cluster 1 AML blasts. Top 12 genes by log2FC with increased expression in treated blasts are labelled (red). L Enrichment (right) or depletion (left) of LSC subclusters in treated AML compared to the average abundance of each cluster in control xenografts from the same donor. n = 35 PDX from 4 patients over 4 independent experiments. Standard Tukey boxplots: center line: median, box: interquartile range, whiskers: IQR*1.5. M Expression of top 10 marker genes for LSC subclusters 5′, 6′, 19′ and of HSC-latency-associated genes in LSC subclusters. Dot size reflects percentage of cells expressing the queried gene (columns), color scale represents relative gene expression within the subclusters (rows). N Longitudinal evaluation of AML engraftment within mice transplanted with PT16 AML blasts treated ex-vivo with an OxPhos inhibitor (IACS-010759) or solvent (Mock-treated). n = 6 PDX from 1 patient over 1 experiment. Source data are provided as a Source Data file.
Fig. 6
Fig. 6. miR-126high gene signature identifies a subset of chemotherapy-resilient LSCs enriched in refractory and relapsed AML.
A Mapping of 126High signature on UMAP plots of NPM1mut (top, n = 32,194 cells) or del(7) (bottom, n = 21,650 cells) AML cells at diagnosis. B Violin plots of 126High signature expression at diagnosis for each patient, colored by treatment response (dark red: primary refractory, orange: early relapse, green: persistent CR). Percent of cells with 126High > 0 are reported below each violin plot. C Kaplan–Meier plot for overall survival of AML patients within the training (GSE12417 n = 240 and GSE37642 n = 527 newly diagnosed AML patients) and testing (OSHU) gene expression datasets. Log rank test p-value and Cox’s proportional hazards model with lasso penalty hazard ratios (HR) with 95% confidence interval are reported. Red line: 126High signature > median; black line: 126High signature ≤ median. D Top-left: UMAP plot of LSC subclusters colored by unsupervised clustering at resolution = 0.6. Bottom-left: Violin plot of 126High module scores within LSC subclusters. Right: Density UMAP plot of LSCs at diagnosis grouped by outcome categories (green: persistent CR, orange: early relapse, dark red: primary refractory) or at sampled timepoints (diagnosis, Day 14 and Day 30). E Expression of the top 10 marker genes for LSC subcluster 6′ from the PDX scRNAseq dataset, HSC latency genes and 126High signature across NPM1mut AML LSC subclusters (0″, 1″, 2″ 3″, 4″ and 5″). Dot size represents the percentage of cells expressing the queried gene (columns), color scale represents relative gene expression within the subclusters (rows). F Same as E for del(7) AML LSC clusters (0, 1, 5, 9 and 10). G 126High signature module score distribution within a balanced pool of AML blasts at diagnosis from all non- refractory patients (non Ref. AML – DX), in paired DX-relapse (REL) -post-reinduction (REL NR) samples from PT08, in paired DX-REL samples from PT15 and in REL samples from PT19 and PT20. H Predicted cell cycle phase distribution within sequenced AML blasts grouped by 126High signature expression (126High > 0 POS, 126High ≤ 0 NEG) in DX, REL or REL NR samples from the indicated patients. I GSEA on DEG between REL and DX (left) or REL NR and REL (right) in NPM1mut AML blasts assigned to the indicated clusters (cl., see for unsupervised clustering). The tile plot shows the normalized enrichment scores (NES), where rows are hallmark terms and columns represent single-cluster, single-patient comparisons between the specified timepoints. Hallmarks (rows) are grouped by semantic similarity. Columns are grouped by cluster phenotype (P, progenitor blasts; E, erythroid-like; C, cycling; M, myelo/monoblasts) and timepoint. Non-significant enrichment results are plotted in light grey (adjusted p > 0.1). J Top: UMAP density projection of blasts at relapse (blue) or diagnosis (grey) on the NPM1mut AML landscape for PT15. Bottom: UMAP density projection of blasts at relapse (blue), relapse refractory to reinduction (dark blue), or diagnosis (grey) on the NPM1mut AML landscape for PT08.

References

    1. SEER Cancer stat facts; Acute Myeloid Leukemia. SEER 18 2009-2015 data. Available at: https://seer.cancer.gov/statfacts/html/amyl.html (Accessed 10 August 2020)
    1. Breems DA, et al. Prognostic index for adult patients with acute myeloid leukemia in first relapse. J. Clin. Oncol. 2005;23:1969–78. doi: 10.1200/JCO.2005.06.027. - DOI - PubMed
    1. Thomas D, Majeti R. Biology and relevance of human acute myeloid leukemia stem cells. Blood. 2017;129:1577–1585. doi: 10.1182/blood-2016-10-696054. - DOI - PMC - PubMed
    1. Toffalori C, et al. Immune signature drives leukemia escape and relapse after hematopoietic cell transplantation. Nat. Med. 2019;25:603–611. doi: 10.1038/s41591-019-0400-z. - DOI - PubMed
    1. Garg M, et al. Profiling of somatic mutations in acute myeloid leukemia with FLT3-ITD at diagnosis and relapse. Blood. 2015;126:2491–501. doi: 10.1182/blood-2015-05-646240. - DOI - PMC - PubMed

Publication types

MeSH terms