. 2023 Mar 8;13(1):3902.
doi: 10.1038/s41598-023-30797-4.

3-Hydroxy-3-methylglutaryl coenzyme A reductase genes from Glycine max regulate plant growth and isoprenoid biosynthesis

Affiliations

3-Hydroxy-3-methylglutaryl coenzyme A reductase genes from Glycine max regulate plant growth and isoprenoid biosynthesis

Shuai Wang et al. Sci Rep. .

Abstract

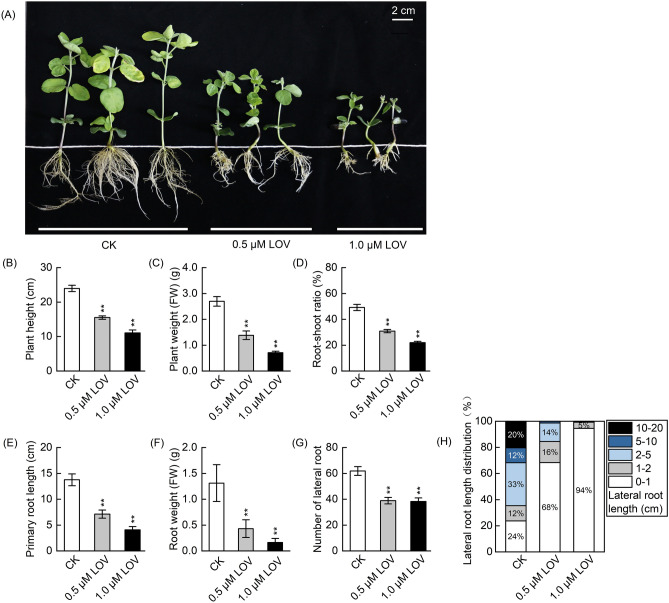
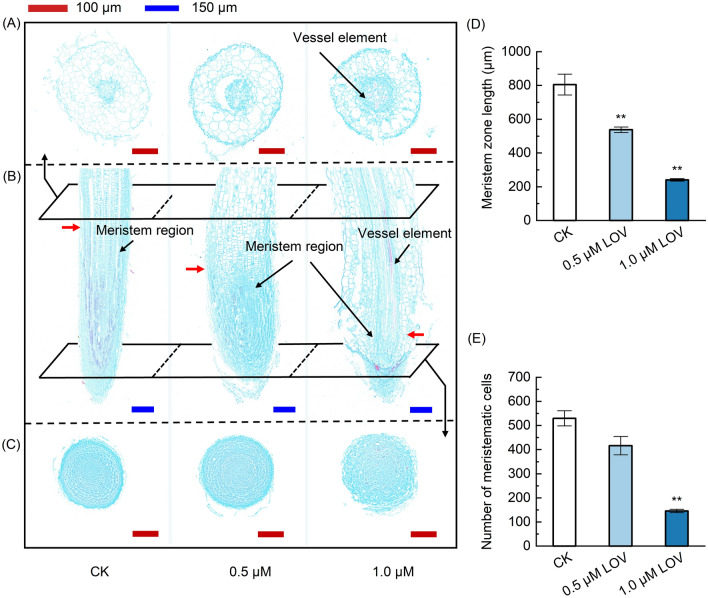
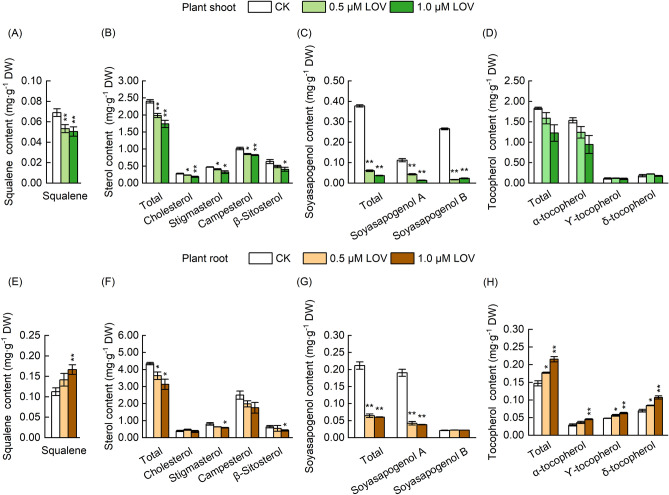
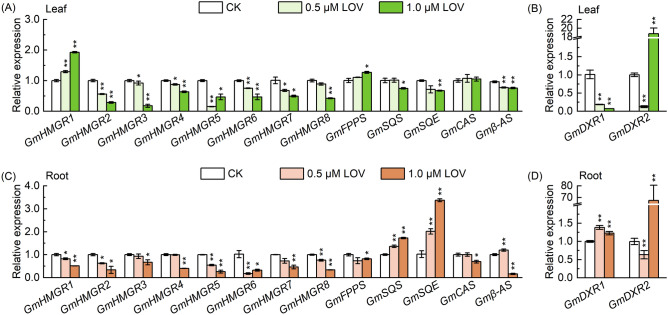
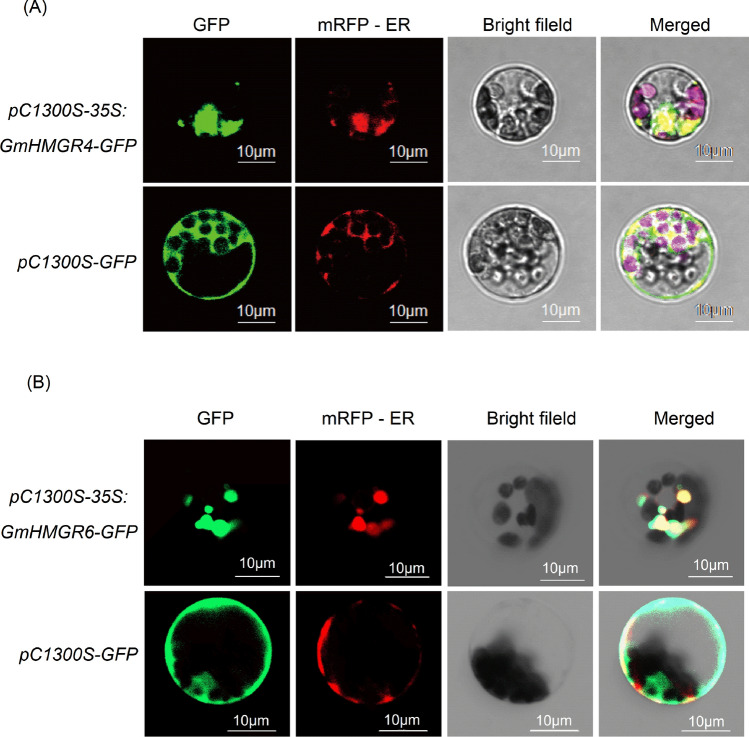
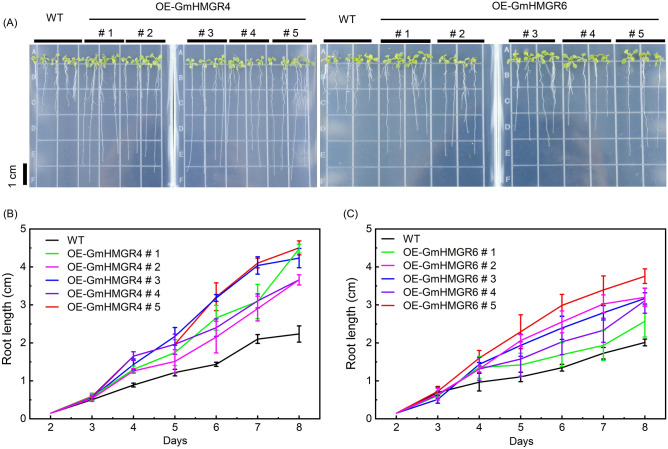
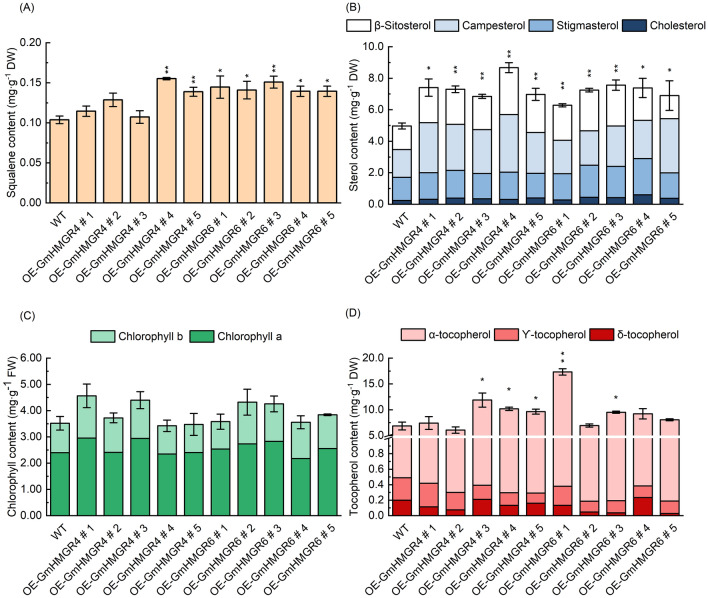
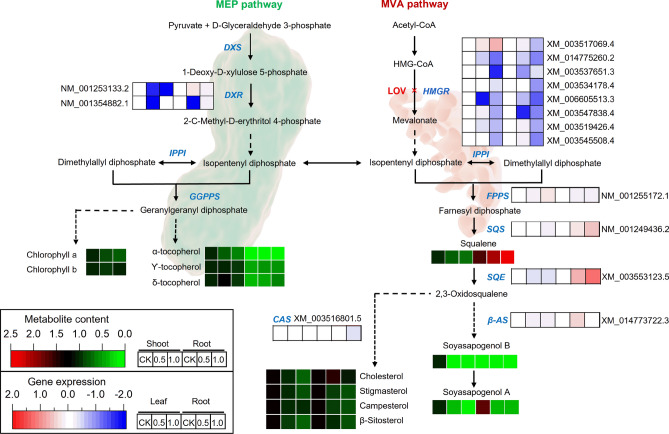
Isoprenoids, a large kind of plant natural products, are synthesized by the mevalonate (MVA) pathway in the cytoplasm and the 2-C-methyl-D-erythritol 4-phosphate (MEP) pathway in plastids. As one of the rate-limiting enzymes in the MVA pathway of soybean (Glycine max), 3-hydroxy-3-methylglutaryl coenzyme A reductase (HMGR) is encoded by eight isogenes (GmHMGR1-GmHMGR8). To begin, we used lovastatin (LOV), a specific inhibitor of GmHMGR, to investigate their role in soybean development. To further investigate, we overexpressed the GmHMGR4 and GmHMGR6 genes in Arabidopsis thaliana. The growth of soybean seedlings, especially the development of lateral roots, was inhibited after LOV treatment, accompanied by a decrease in sterols content and GmHMGR gene expression. After the overexpression of GmHMGR4 and GmHMGR6 in A. thaliana, the primary root length was higher than the wild type, and total sterol and squalene contents were significantly increased. In addition, we detected a significant increase in the product tocopherol from the MEP pathway. These results further support the fact that GmHMGR1-GmHMGR8 play a key role in soybean development and isoprenoid biosynthesis.


Conflict of interest statement

The authors declare no competing interests.

Figures

Figure 1
Figure 1
Docking analysis of GmHMGR proteins binding with LOV. (A) The docking binding energies of GmHMGR proteins with HMG-CoA and LOV. (B) Docking analysis visualization of GmHMGR binding with LOV. Amino acids that form hydrogen bonds are identified in purple while hydrogen bonds are shown in yellow.
Figure 2
Figure 2
Effect of LOV on the growth of soybean seedlings. (A) Images of soybean seedlings after LOV treatment. (B) Plant height, (C) plant weight (FW), (D) root-shoot ratio, (E) primary root length, (F) root weight (FW), and (G) the number of lateral roots of soybean seedlings after LOV treatment and corresponding blank control (CK). Values are means ± standard error (n = 10); the symbol * denotes significant difference from CK at p < 0.05; ** at p < 0.01 by Student’s t-tests. (H) Differences in lateral root length distribution of soybean seedlings after LOV treatment and corresponding CK. Counting lateral roots in soybean seedlings (n > 15) per LOV treatment.
Figure 3
Figure 3
Effect of LOV on the lateral root apical meristem zone of soybean seedlings. Micrographs (A) and (C) show demonstrate transverse sections, and (B) longitudinal sections. Fast green FCF and safranin O were used to stain the sections. The lignified or corkified cell wall and vessel element will be dyed red and other tissues will be dyed green. Red scale bars = 100 μm, Blue scale bars = 150 μm. The red arrowhead indicates the upper boundary of the meristem zone. (D) The effect of LOV on the length of the apical meristematic zone and (E) the number of meristematic cells. The data represent the mean ± SE of three biological replicates. Symbol * denotes significant difference from CK at p < 0.05; ** at p < 0.01 by Student’s t-tests.
Figure 4
Figure 4
Content changes of isoprenoids in LOV-treated soybean seedlings. (A) Content changes of squalene, (B) sterols, (C) soyasapogenol, and (D) tocopherols in plant shoot after LOV treatment. (E) Content changes of squalene, (F) sterols, (G) soyasapogenol, and (H) tocopherols in LOV-treated plant root. The data represent the mean ± SE of three biological replicates; the symbol * denotes significant difference from CK at p < 0.05; ** at p < 0.01 by Student’s t-tests.
Figure 5
Figure 5
Expression changes of MVA and MEP pathways-related genes in LOV-treated soybean seedlings. (A) Transcript levels of HMGR (GmHMGR1-8), Farnesyl diphosphate synthase (GmFPPS), Squalene synthase(GmSQS), Squalene epoxidase (GmSQE), Cycloartenol synthase (GmCAS), β-amyrin synthase (Gmβ-AS), 1-Deoxy-D-xylulose 5-phosphate reductoisomerase (GmDXR) in soybean leaves; (C) and (D) Transcript levels in soybean roots. The data represent the mean ± SE of three biological replicates; the symbol * denotes significant difference from CK at p < 0.05; ** at p < 0.01 by Student’s t-tests.
Figure 6
Figure 6
Subcellular localization of (A) GmHMGR4 and (B) GmHMGR6 proteins in A. thaliana protoplasts. Green fluorescence indicates a fusion protein signal for pC1300S-35S:GmHMGR4-GFP and pC1300S-35S:GmHMGR6-GFP. The red signal indicates mRFP-ER (Endoplasmic reticulum protein marker fused with mRFP) fluorescence. GFP and mRFP-ER fluorescence images were digitally combined to get the merged images.
Figure 7
Figure 7
A. thaliana primary root growth during an 8-day period for the WT, OE-GmHMGR4s and OE-GmHMGR6s. (A) Growth phenotypes of A. thaliana grown for 8 days in a vertically placed MS medium. (B) and (C) Changes in root length between WT and transgenic A. thaliana. WT: wild type, n ≥ 15 roots per overexpression strain.
Figure 8
Figure 8
Content changes of squalene, sterols, chlorophyll, and tocopherol in overexpressed A. thaliana lines. (A) HPLC analysis of squalene content (mg·g−1, DW) in A. thaliana. (B) HPLC analysis of sterol content (mg∙g−1, DW) in A. thaliana, different colors represent β-sitosterol, campesterol, stigmasterol, and cholesterol. (C) Chlorophyll a and b content in leaves of A. thaliana (mg∙g−1, FW). (D) HPLC analysis of tocopherol content (mg∙g−1 DW), different colors represent α-tocopherol, ϒ-tocopherol, and δ-tocopherol. The data represent the mean ± SE of three biological replicates; the symbol * denotes significant difference from wild type (WT) at p < 0.05; ** at p < 0.01 by Student’s t-tests.
Figure 9
Figure 9
Inhibition of HMGR alters gene expression levels and isoprenoid biosynthesis in the MVA and MEP pathways of soybean. Some important isoprene compounds were indicated in black fonts, and the key enzyme genes were indicated in blue italic fonts. Red and green scales show the change in isoprenoids content compared with CK, the data was calculated based on the isoprenoids content of the shoot. Upregulated isoprenoids were marked in red, and reduced isoprenoids were displayed in green. A light red and blue color scale depict gene expression in comparison to CK. Upregulated genes are shown in light red, and downregulated genes are shown in blue. Enzyme abbreviations: DXS: 1-Deoxy-d-xylulose 5-phosphate synthase; DXR: 1-Deoxy-d-xylulose 5-phosphate reductoisomerase; IPPI: isopentenyl diphosphate ∆-isomerase; GGPPS: geranylgeranyl diphosphate synthase; FPPS: farnesyl diphosphate synthase; SQS: squalene synthase; SQE: squalene epoxidase; CAS: cycloartenol synthase; β-AS: β-amyrin synthase.

References

    1. Jin HN, Song ZH, Nikolau BJ. Reverse genetic characterization of two paralogous acetoacetyl CoA thiolase genes in Arabidopsis reveals their importance in plant growth and development. Plant J. 2012;70:1015–1032. doi: 10.1111/j.1365-313X.2012.04942.x. - DOI - PubMed
    1. Liao P, et al. Transgenic tobacco overexpressing Brassica juncea HMG-CoA synthase 1 shows increased plant growth, pod size and seed yield. PLoS ONE. 2014;9:e98264. doi: 10.1371/journal.pone.0098264. - DOI - PMC - PubMed
    1. Kevei Z, et al. 3-hydroxy-3-methylglutaryl coenzyme a reductase1 interacts with NORK and is crucial for nodulation in Medicago truncatula. Plant Cell. 2007;19:3974–3989. doi: 10.1105/tpc.107.053975. - DOI - PMC - PubMed
    1. Suzuki M, et al. Loss of function of 3-hydroxy-3-methylglutaryl coenzyme A reductase 1 (HMG1) in Arabidopsis leads to dwarfing, early senescence and male sterility, and reduced sterol levels. Plant J. 2004;37:750–761. doi: 10.1111/j.1365-313X.2004.02003.x. - DOI - PubMed
    1. Wang H, et al. Overexpression of Brassica juncea wild-type and mutant HMG-CoA synthase 1 in Arabidopsis up-regulates genes in sterol biosynthesis and enhances sterol production and stress tolerance. Plant Biotechnol. J. 2012;10:31–42. doi: 10.1111/j.1467-7652.2011.00631.x. - DOI - PubMed

Publication types

MeSH terms