. 2023 Mar 8;14(1):999.
doi: 10.1038/s41467-023-35908-3.

Tyrosyl-tRNA synthetase has a noncanonical function in actin bundling

Affiliations

Tyrosyl-tRNA synthetase has a noncanonical function in actin bundling

Biljana Ermanoska et al. Nat Commun. .

Abstract

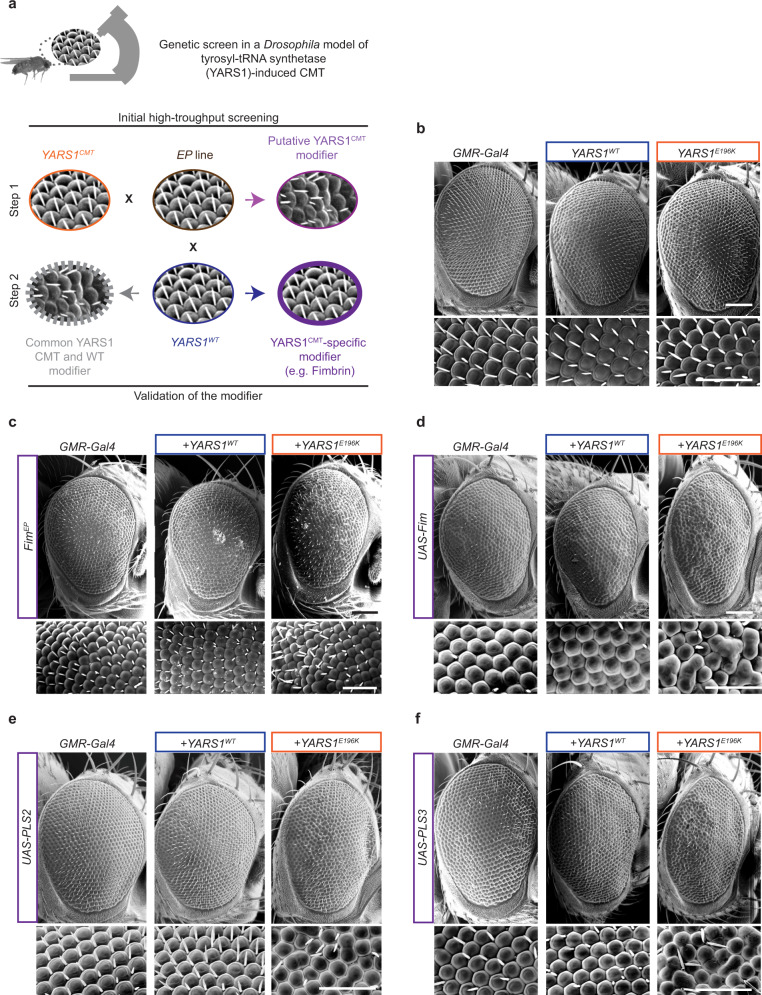
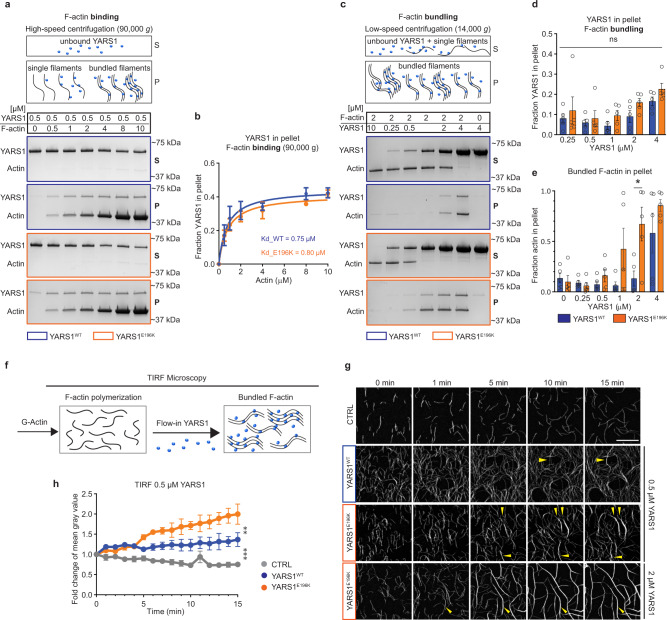
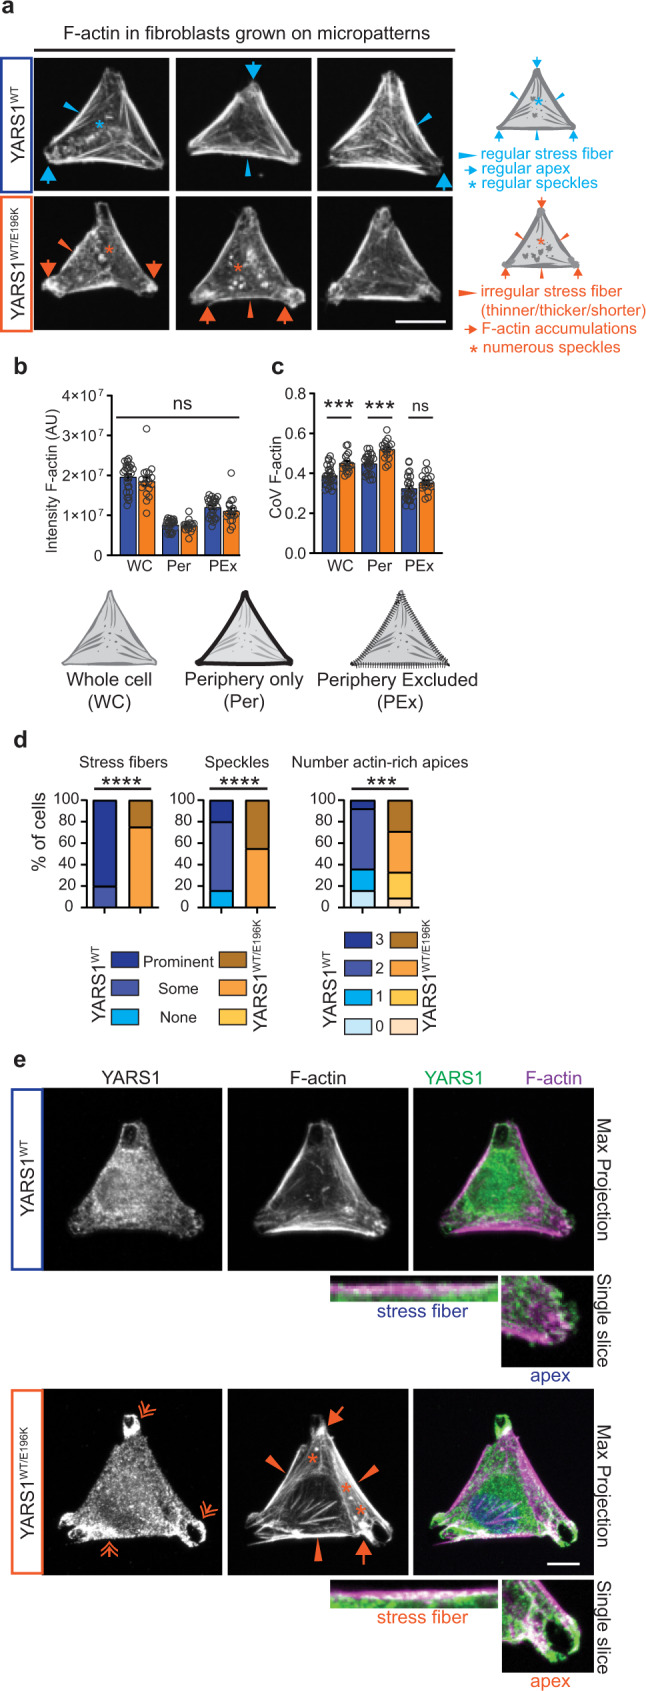
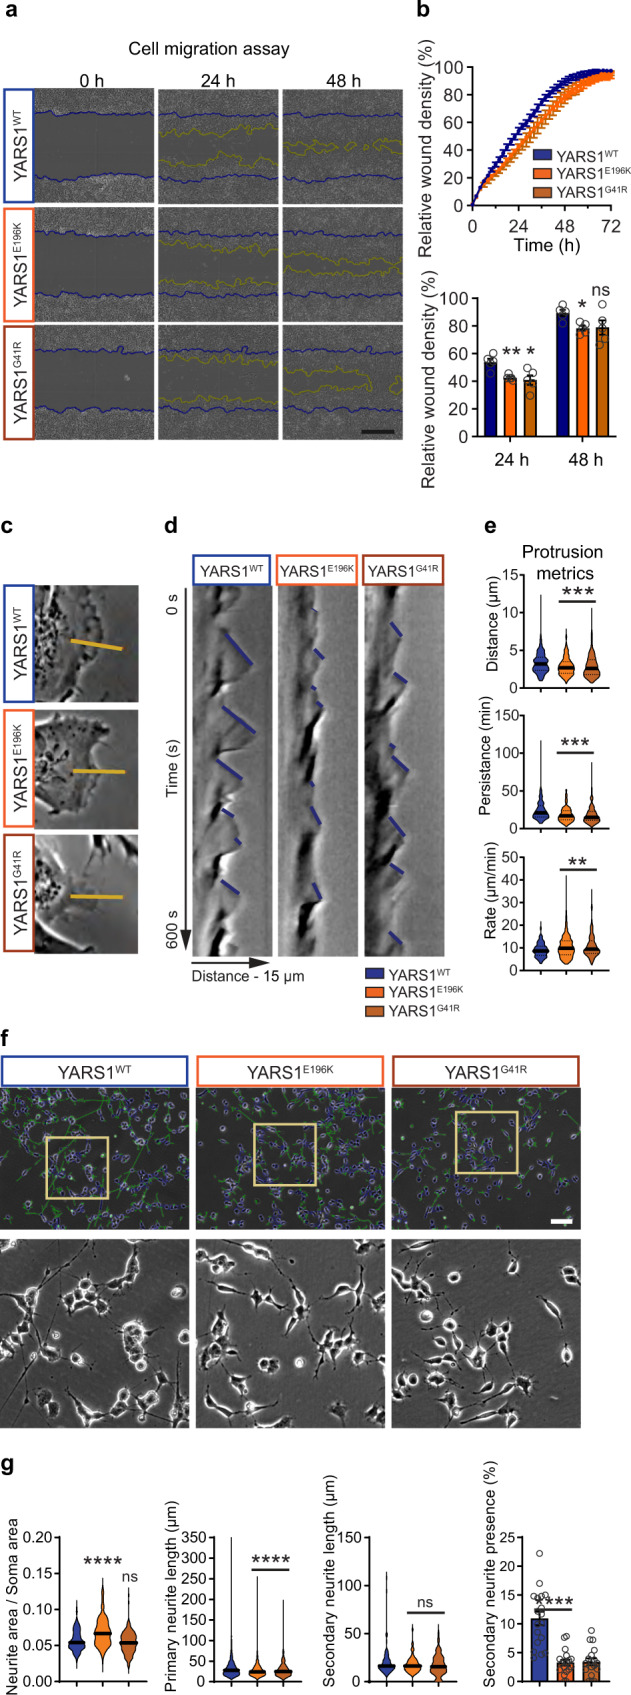
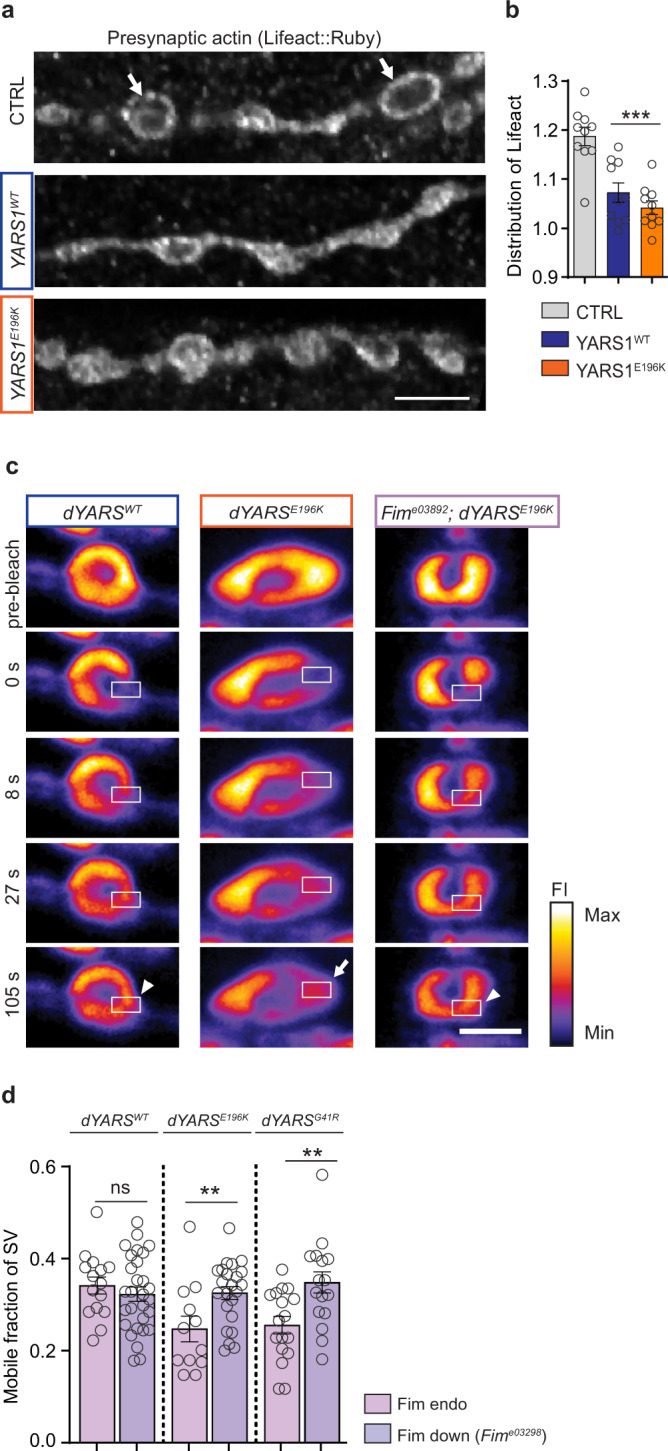
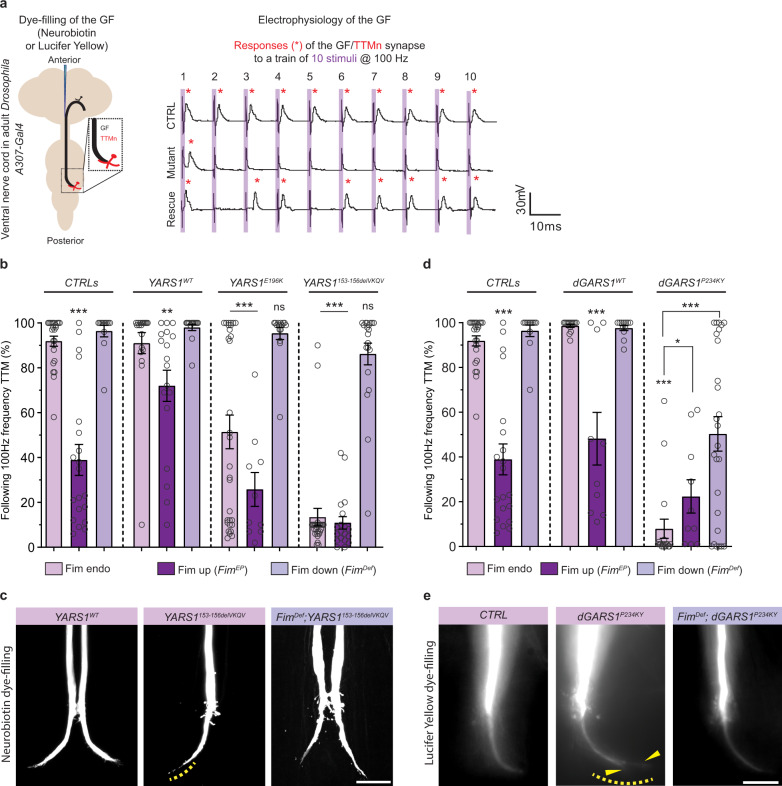
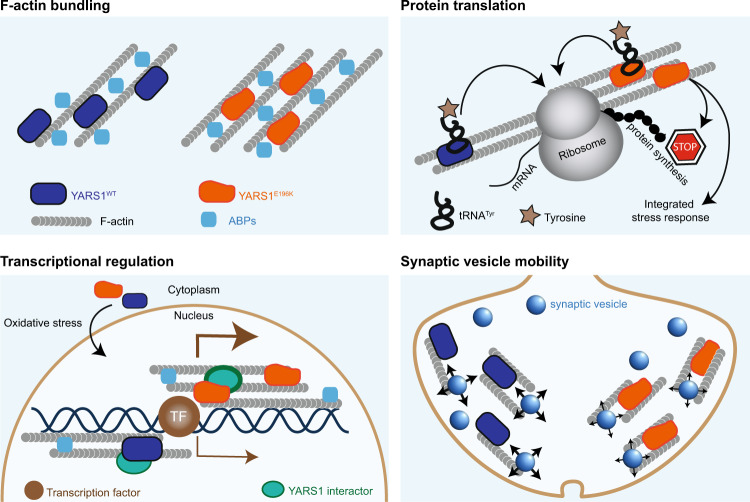
Dominant mutations in tyrosyl-tRNA synthetase (YARS1) and six other tRNA ligases cause Charcot-Marie-Tooth peripheral neuropathy (CMT). Loss of aminoacylation is not required for their pathogenicity, suggesting a gain-of-function disease mechanism. By an unbiased genetic screen in Drosophila, we link YARS1 dysfunction to actin cytoskeleton organization. Biochemical studies uncover yet unknown actin-bundling property of YARS1 to be enhanced by a CMT mutation, leading to actin disorganization in the Drosophila nervous system, human SH-SY5Y neuroblastoma cells, and patient-derived fibroblasts. Genetic modulation of F-actin organization improves hallmark electrophysiological and morphological features in neurons of flies expressing CMT-causing YARS1 mutations. Similar beneficial effects are observed in flies expressing a neuropathy-causing glycyl-tRNA synthetase. Hence, in this work, we show that YARS1 is an evolutionary-conserved F-actin organizer which links the actin cytoskeleton to tRNA-synthetase-induced neurodegeneration.


Conflict of interest statement

The authors declare no competing interests.

Figures

Fig. 1
Fig. 1. A genetic screen in Drosophila identified actin cytoskeleton-related YARS1CMT interactors.
a A schematic representation of the principles of a genetic screen in which ommatidial disorganization of eyes in adult fruit flies was used as readout. GMR-Gal4 > YARS1CMT expressing flies (orange) were crossed to individual EP lines (brown). Genuine YARS1CMT modifier (purple) would induce disorganized ommatidia only in the mutant background and will not have an effect when crossed to YARS1WT-expressing flies in a validation step (blue). See also a detailed description in the Methods. Scanning electron micrographs of adult fly eyes in b controls, and c upon co-expression of FimEP. Assessment of interaction with transgenic UAS-Fim (d), and the human orthologs UAS-PLS2 (e) and UAS-PLS3 (f) with YARS1WT or YARS1E196K. The experiments were repeated at least three independent times with similar outcomes. Scale bars – 50 μm.
Fig. 2
Fig. 2. YARS1 binds to F-actin and organizes actin filaments in vitro.
a Coomassie-stained gels of supernatant (S) and pellet (P) fractions from high-speed pelleting (see schematic) of 0.5 µM YARS1WT or YARS1E196K upon increasing F-actin concentrations. b Graphical representation of the YARS1 fraction in the pellet obtained in three independent experiments, fitted into Michaelis-Menten nonlinear curve. c F-actin bundling capacity of YARS1 proteins tested upon low-speed pelleting (see schematic) of increasing concentrations of YARS1 and preassembled 2 µM F-actin. Graphs in d and e show the fraction of bundled F-actin and YARS1 in the pellets from five independent experiments; error bars in b, d, and e—SEM; *p = 0.0187, two-sided unpaired t test. Supernatant and pellet samples derive from the same experiment and gels were processed in parallel. f A schematic representation of the TIRF experiment. g Representative time-lapse images from a TIRF microscopy movie of 10% OG-actin labeled filaments alone (CTRL) or in the presence of YARS1 demonstrate stronger bundling capacity of YARS1E196K at 0.5 µM (areas of bundle formation depicted with yellow arrowhead) and pronounced cable formation at 2 µM. h Graph representing the fold change of mean gray value of OG-actin in control and upon flow-in of 0.5 µM YARS1, measured in areas of cable formation. n = 3 represents randomly selected, non-overlapping fields of view, imaged within one TIRF experiment per condition (CTRL, YARS1WT, and YARS1E196K). Presented data derive from one of two independently performed experiments. Error bars—SD; **p = 0.0011, ***p = 0.0003, two-sided unpaired t-test. Source data are provided as a Source data file.
Fig. 3
Fig. 3. Actin cytoskeleton organization is perturbed in YARS1CMT fibroblasts.
a Fibroblasts from a control individual (YARS1WT/WT) and a CMT patient (YARS1WT/E196K), plated on fibronectin-coated Y-shaped micropatterns, adopt a triangular shape. F-actin, stained with fluorescently labeled phalloidin, is organized into linear stress fibers at the periphery (blue arrowheads) or crossing the center of cells, and branched structures at the cell apices (blue arrows). Dysregulated stress fibers (orange arrowheads), F-actin accumulations at the cell apices (orange arrows), and speckled accumulations (orange asterisk) are observed in CMT fibroblasts. A schematic of a representative cell with a description of the F-actin structures is shown on the right side of the micrographs. b Quantification of the fluorescence intensity, and c coefficient of variation (CoV) of the F-actin signal in the whole triangle-shaped cell, and in cellular regions limited to the stress fiber-occupied periphery or excluding it. d Frequency of actin-related phenotypes in control and CMT fibroblasts. In b, c, and d, n = 25 (Control) and n = 17 (YARS1E196K) cells from one experiment out of two independently performed experiments. e Maximum intensity projections of confocal images of immunolabeled YARS1 (green) and phalloidin-labeled F-actin (magenta) from control and mutant fibroblasts. Single slice insets of a stress fiber and an apex in the studied fibroblasts. The experiments were repeated two times with similar outcomes. Scale bars – 20 μm. Data in b and c are presented as mean values ± SEM and analyzed by two-sided unpaired t test with ns – non-significant p = 0.3035 in b, p = 0.1080 in c; ***p = 0.0006. After a Chi-square test in d, ***p = 0.005, ****p < 0.0005. Source data are provided as a Source data file.
Fig. 4
Fig. 4. CMT-causing YARS1 mutations disrupt cell migration, protrusion dynamics, and neurite outgrowth in SH-SY5Y cells.
a Phase-contrast time course imaging of a scratch closure after a mechanical wound induction in a confluent culture of undifferentiated SH-SY5Y cells stably expressing either YARS1WT, YARS1E196K, or YARS1G41R. Yellow lines indicate the migration front at the specific time point while blue lines show the initial position of the wound. Scale bar – 400 µm. b Quantifications of the cell density at the scratch over the time course of 80 h and at specific time points (24 h and 48 h); n = 5 independent measurements, averaged from 10-16 individual scratch wounds, taken every 2 h. Data in the bar graph in b presented as mean values ± SEM; at 24 h – ns – non-significant (p > 0.9999), *p = 0.0317, **p = 0.0079; at 48 h – ns – non-significant (p = 0.2222), *p = 0.0159. c Phase-contrast image sequences (10 fps for 10 min) of individual lamellipodia used to generate kymographs from 15 µm line segments (yellow lines) perpendicular to the lamellipodia movement direction. d Representative kymographs from YARS1WT and YARS1CMT individual lamellipodia, used to determine the protrusion displacement (micrometers on the x axis), protrusion persistence (time in seconds on the y axis), and the protrusion rate (displacement to persistence ratio). e Graph representing the protrusion metrics calculated from the kymographs. Violin plots represent at least 185 individual protrusions per genotype. After a two-sided Mann-Whitney U test for wound distance ***p = 0.0004 and p = 0.0002 for YARS1E196K and YARS1G41R compared to YARS1WT, respectively; for wound persistence ****p < 0.0001; for wound rate – ns – non-significant (p = 0.7920), **p = 0.0077 and p = 0.0028 for YARS1E196K and YARS1G41R compared to YARS1WT, respectively. f Representative phase-contrast images of differentiated SH-SY5Y cells stably expressing YARS1WT, YARS1E196K or YARS1G41R, on which neurite outgrowth and branching were analyzed; blue traces delineate soma, green traces mark projections (primary neurites and their secondary branches). g Quantifications of projections’ metrics in YARS1WT, YARS1E196K and YARS1G41R cells. For neurite/soma area ratio, n = 144 random image fields for each genotype. Primary neurite length determined on n = 2342 (YARS1WT), 1944 (YARS1E196K), and 1723 (YARS1G41R) individual cells from at least three independent differentiations. Secondary neurite length, n = 65 individual cells for each genotype. Percentage of secondary neurite presence (presented as mean values ± SEM), n = 18 random image fields for each genotype. Median and quartiles on the violin plots are indicated by thick and thin black lines, respectively. ns – non-significant, ****p < 0.0001; after a two-sided Mann-Whitney U test. Scale bar – 100 µm. Source data are provided as a Source data file.
Fig. 5
Fig. 5. Characterization of YARS1CMT-induced defects at the Drosophila larval NMJ by genetic modulation of the actin-bundling protein Fim.
a Neuronal expression of YARS1 rearranges presynaptic F-actin (Lifeact::Ruby) from the bouton border proximity (arrows) inwards. Scale bar – 5 µm. b Quantification of the Lifeact::Ruby signal redistribution, as detailed in the Methods and Supplementary Fig. 8a; n = 12 NMJs from six larvae per genotype; ***p = 0.0006 and p < 0.0001 for YARS1WT and YARS1E196K respectively after a two-sided unpaired t test. c FRAP image sequences of the SV marker Syt::eGFP co-expressed with dYARS1WT or dYARS1CMT. Scale bar – 2 µm. d The mobile fraction of synaptic vesicles, determined by FRAP of the Syt::eGFP signal, declines in dYARS1CMT compared to YARS1WT- expressing larval NMJs, and is restored in mutants with decreased Fim levels (Fime03892); n = 15, 29, 12, 23, 17 and 17 individual boutons (from left to right). Data in bar graphs are mean values ± SEM.. **p = 0.0064 and p = 0.0046 for dYARS1E196K and dYARS1G41R, respectively after a two-sided unpaired t test. Source data are provided as a Source data file.
Fig. 6
Fig. 6. Fim alters neuronal phenotypes in the giant fibers in YARS1 and GARS1 neuropathy Drosophila models.
a Evaluation of the giant fiber-tergotrochanteral motoneuron connection (GF/TTMn; other connections omitted for simplicity) in the ventral nerve cord of adult flies. Sample traces of a train stimulation and GF/TTMn recordings in controls, severely impaired YARS1CMT mutant (YARS1153-156delVKQV-expressing) and animals with improved GF/TTMn function in FimDef background. b Quantification of the ability of the GF/TTMn synapse to follow repetitive stimuli in control, YARS1WT and CMT mutant animals, in the background of endogenous-, increased- or decreased Fim expression; n = 24, 20, 12, 19, 18, 14, 30, 10, 15, 28, 19, and 20 (from left to right) giant fiber recordings from eight days-old female flies. **p < 0.01 and ***p < 0.001, one-way ANOVA with Bonferonni Multiple Comparison Test. c GF terminal morphology visualized by neurobiotin dye injection in YARS1WT, YARS1153-156delVKQV, and flies with improved GF/TTMn responses (FimDef; YARS1153-156delVKQV). Yellow dashed line depicts constrictions at the axonal terminal in the mutant. Scale bar – 20 µm. d The same electrophysiological paradigm was used to evaluate the ability of the GF/TTMn synapse to follow repetitive stimuli in control, GARSWT and GARSCMT– expressing animals, by changing the expression levels of Fim; n = 24, 20, 12, 14, 10, 12, 18, 10, and 26 (from left to right) giant fiber recordings from 8-day-old female flies; *p = 0.0159 and ***p < 0.001, by a two-sided Mann-Whitney test. Controls are reused in graph b and d. Data in b and d presented as mean values ± SEM. e GF terminal morphology visualized with lucifer yellow GF dye-filing in CTRL, GARS1CMT, and flies with improved GF/TTMn responses (FimDef; GARS1CMT). Yellow dashed line depicts the thin, irregular axonal terminal that splits in two (yellow arrowheads) in the mutant. Scale bar – 50 µm. Source data are provided as a Source data file.
Fig. 7
Fig. 7. Illustration of the known cellular processes implicated in YARS1CMT.
The enhanced F-actin bundling properties described for YARS1CMT in this study might contribute to global protein synthesis inhibition, activation of the integrated stress response, transcriptional disregulation, and impaired synaptic vesicle mobility.

References

    1. Rubio Gomez MA, Ibba M. Aminoacyl-tRNA synthetases. Rna. 2020 doi: 10.1261/rna.071720.119. - DOI - PMC - PubMed
    1. Wei N, Zhang Q, Yang XL. Neurodegenerative Charcot-Marie-Tooth disease as a case study to decipher novel functions of aminoacyl-tRNA synthetases. J. Biol. Chem. 2019;294:5321–5339. doi: 10.1074/jbc.REV118.002955. - DOI - PMC - PubMed
    1. Morant, L., Erfurth, M.-L. & Jordanova, A. Drosophila models for Charcot–Marie–Tooth neuropathy related to aminoacyl-tRNA synthetases. Genes12, 10.3390/genes12101519 (2021). - PMC - PubMed
    1. He J, et al. Heterozygous seryl-tRNA synthetase 1 variants cause Charcot-Marie-Tooth disease. Ann. Neurol. 2022 doi: 10.1002/ana.26501. - DOI - PubMed
    1. Barreto LC, et al. Epidemiologic study of Charcot-Marie-Tooth disease: a systematic review. Neuroepidemiology. 2016;46:157–165. doi: 10.1159/000443706. - DOI - PubMed

Publication types