. 2023 Mar;615(7952):507-516.
doi: 10.1038/s41586-023-05778-2. Epub 2023 Mar 8.

Co-opting signalling molecules enables logic-gated control of CAR T cells

Affiliations

Co-opting signalling molecules enables logic-gated control of CAR T cells

Aidan M Tousley et al. Nature. 2023 Mar.

Abstract

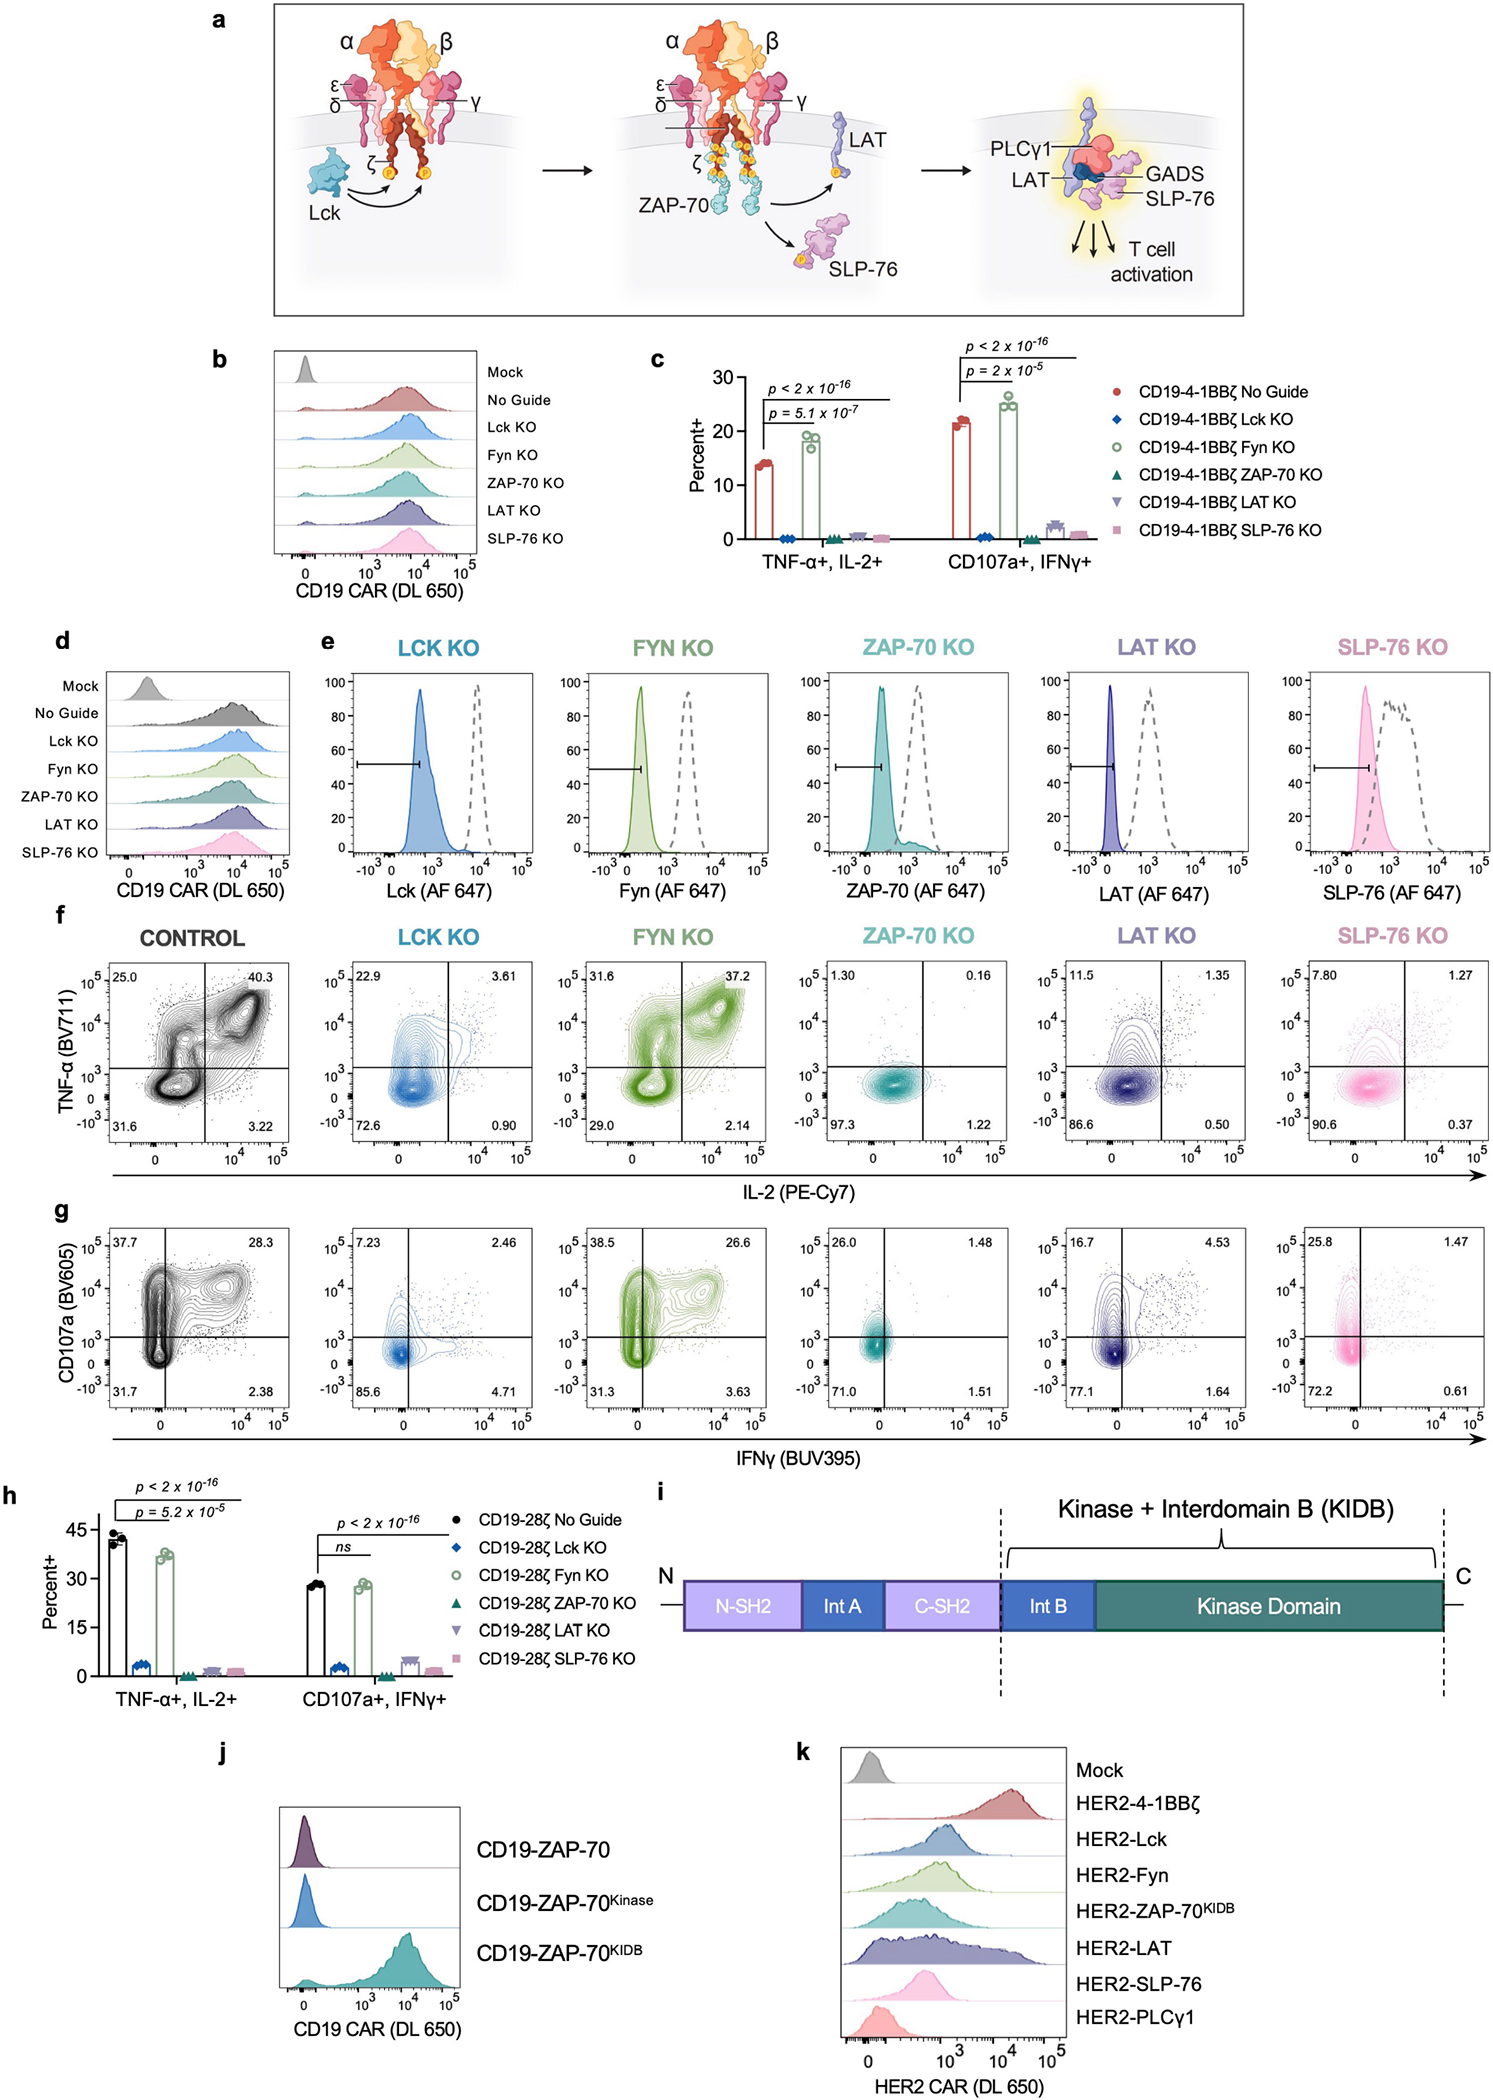
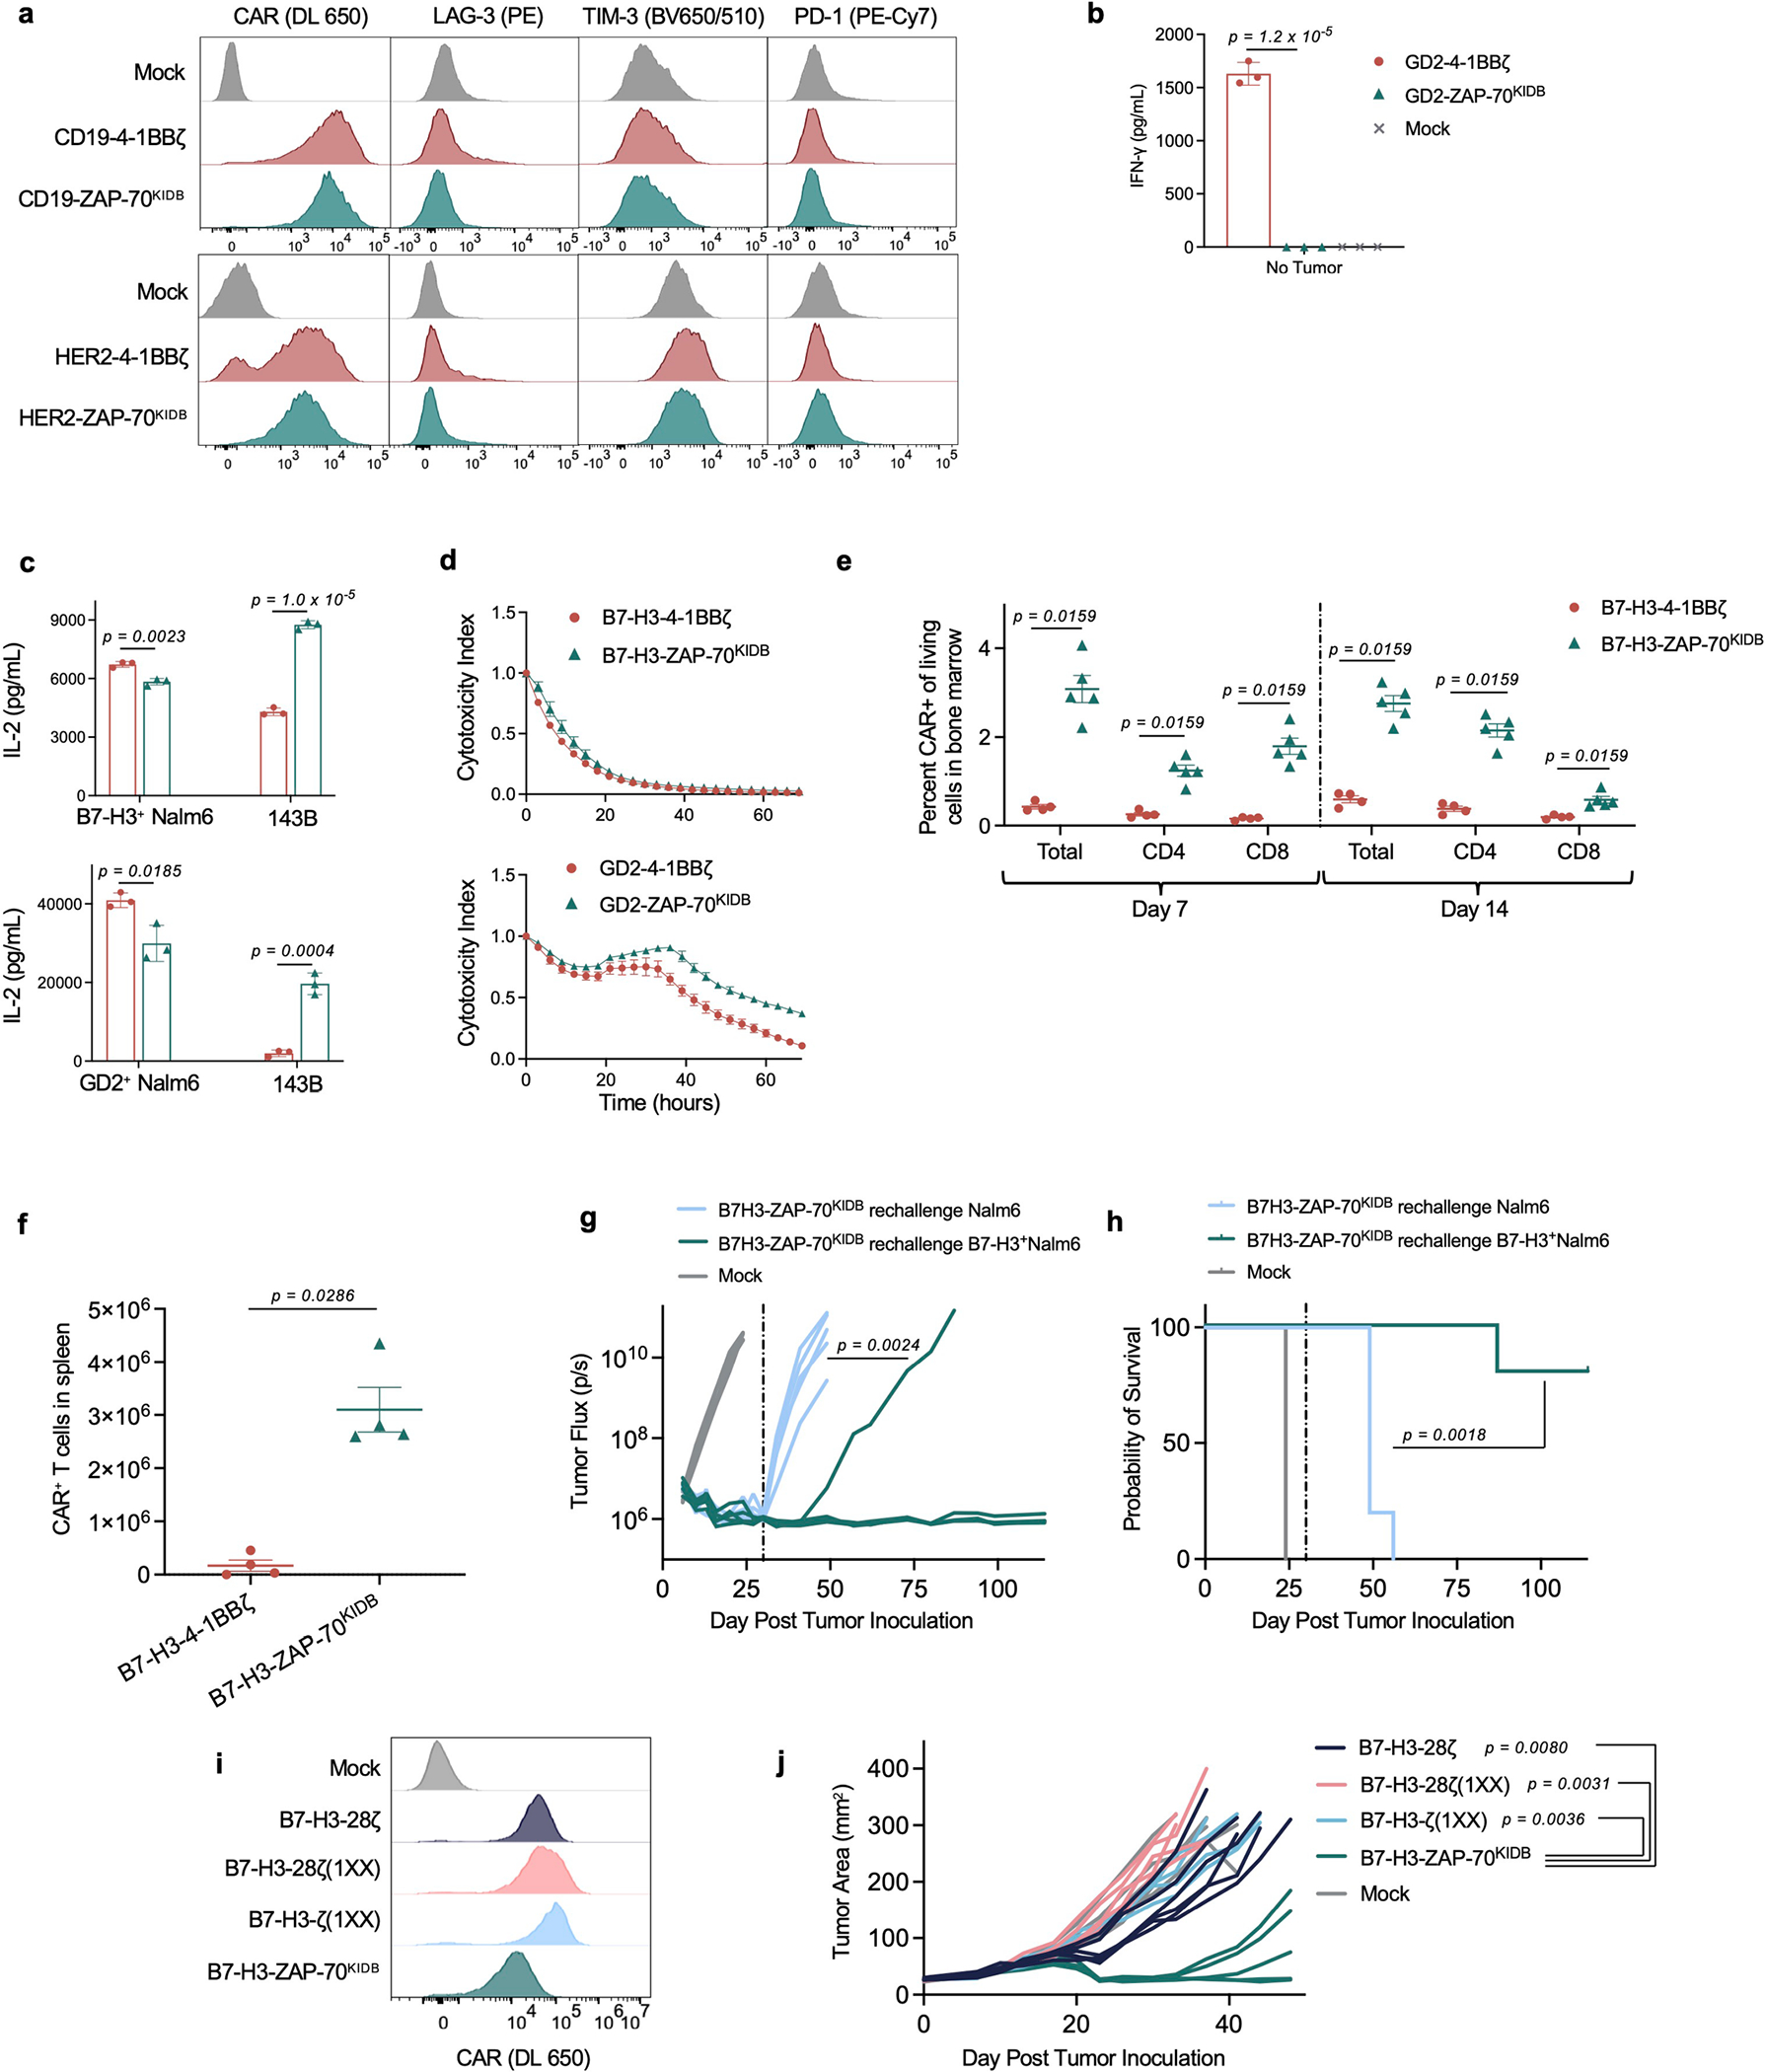
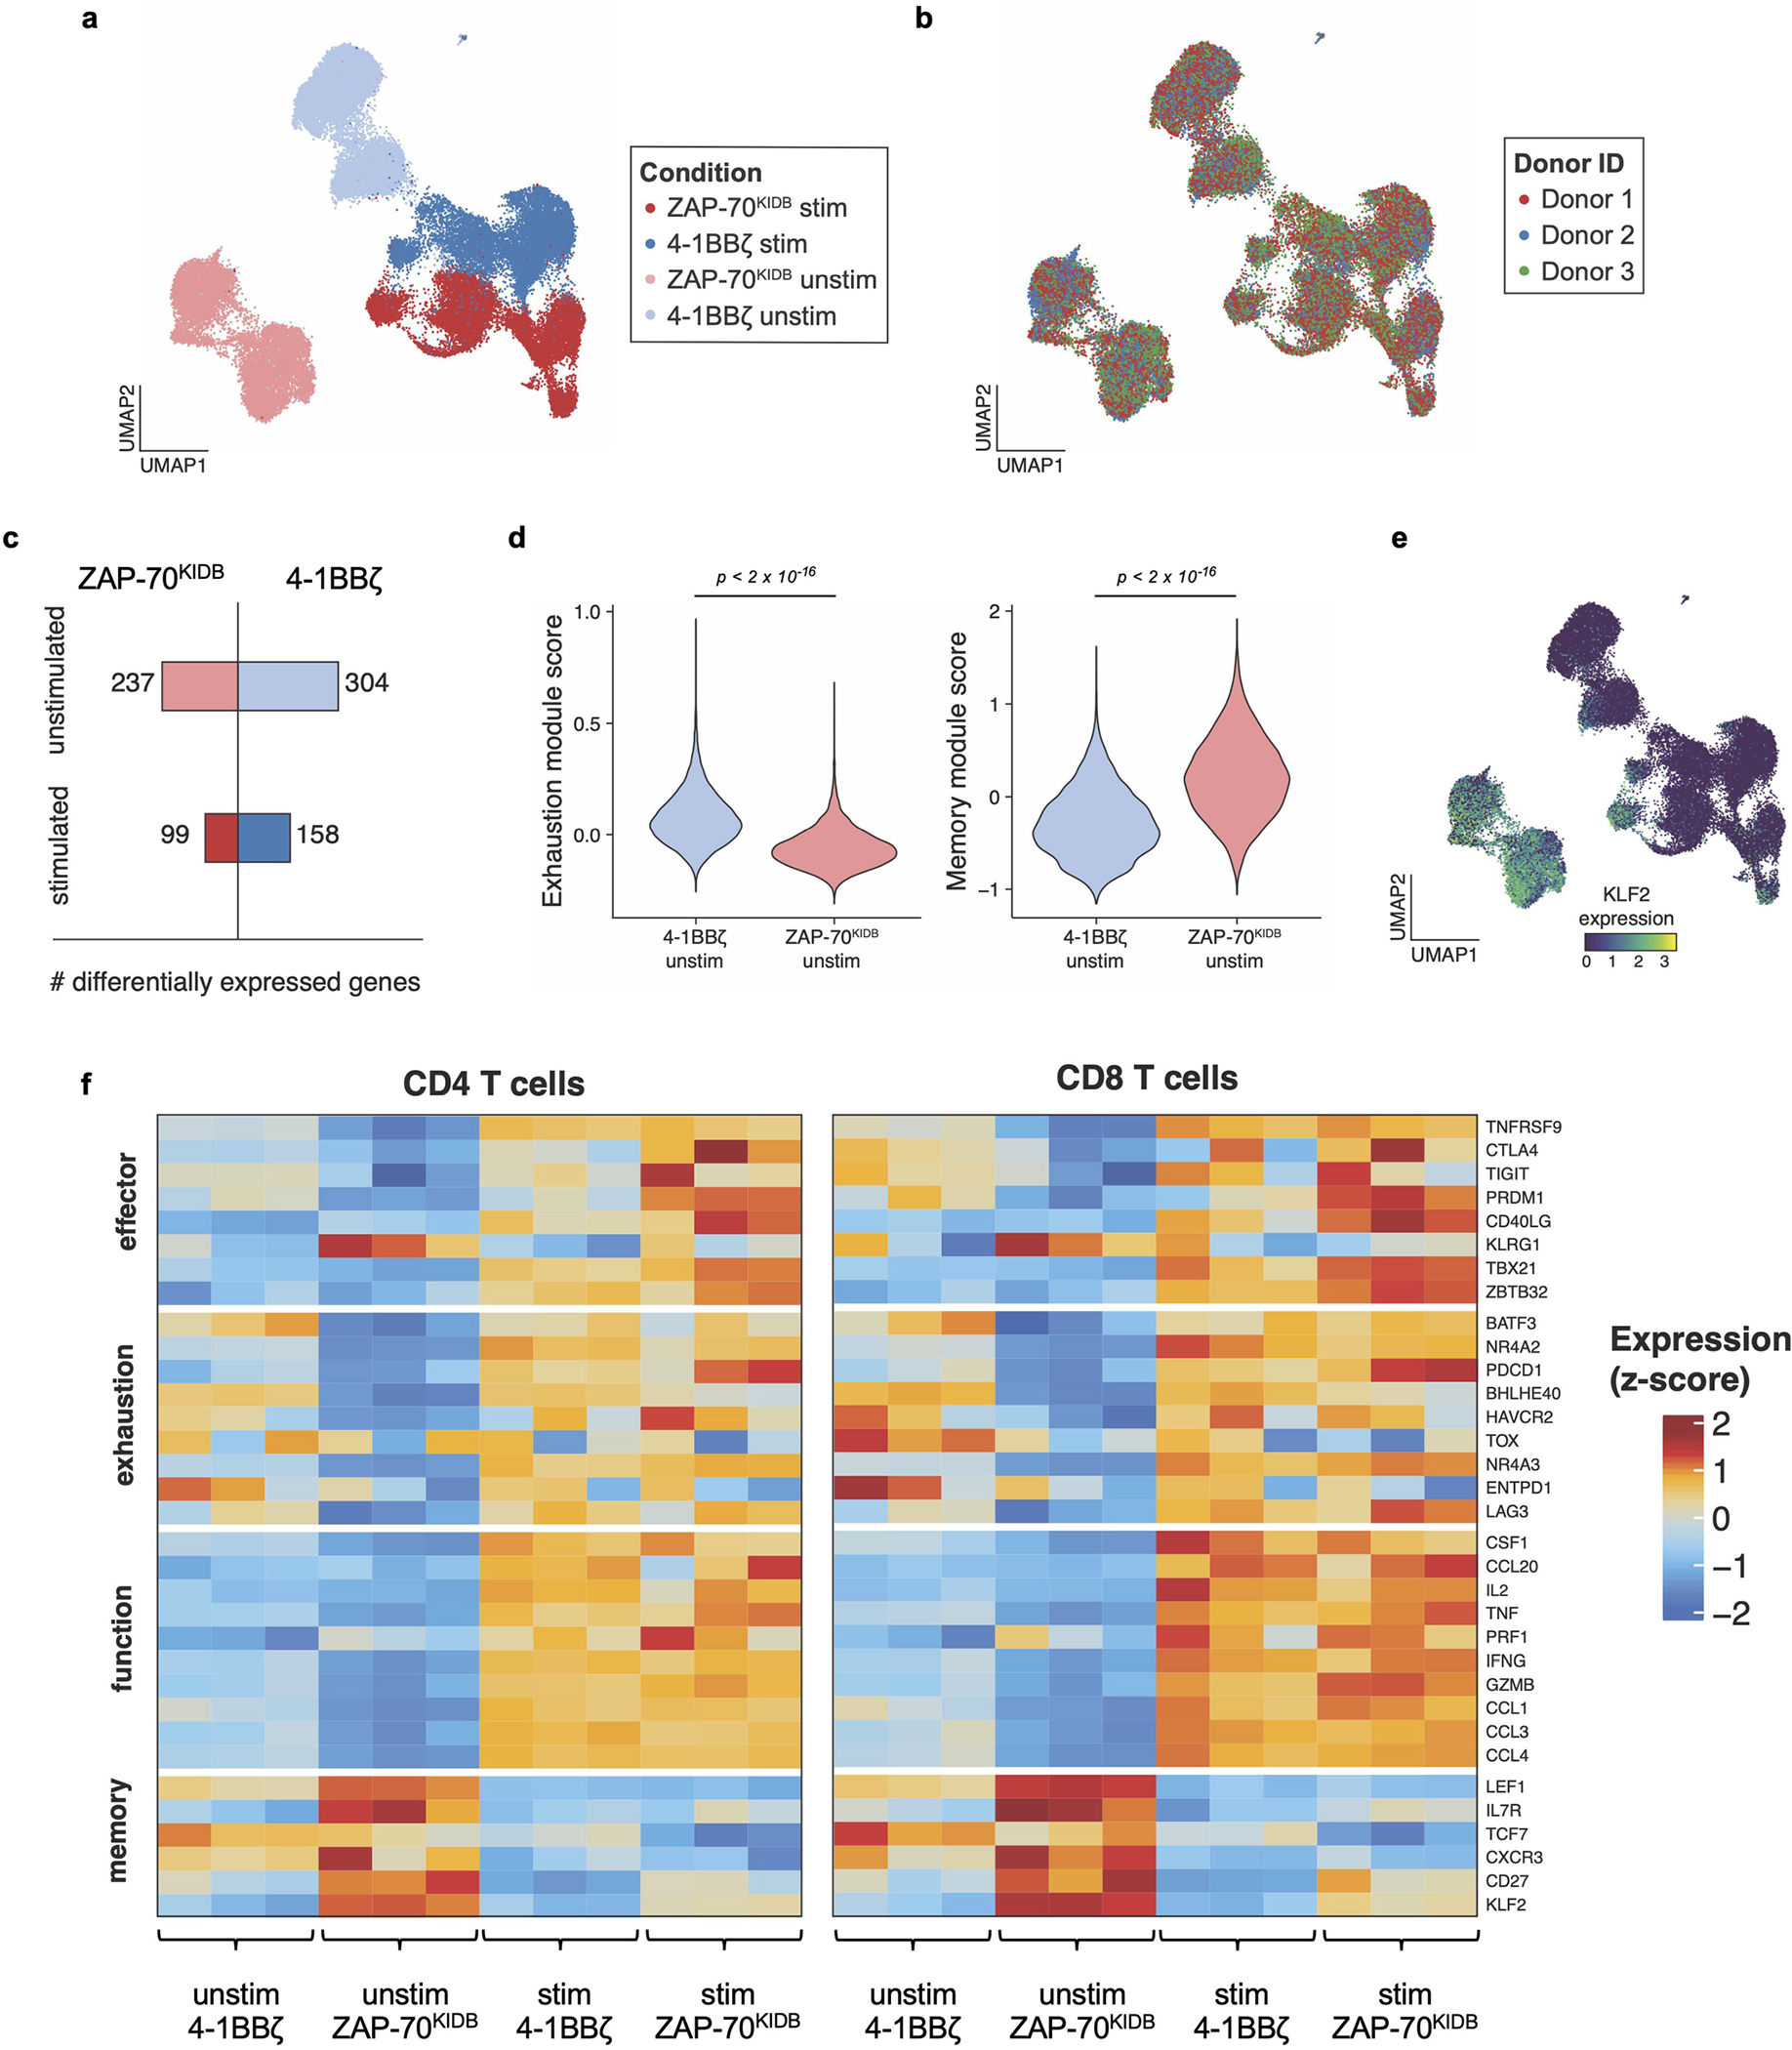
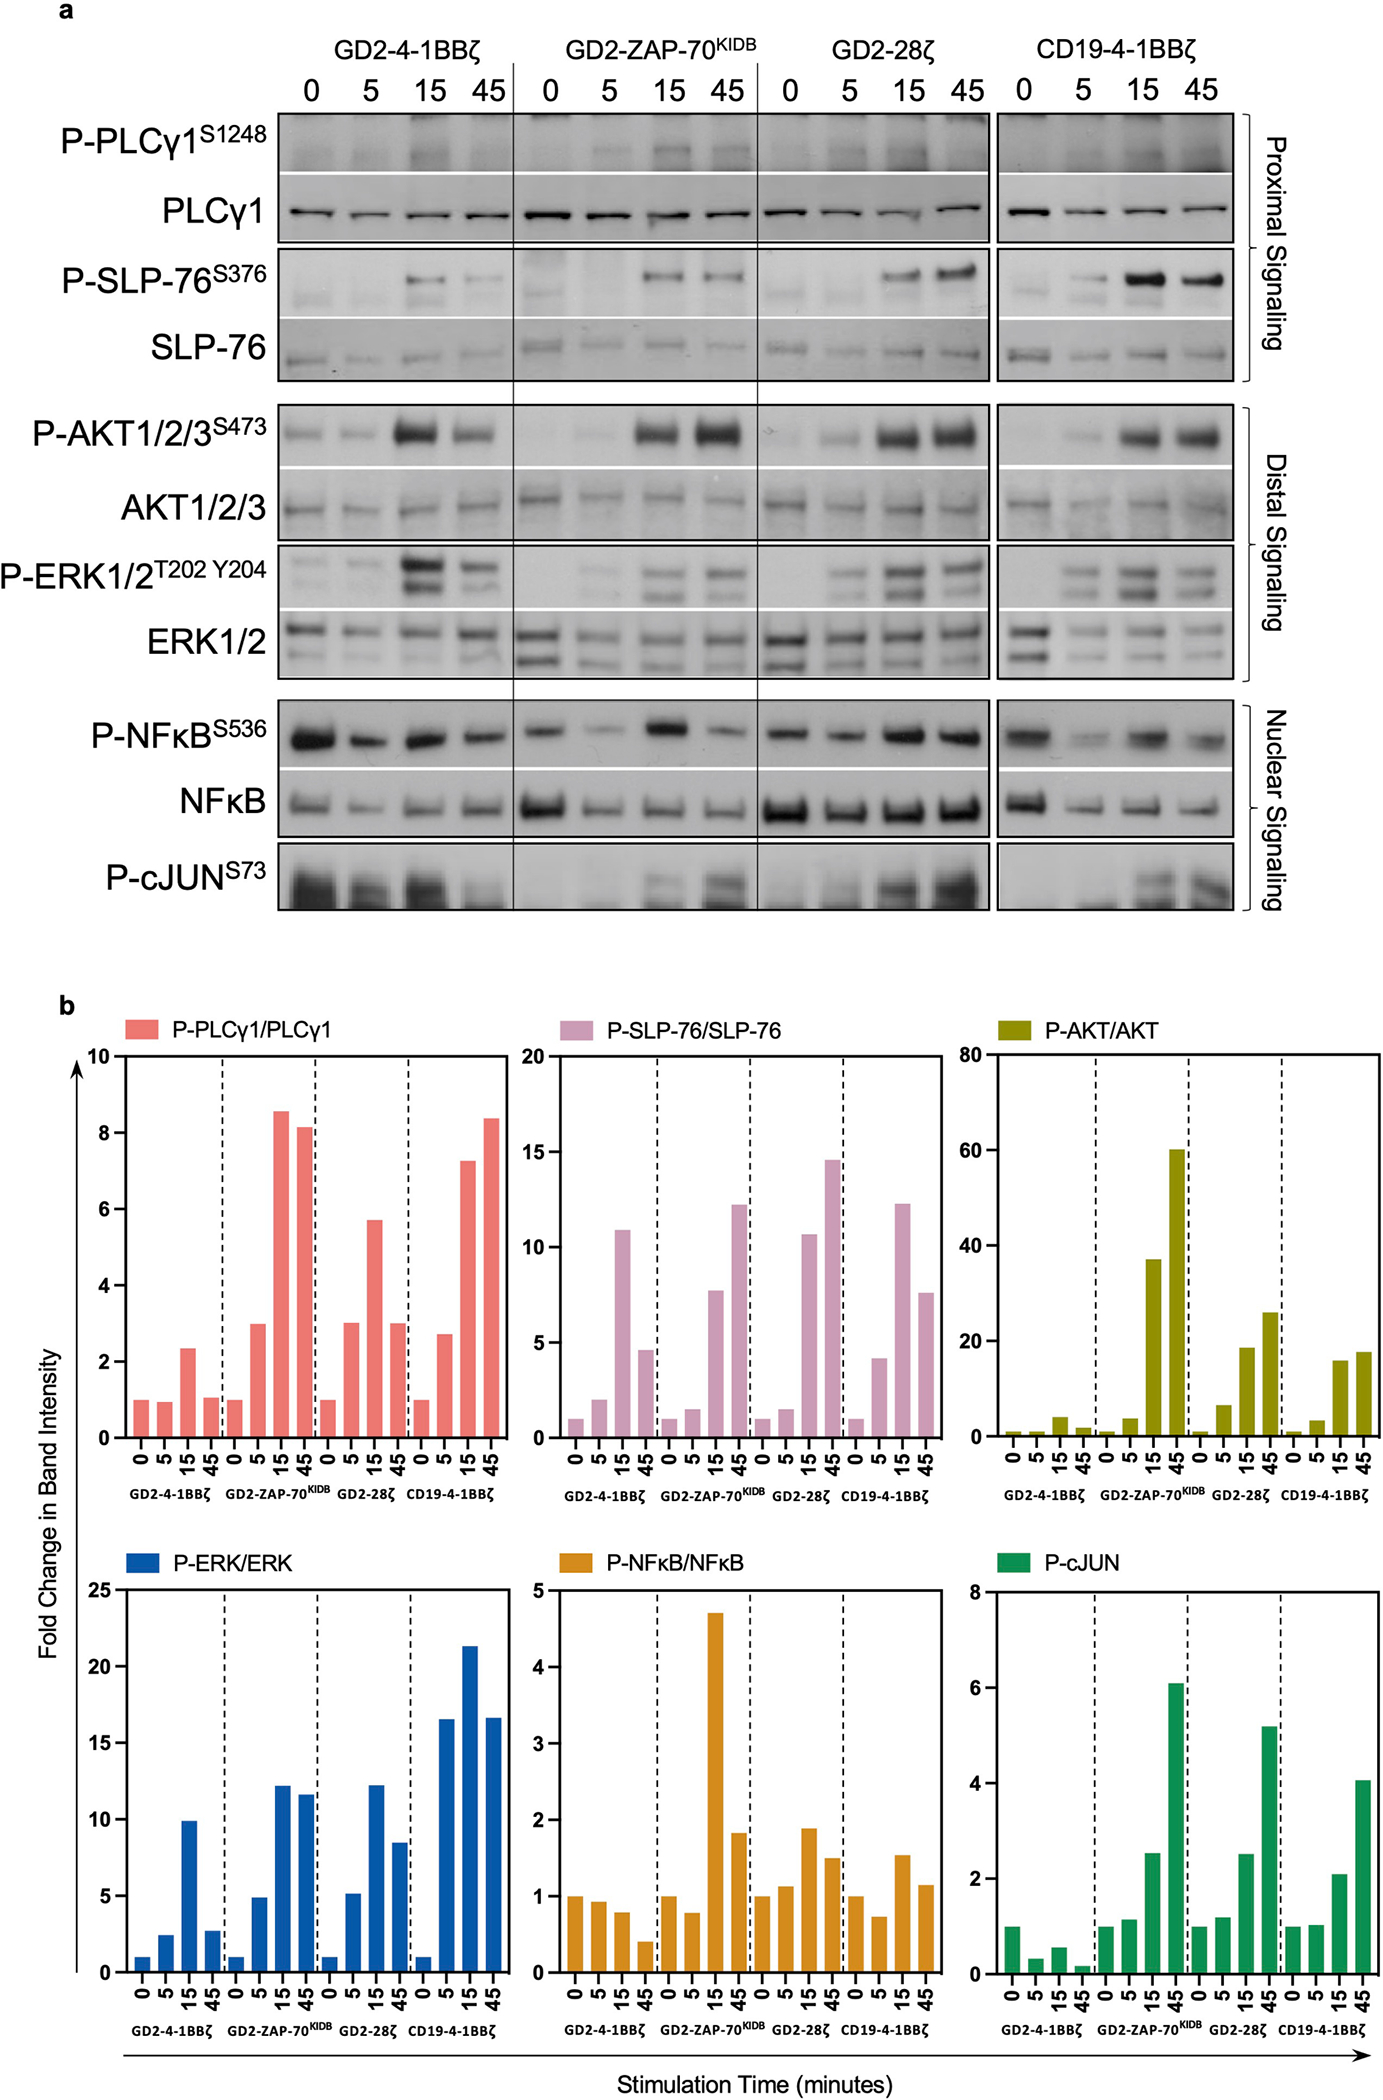
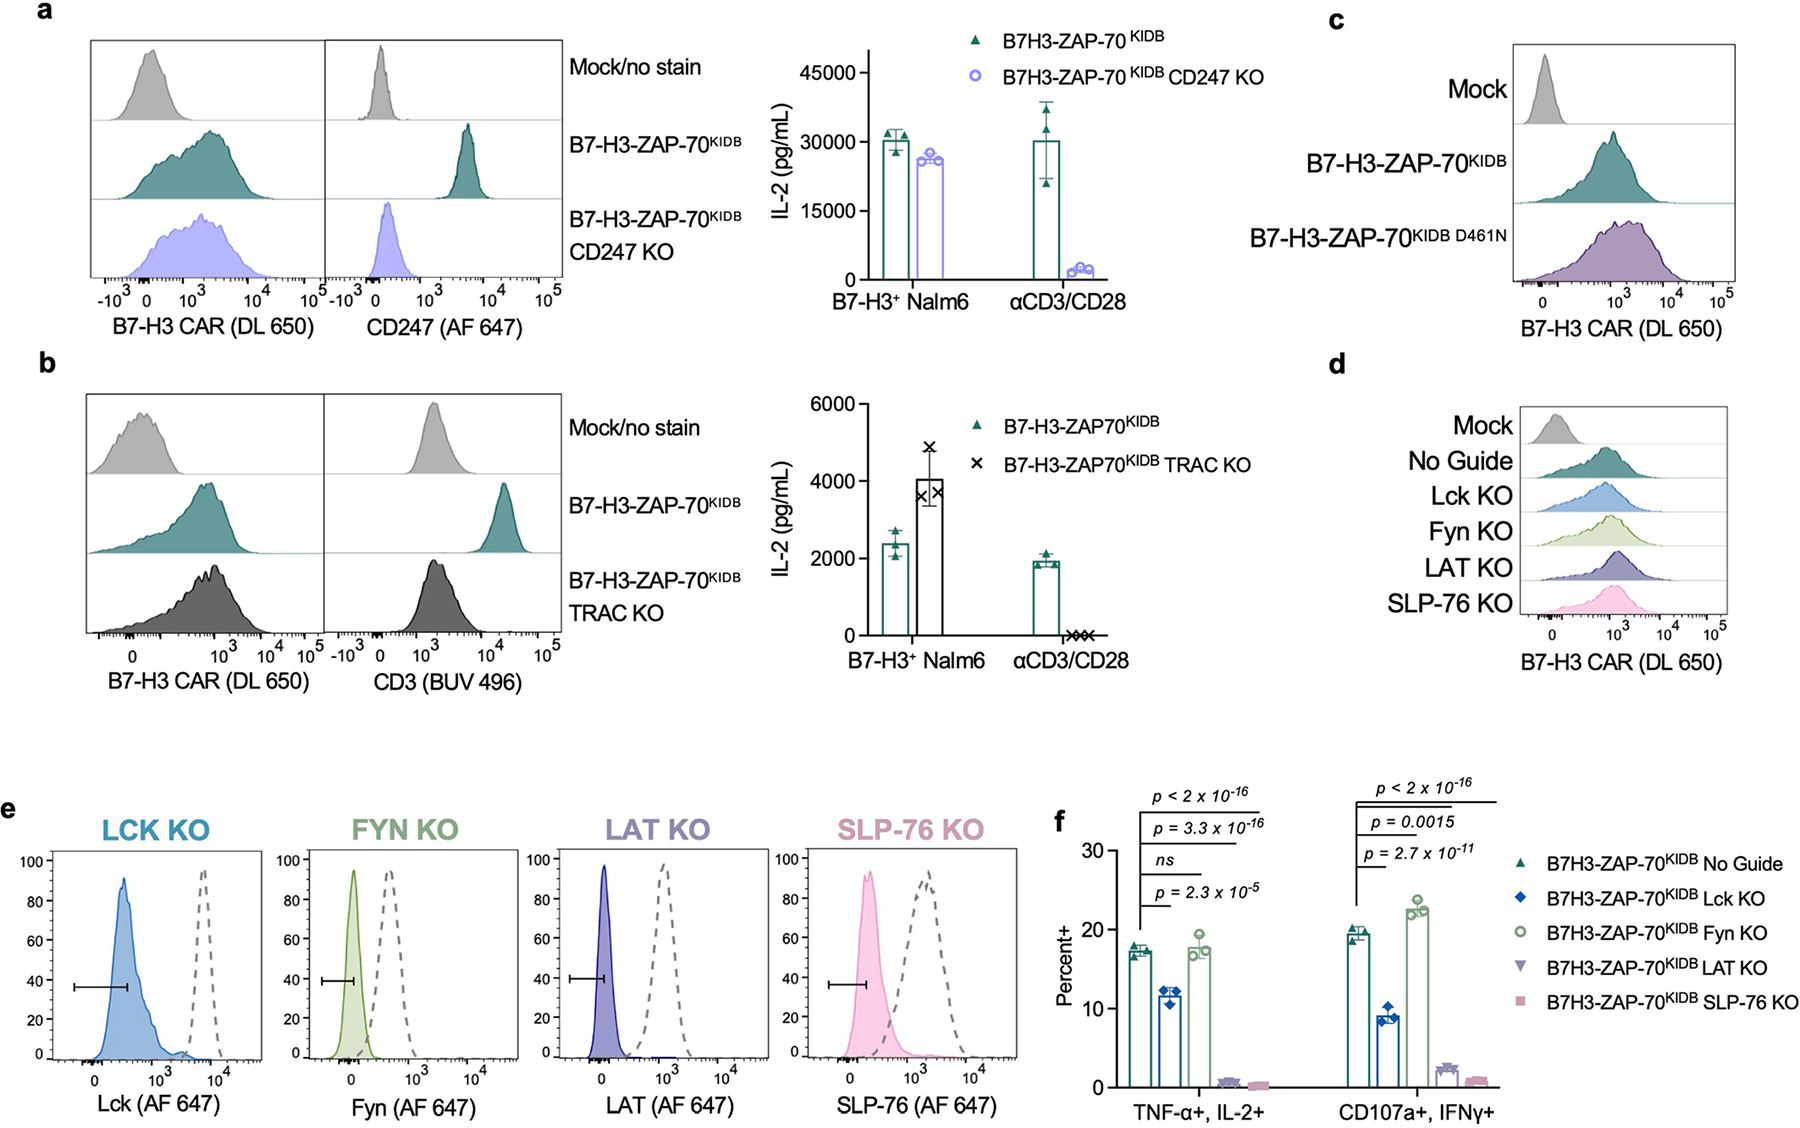
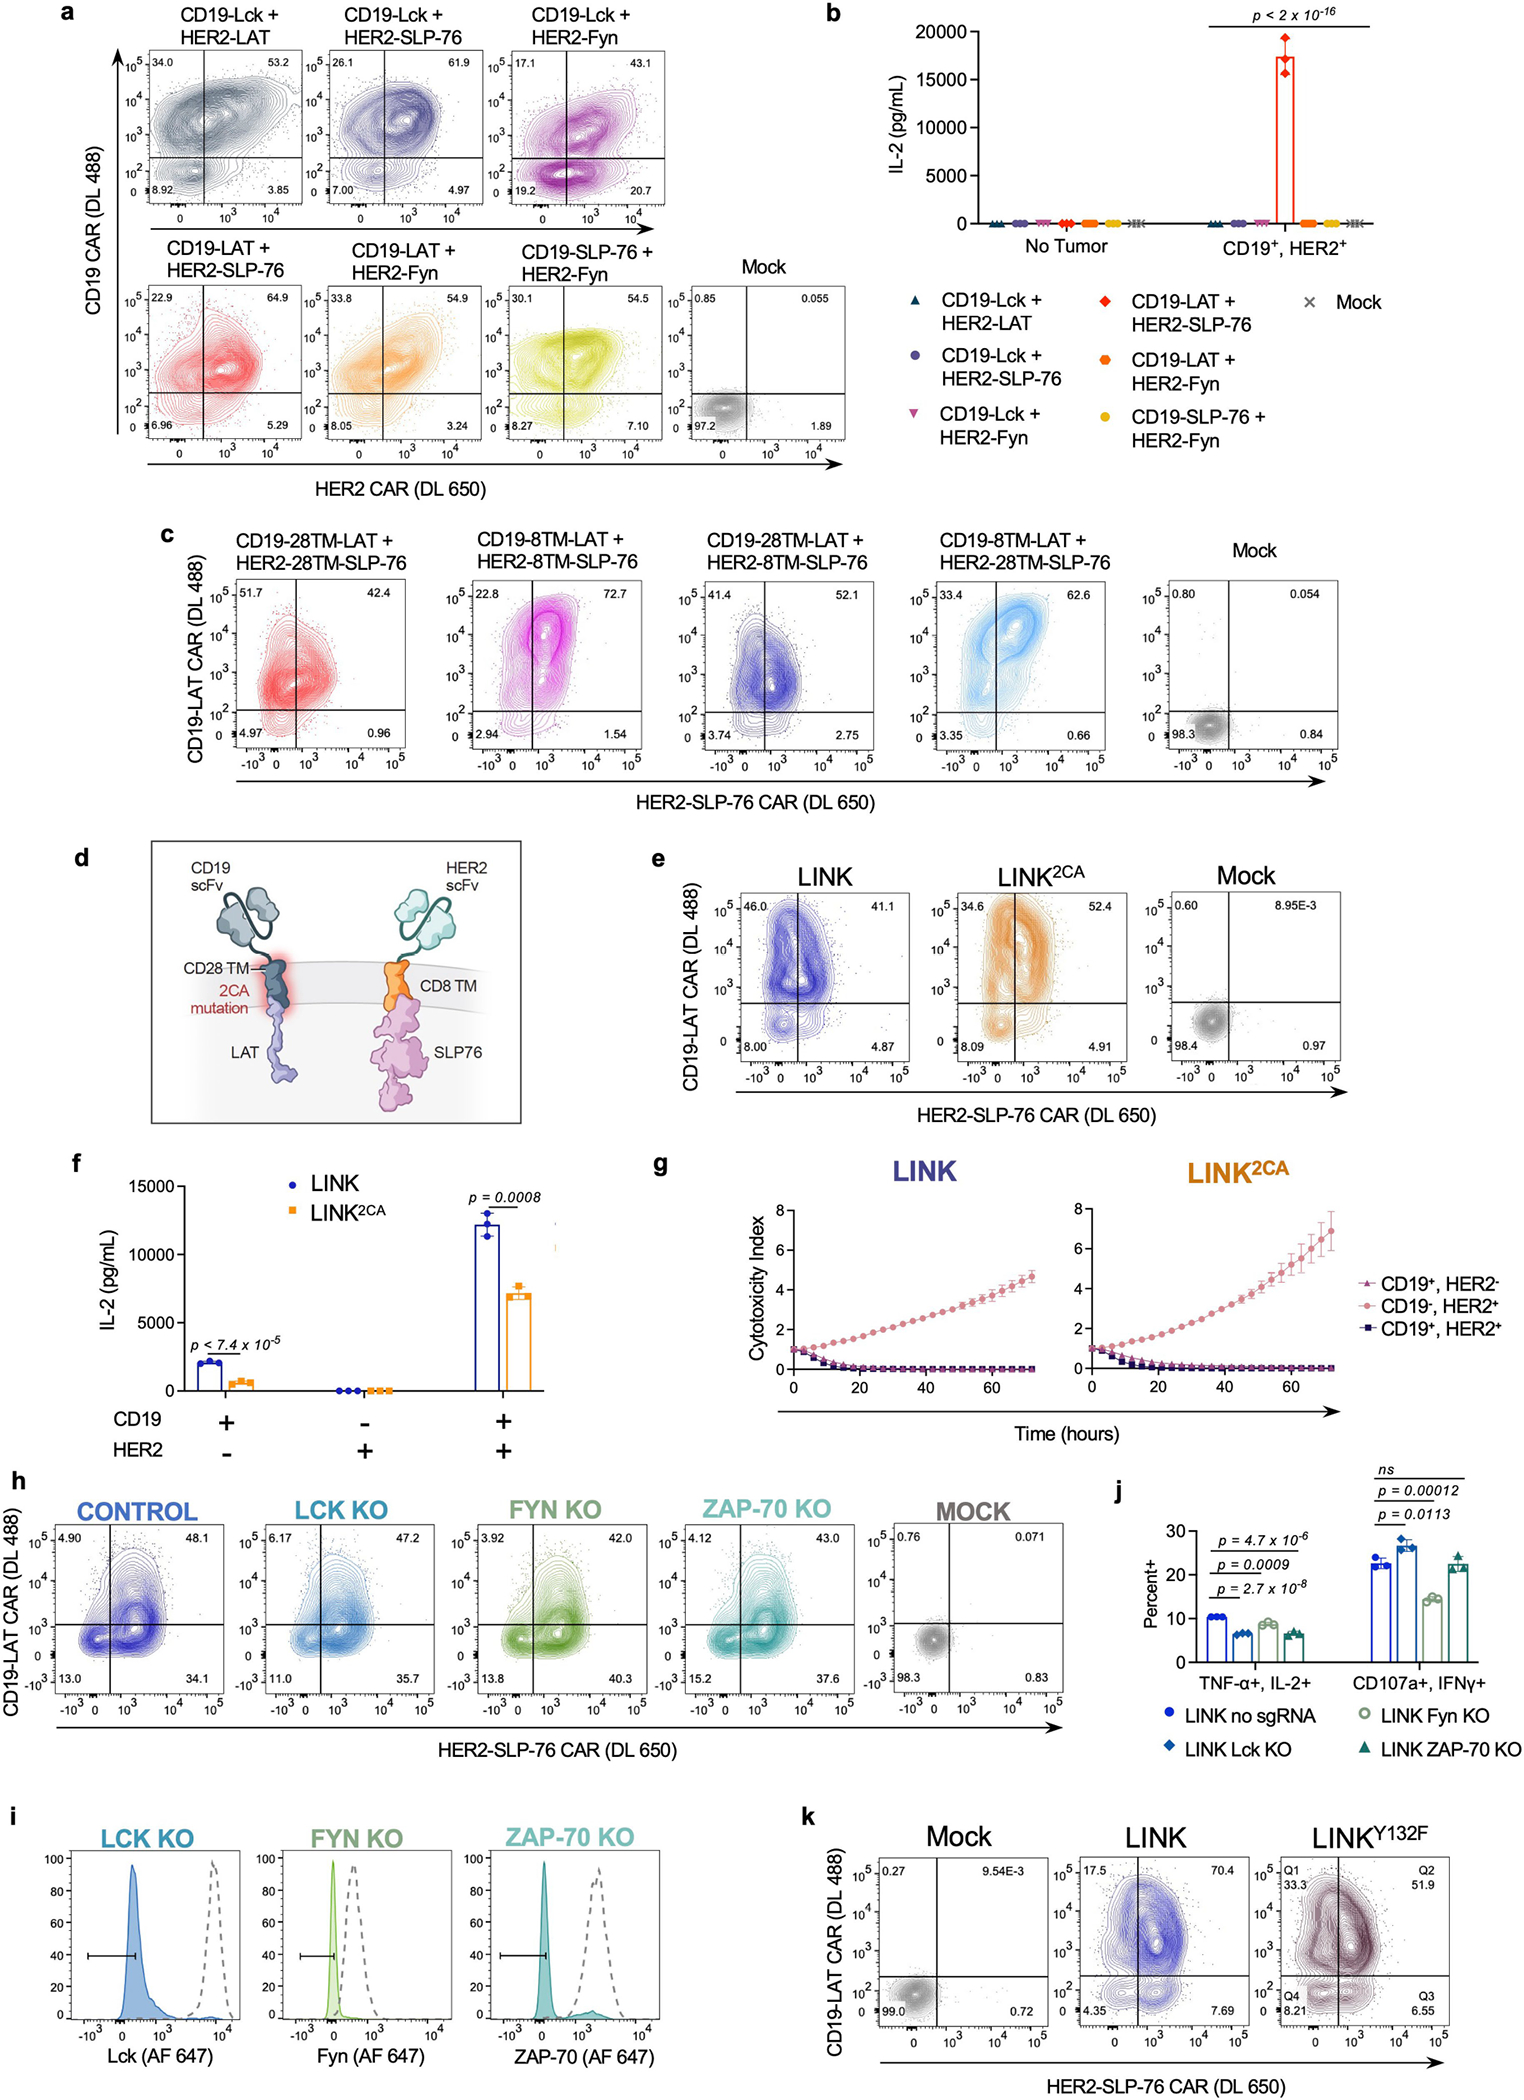
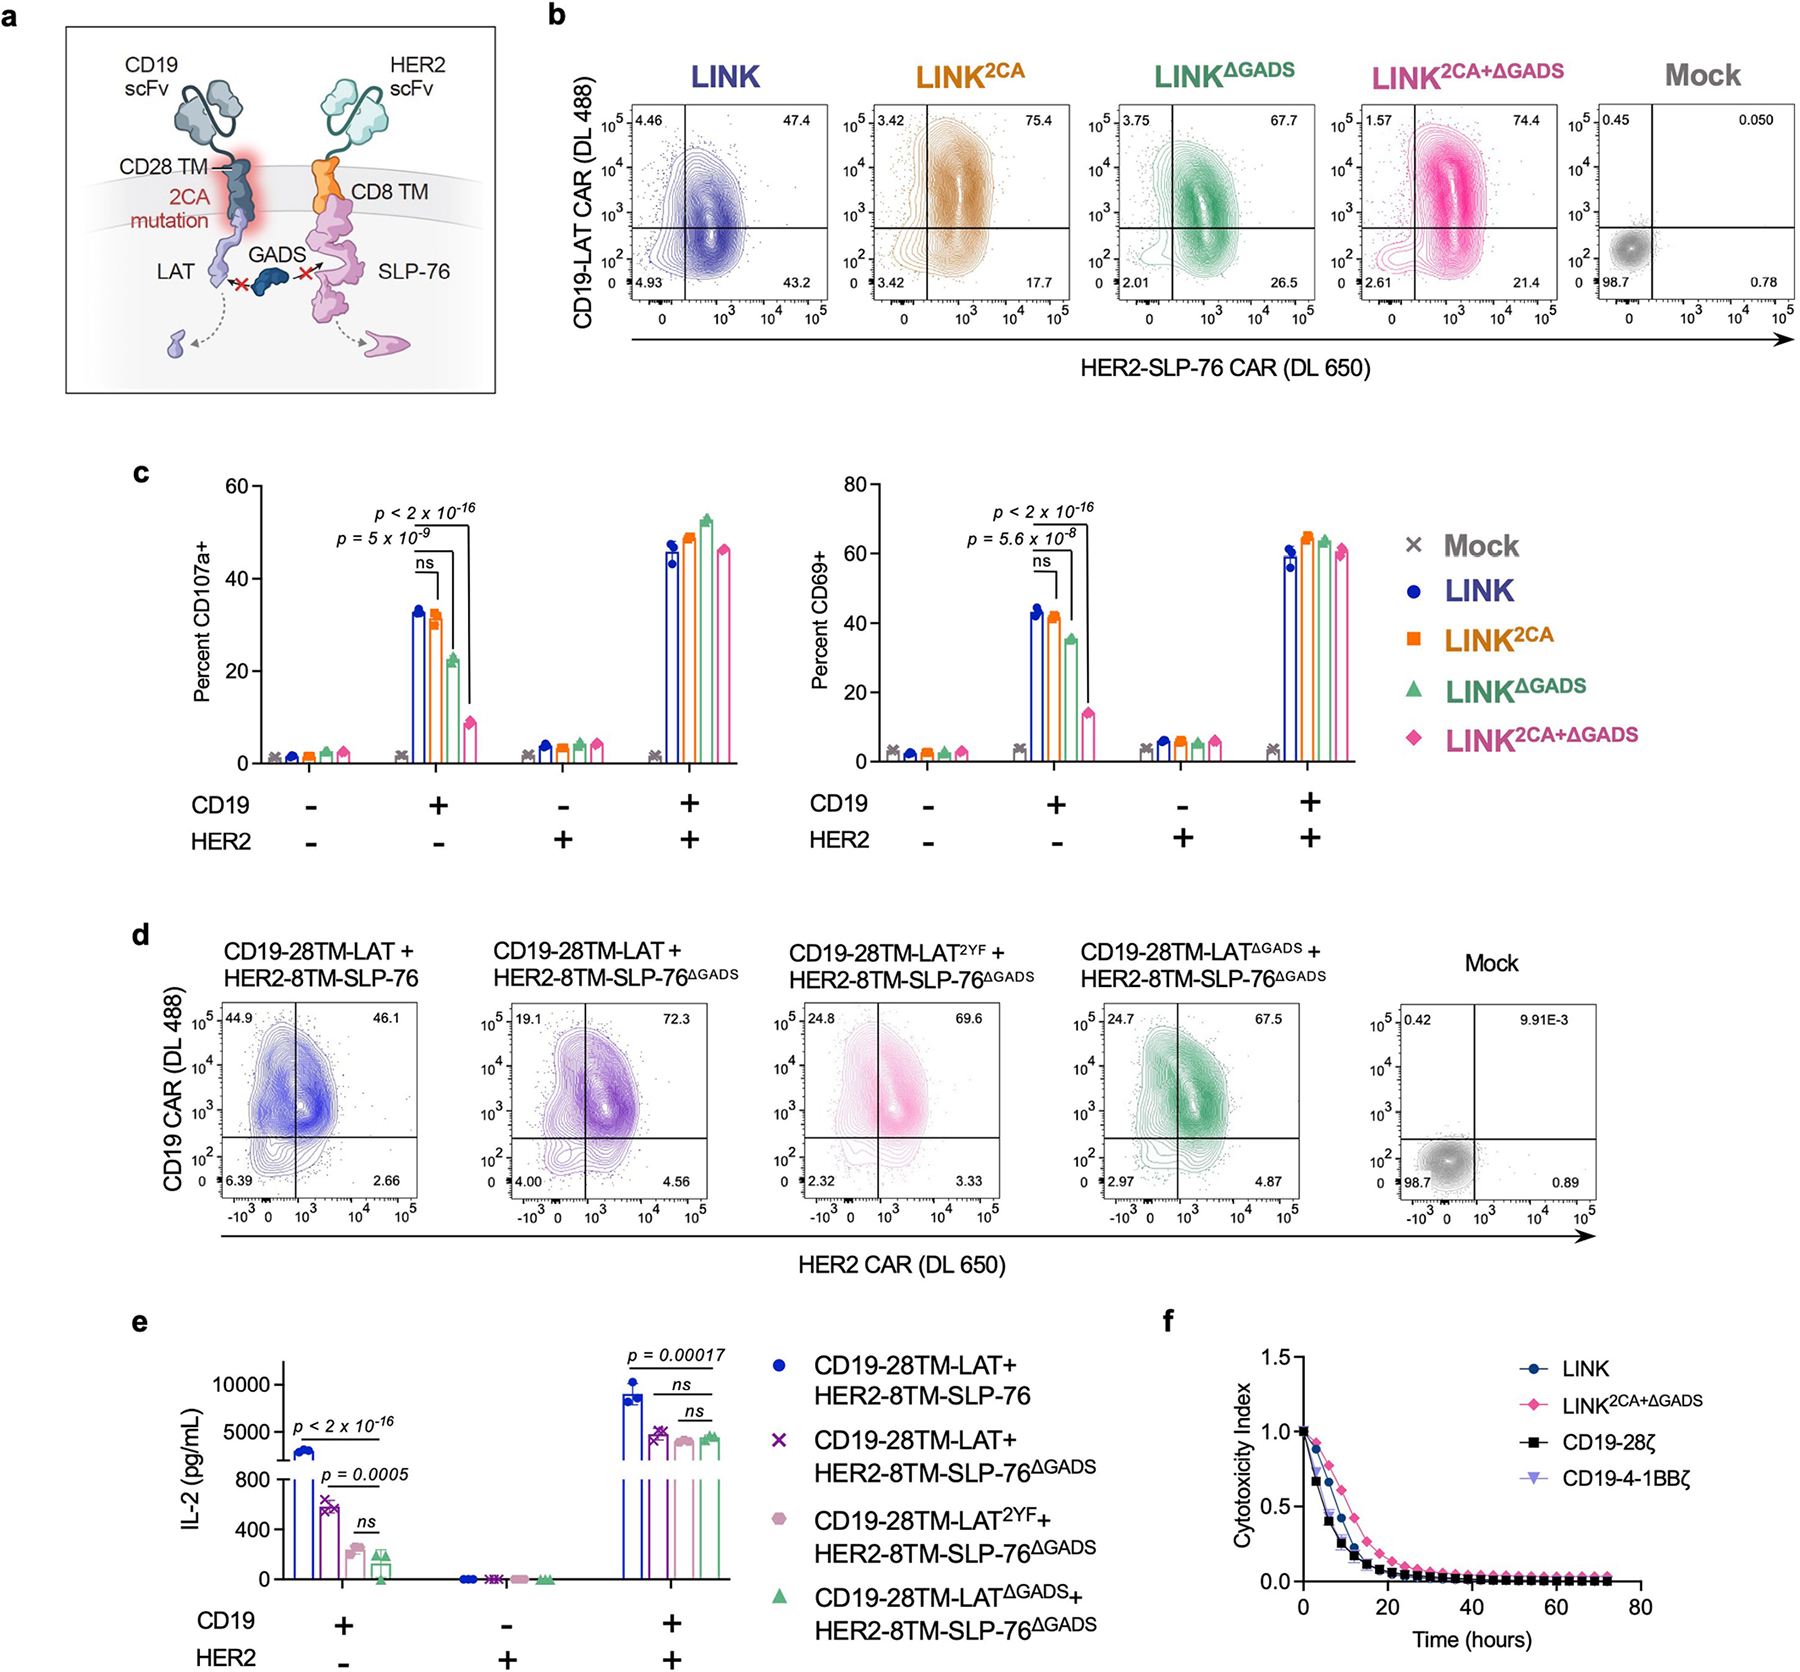
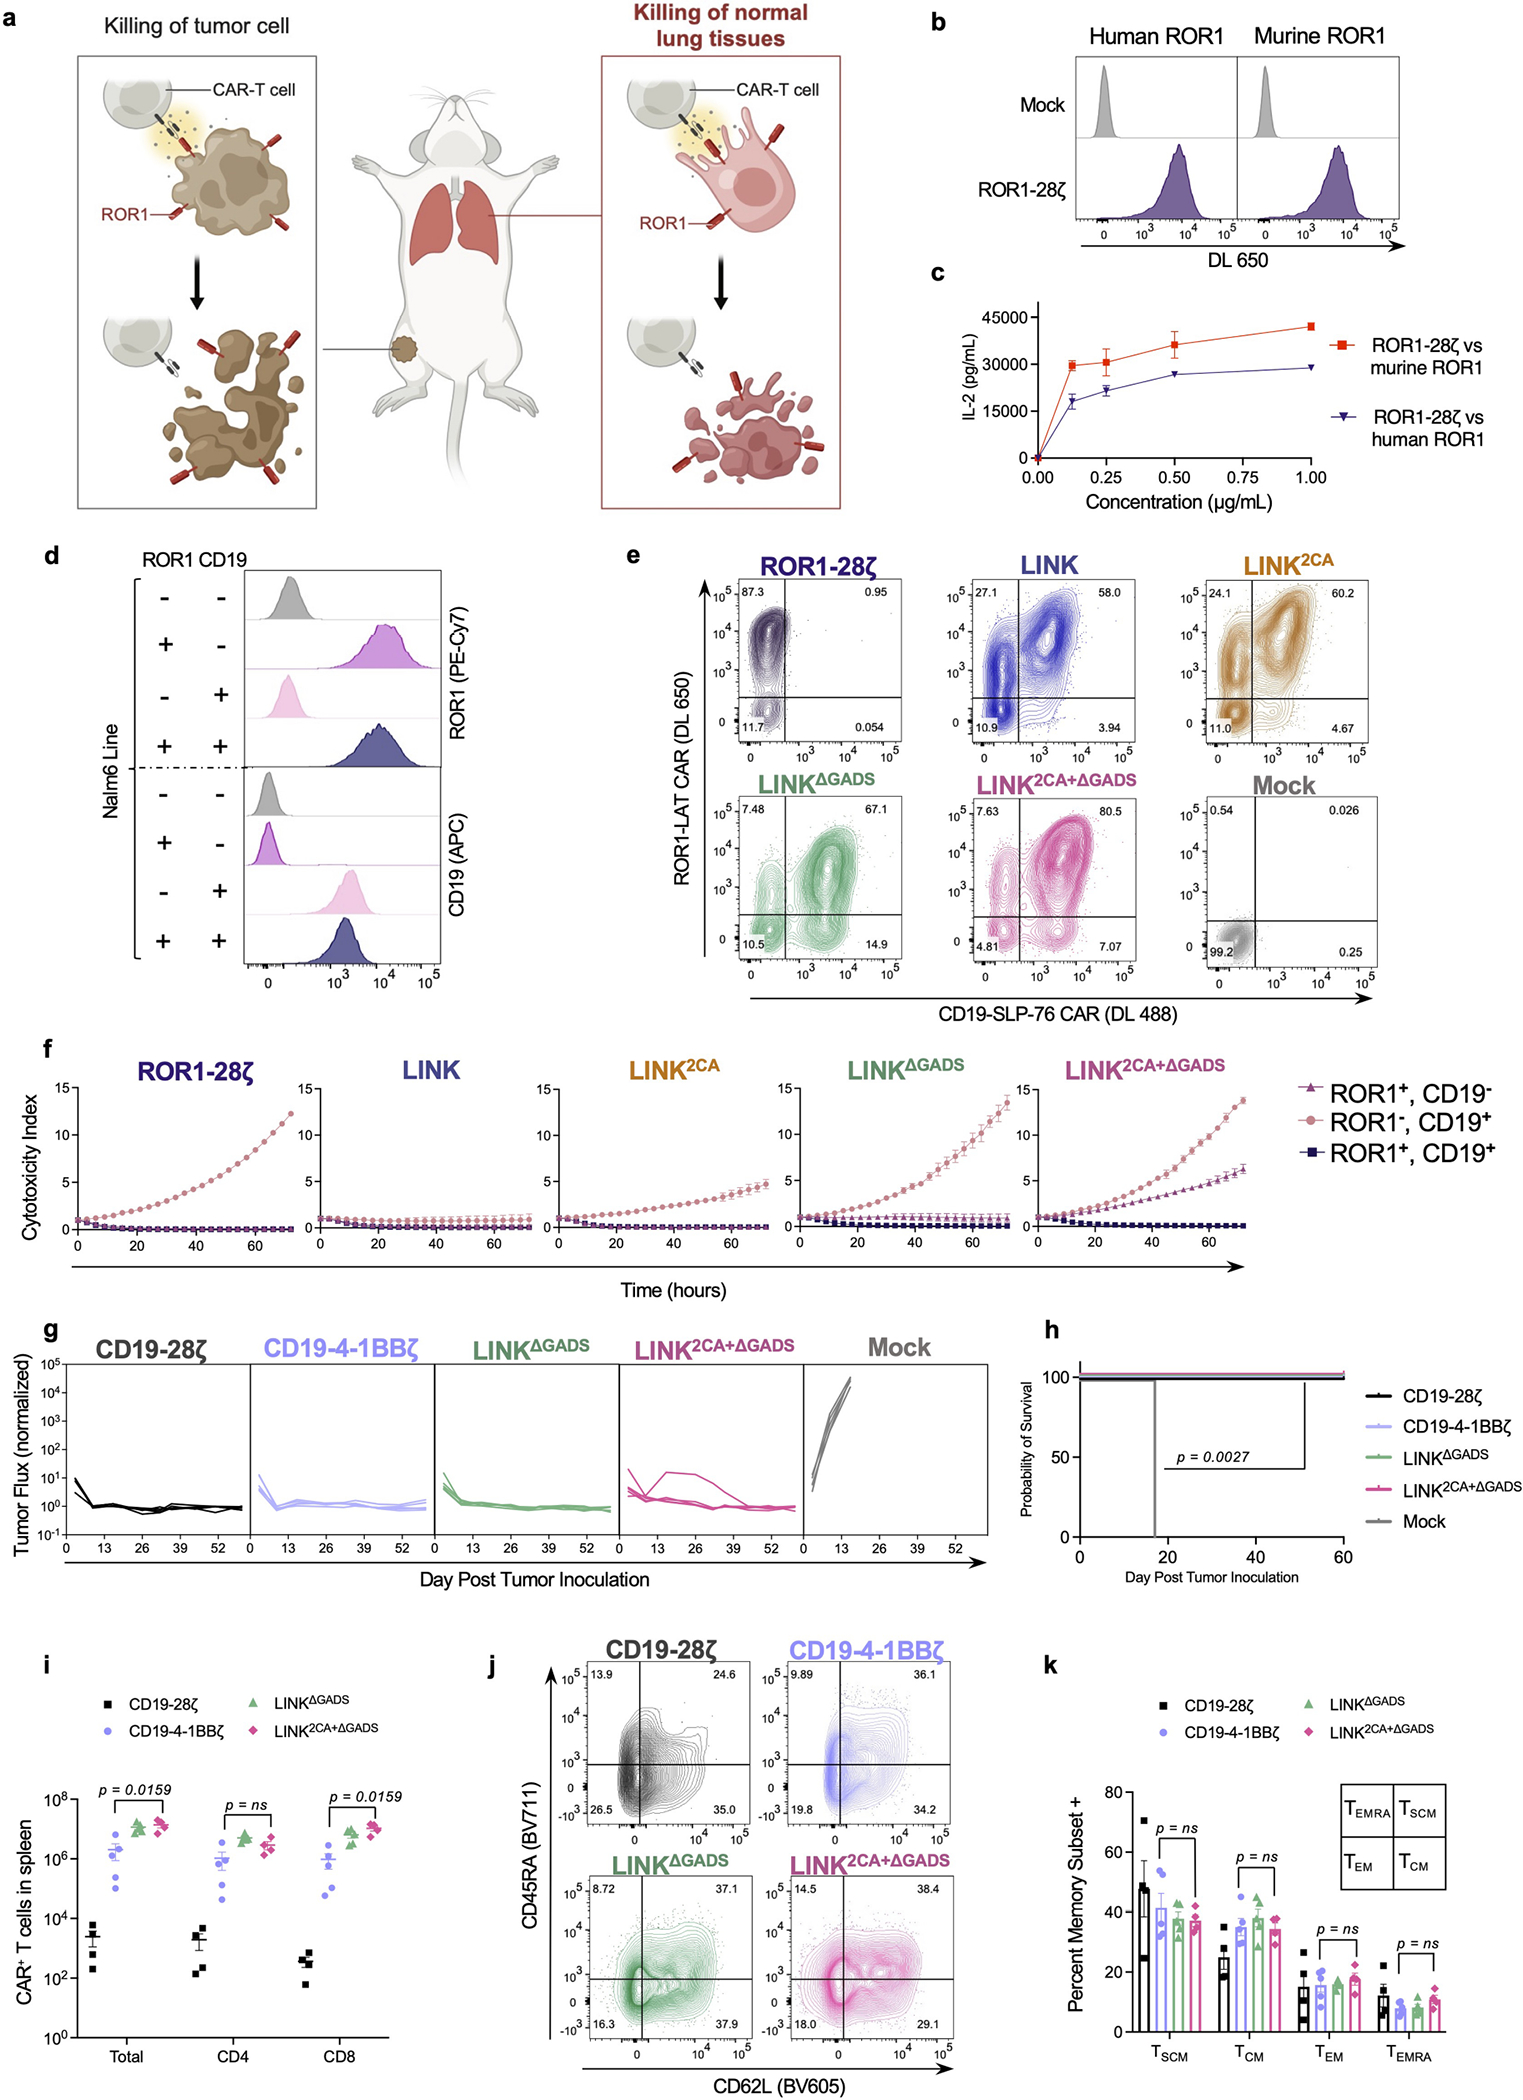
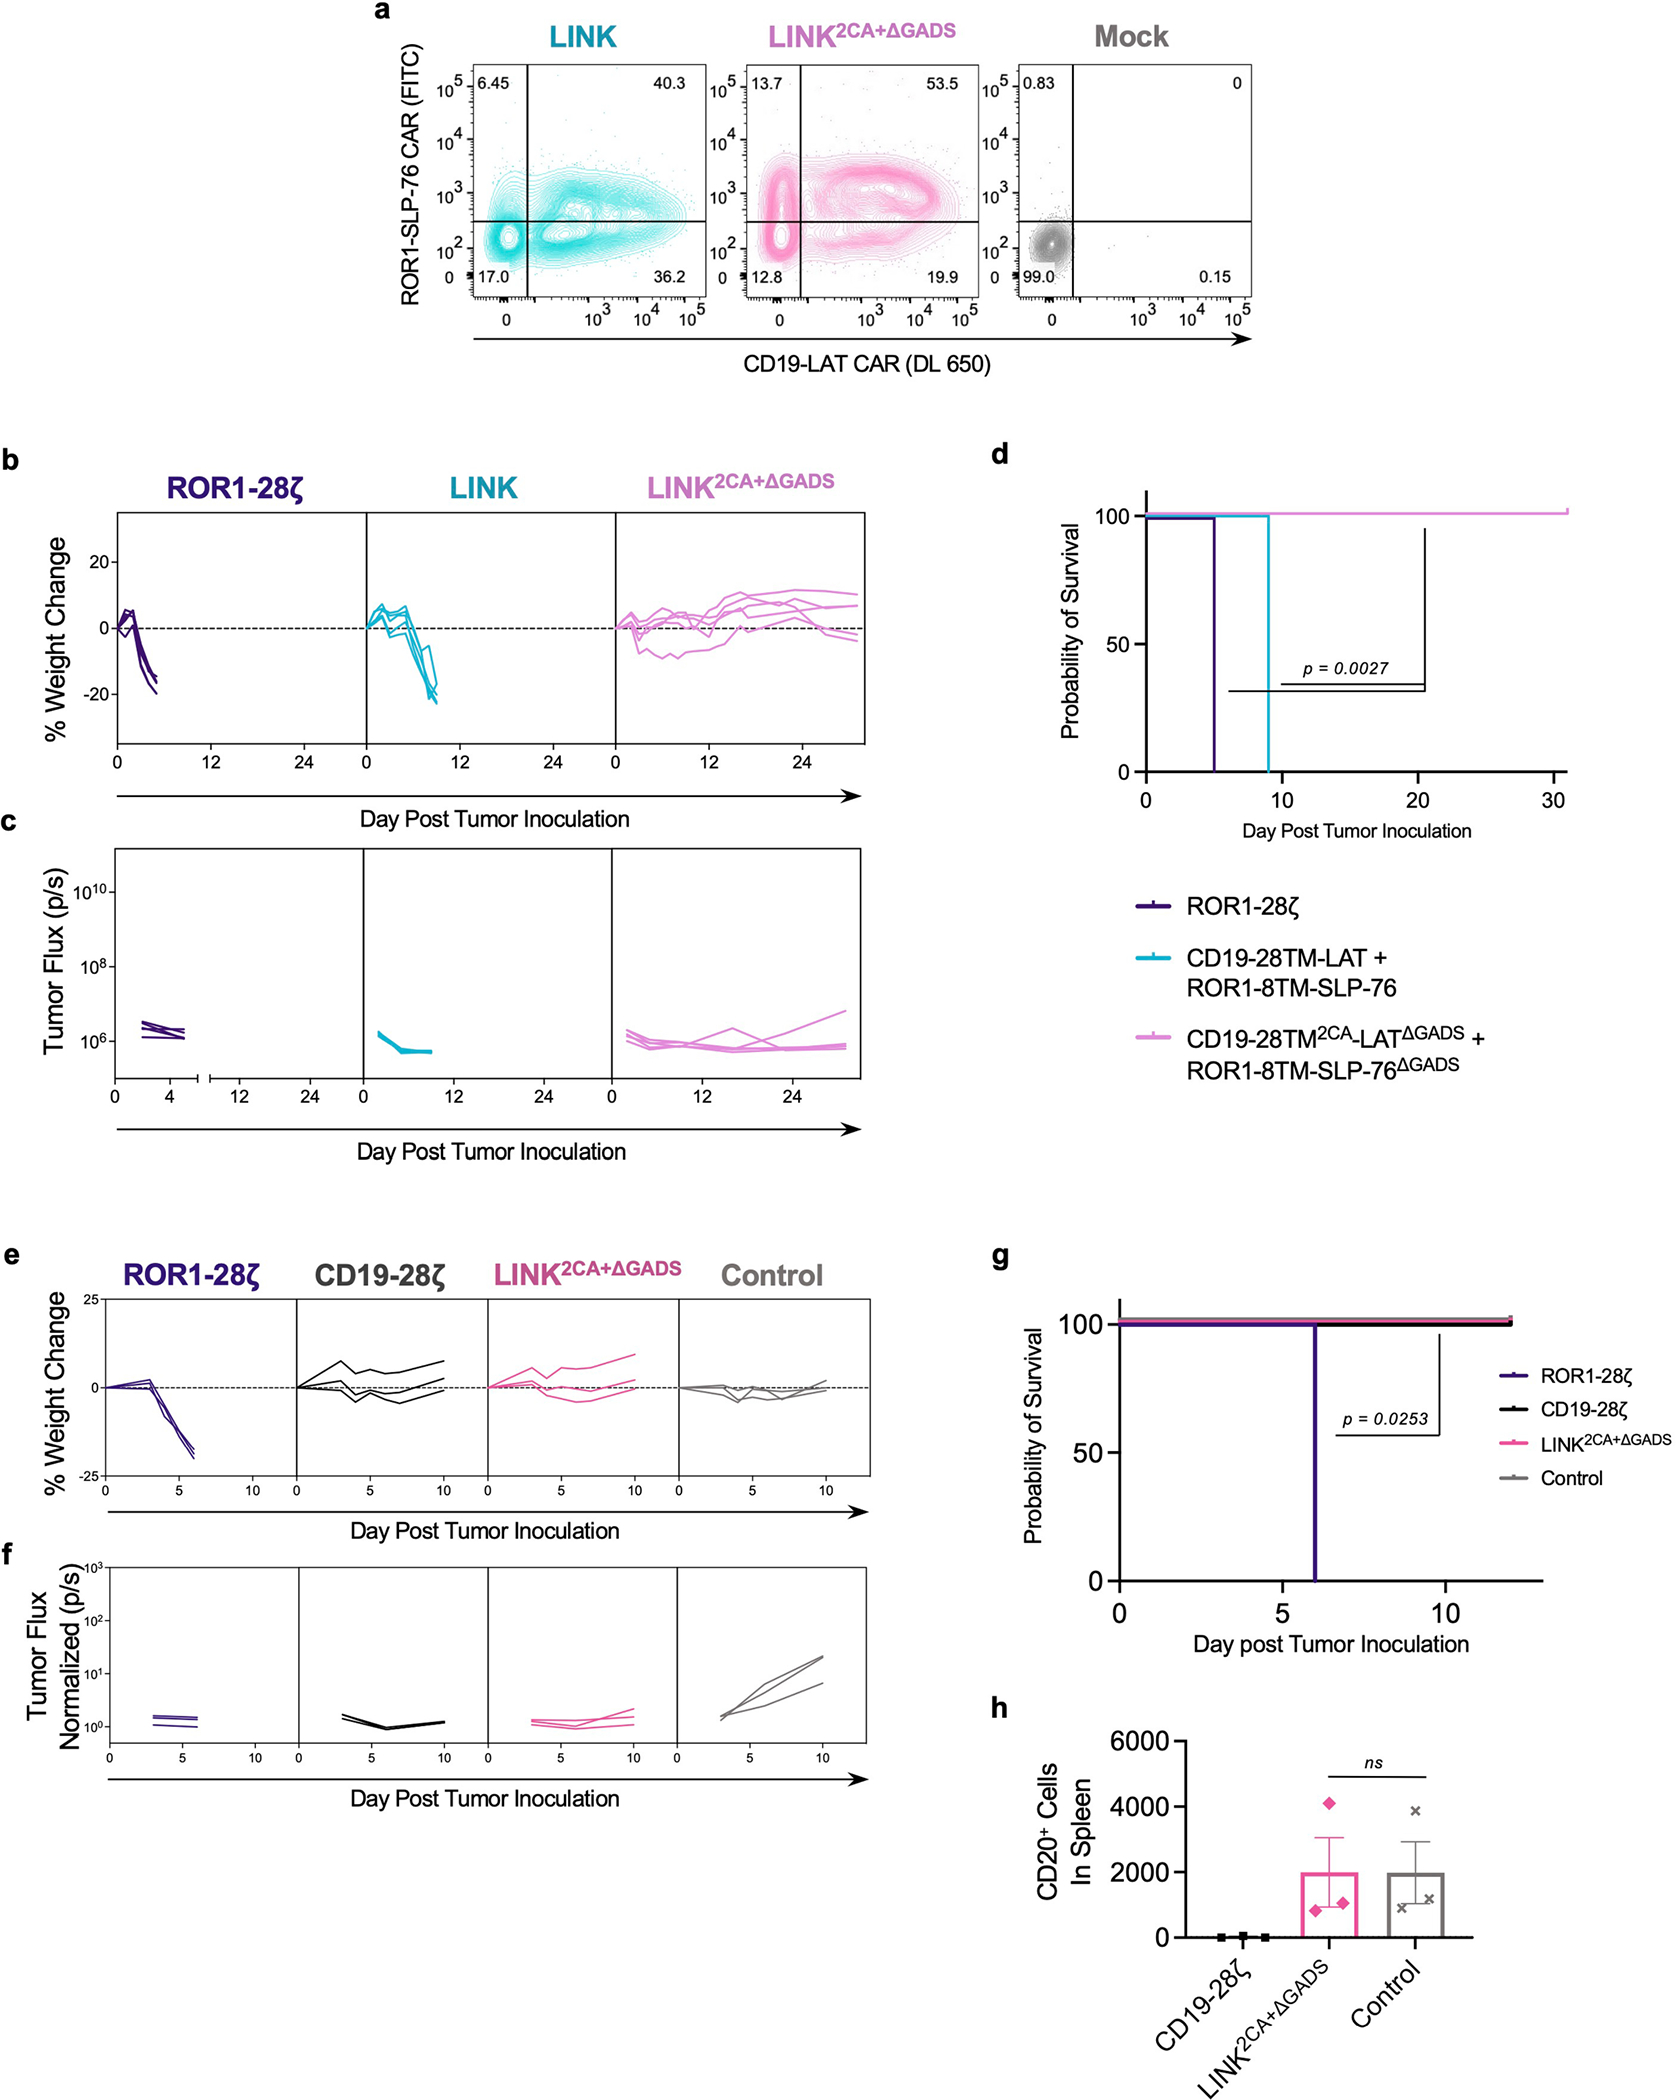
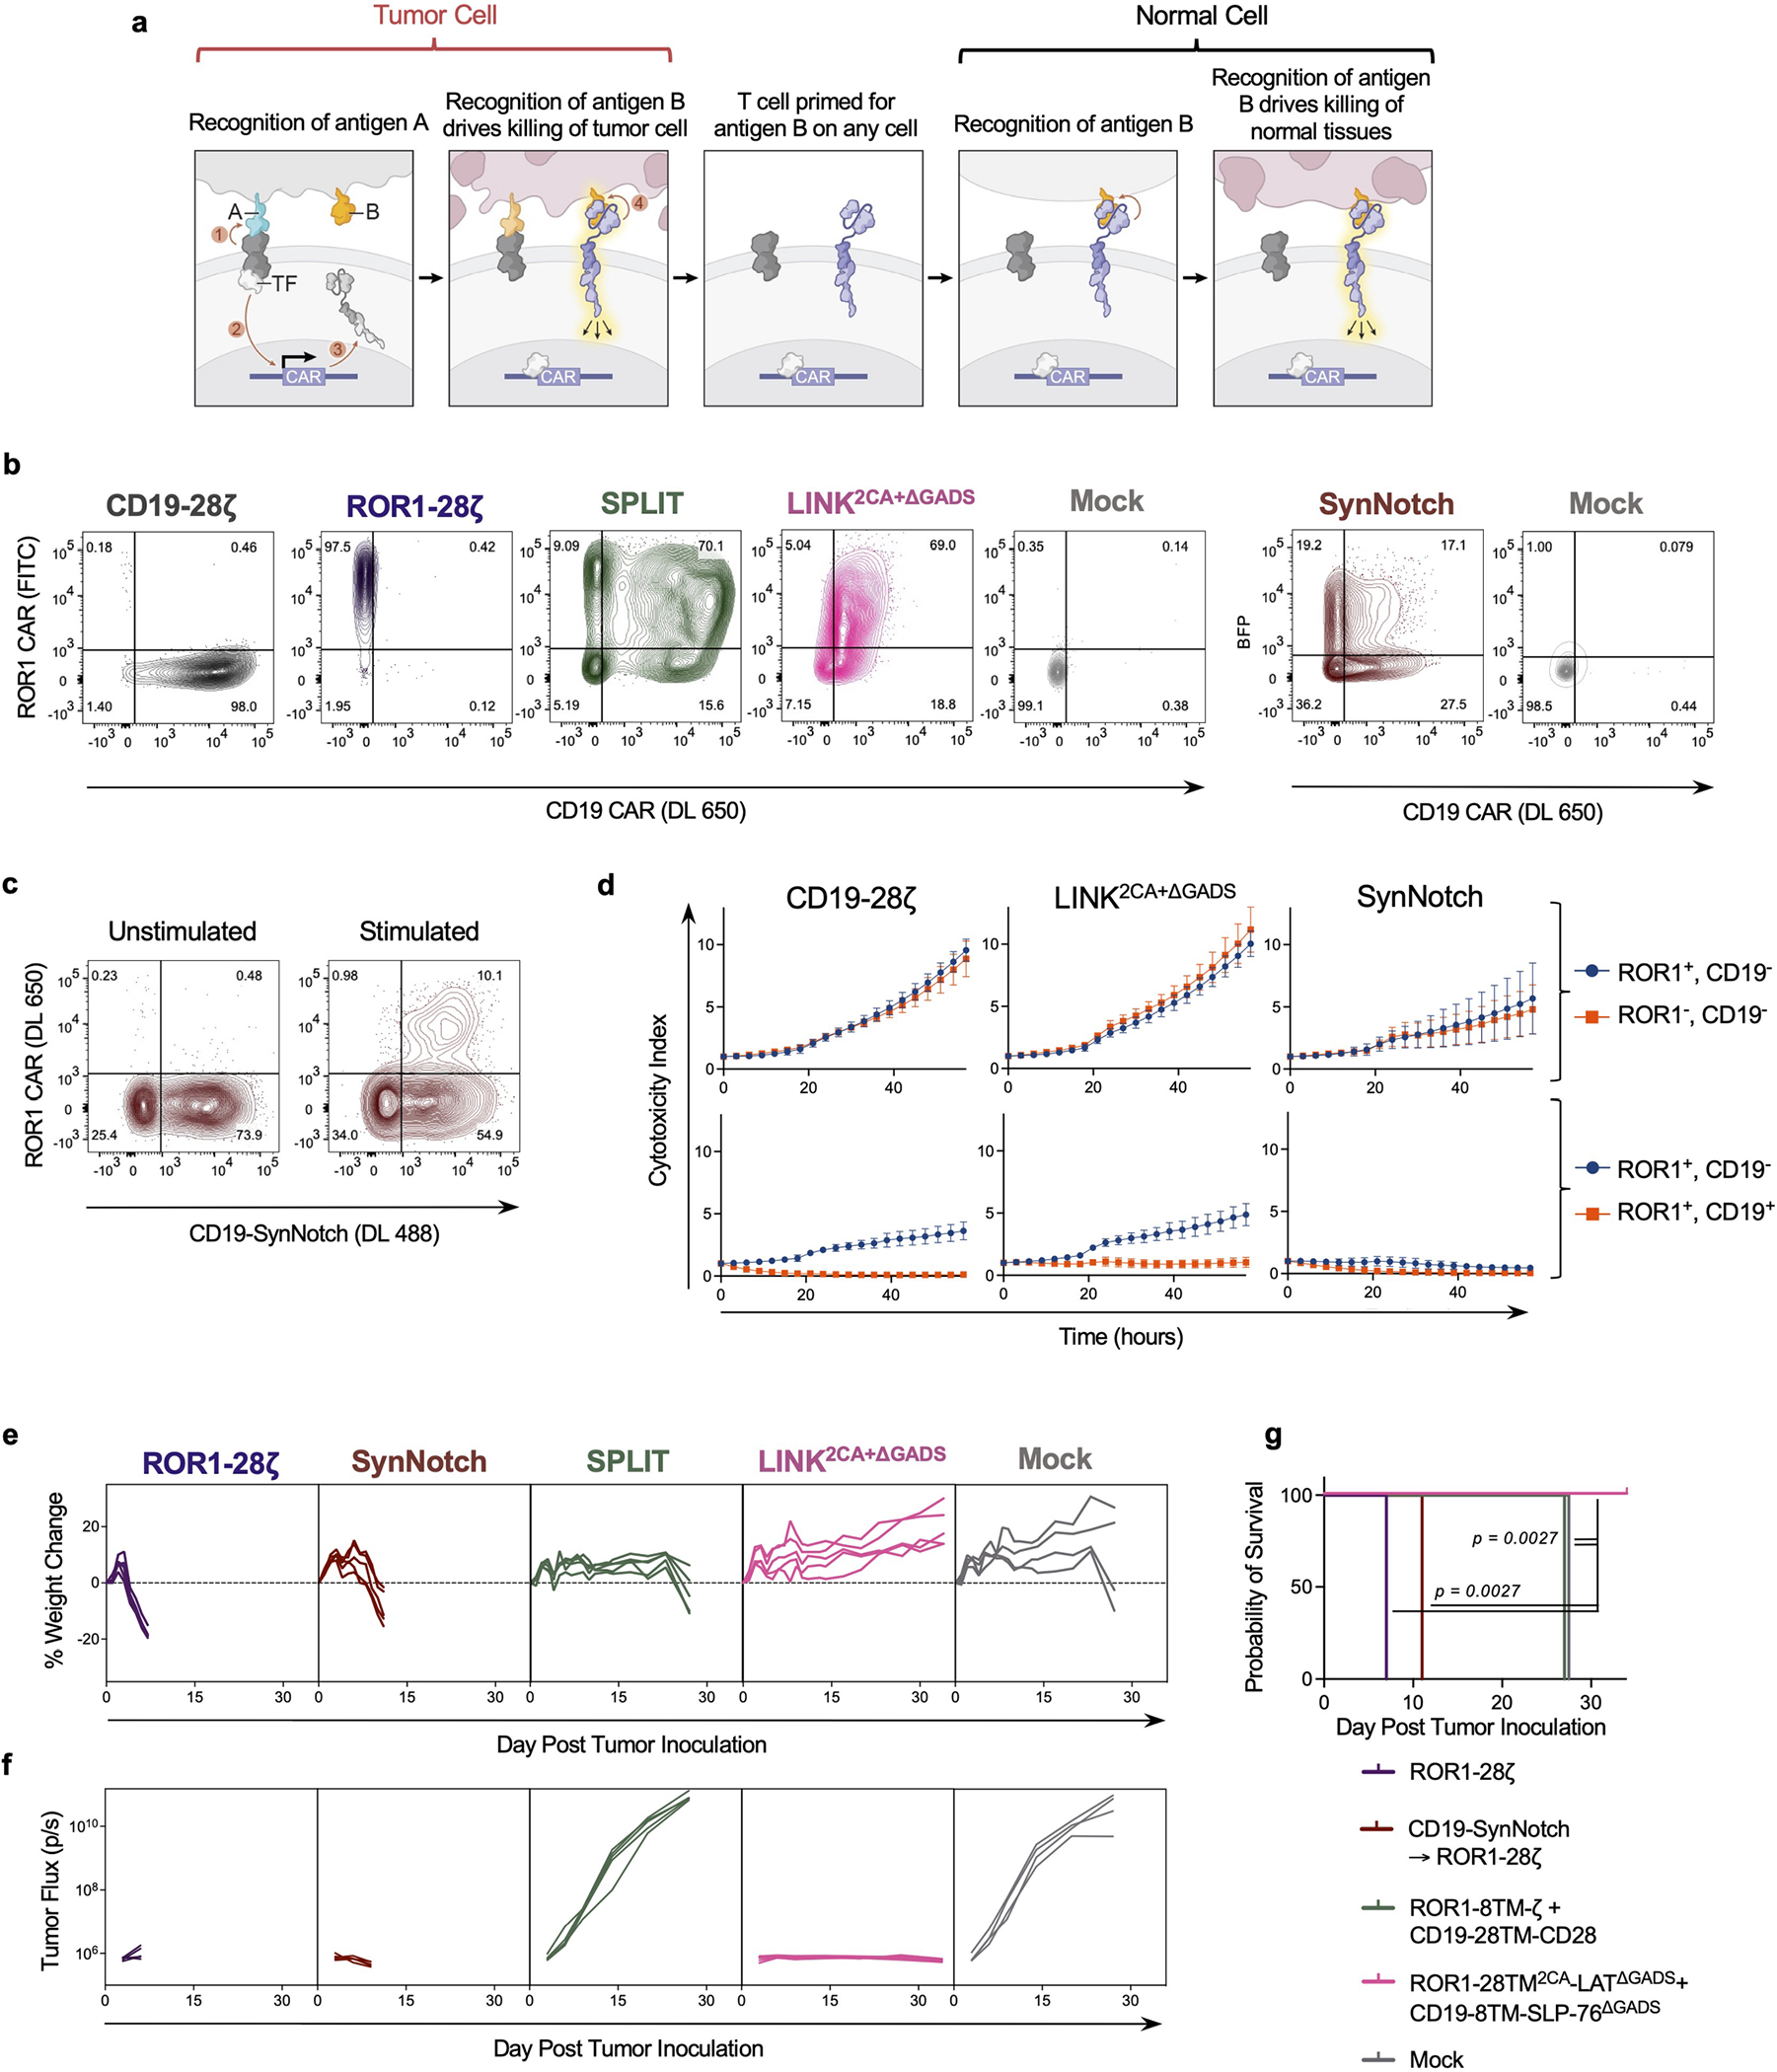
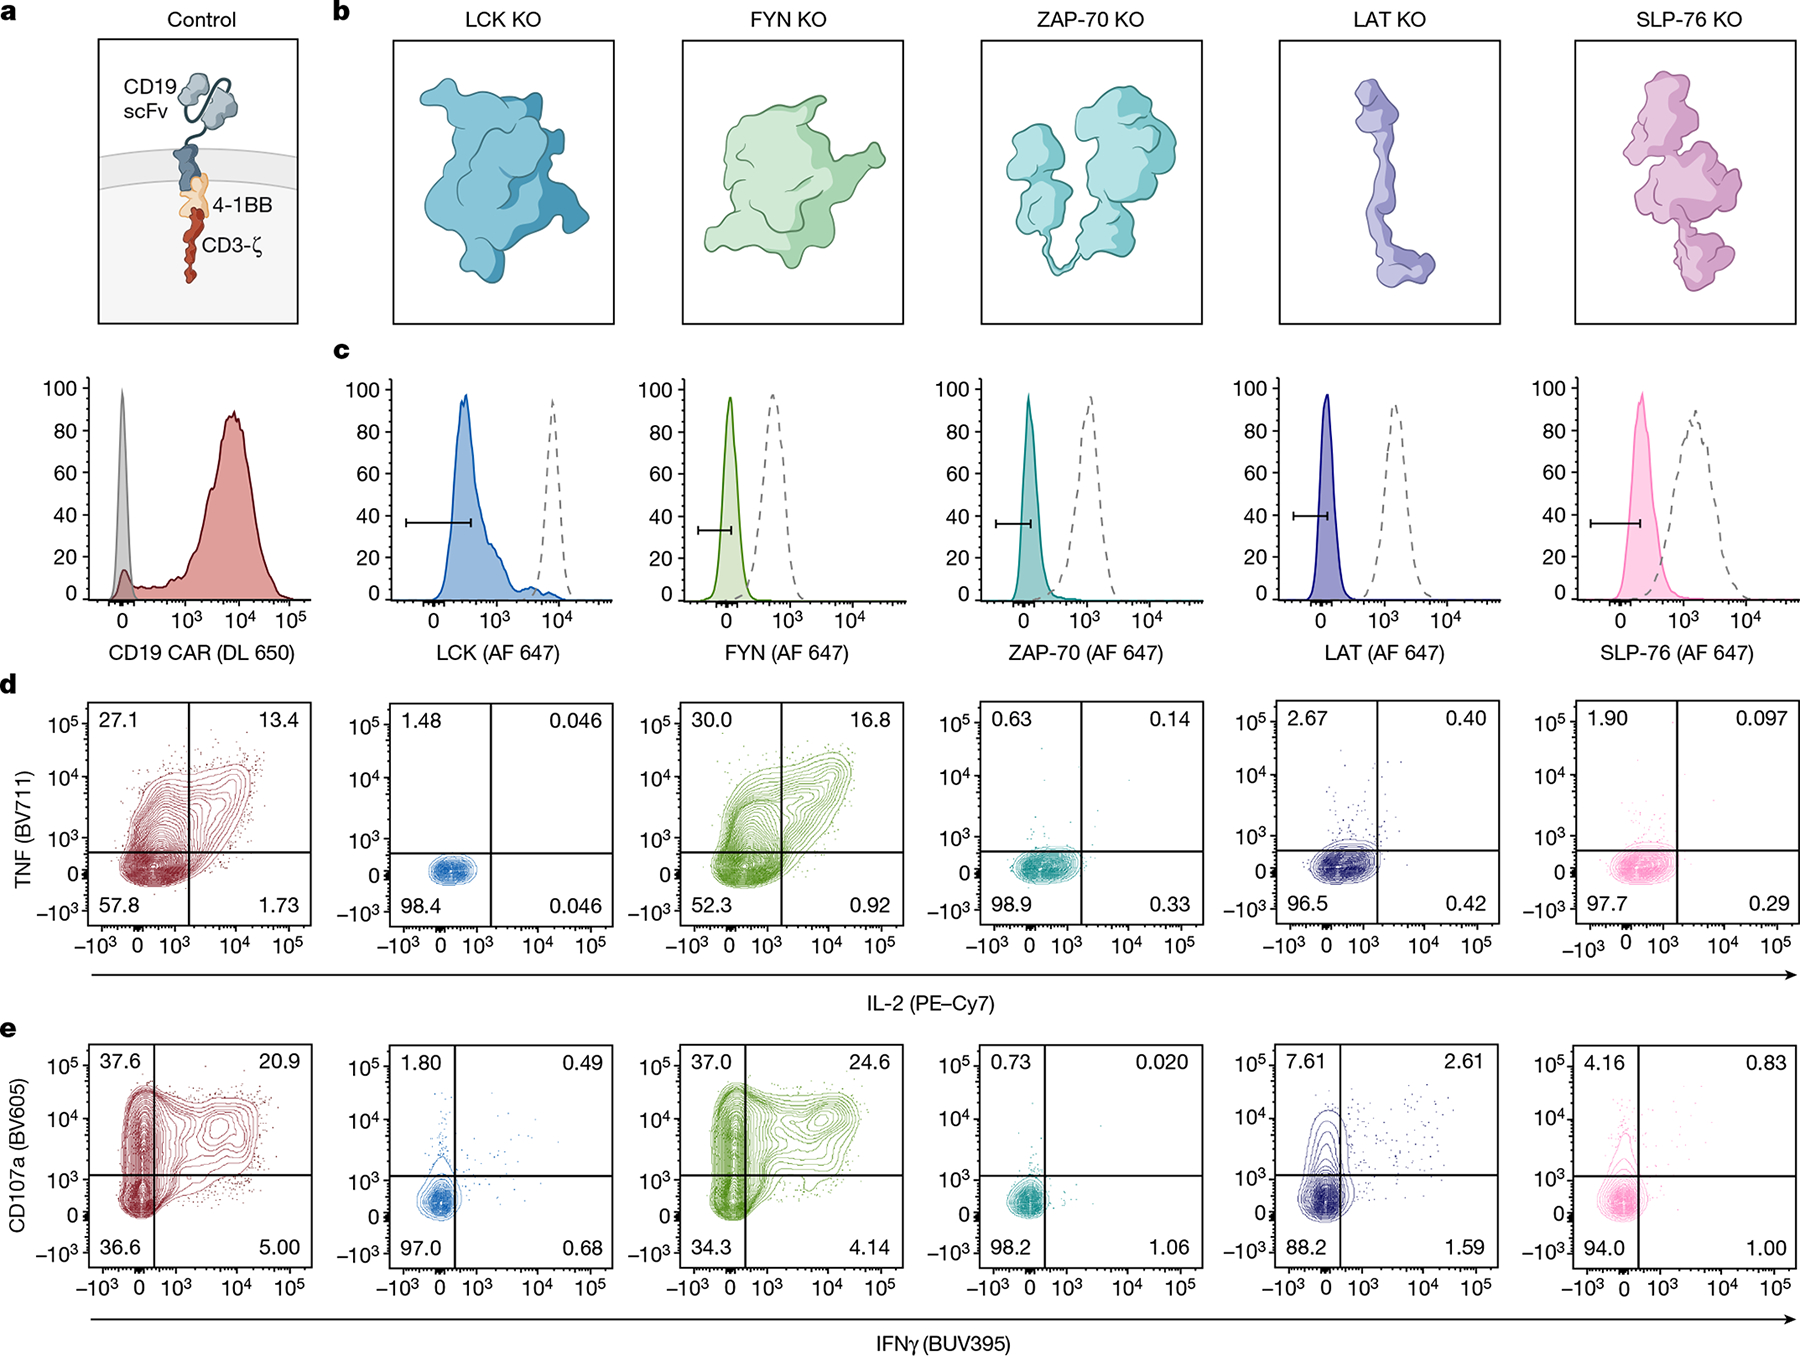
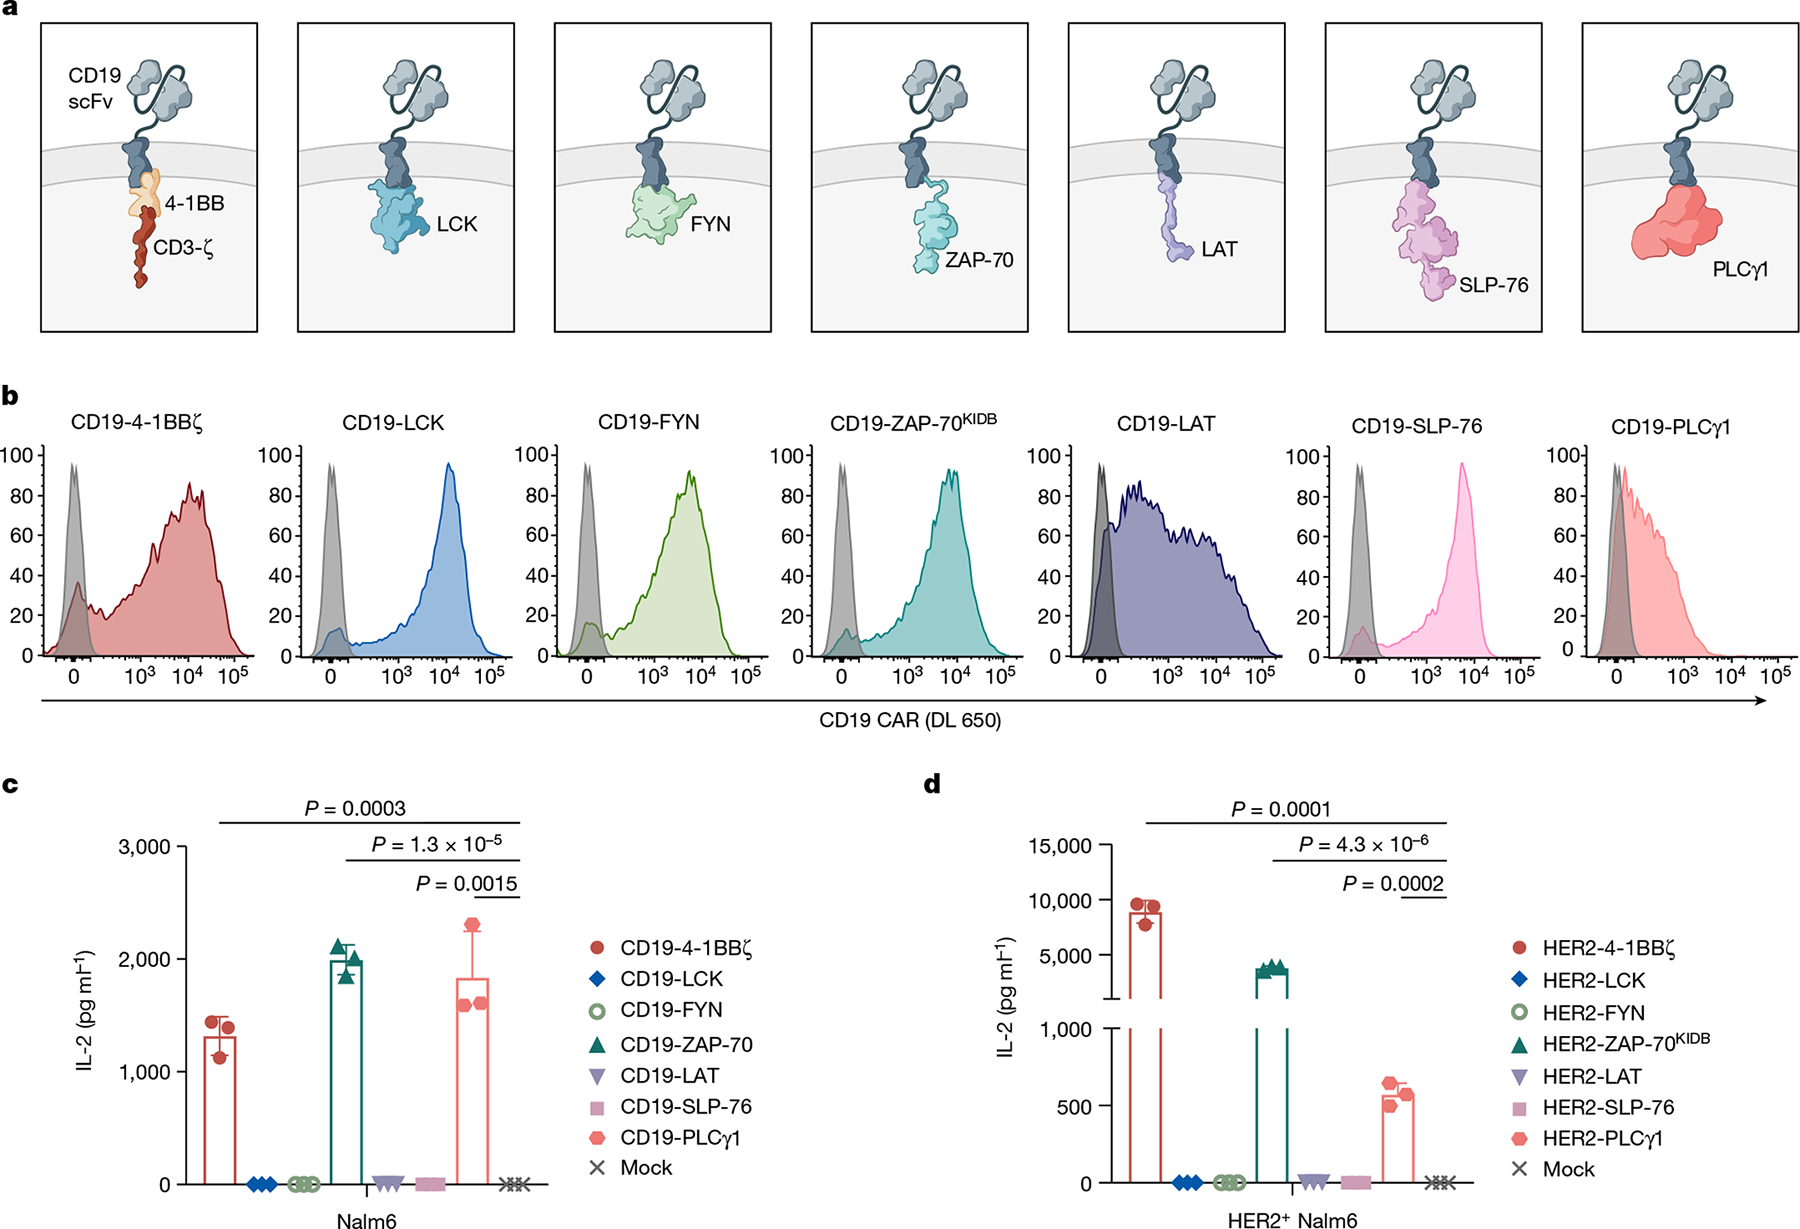
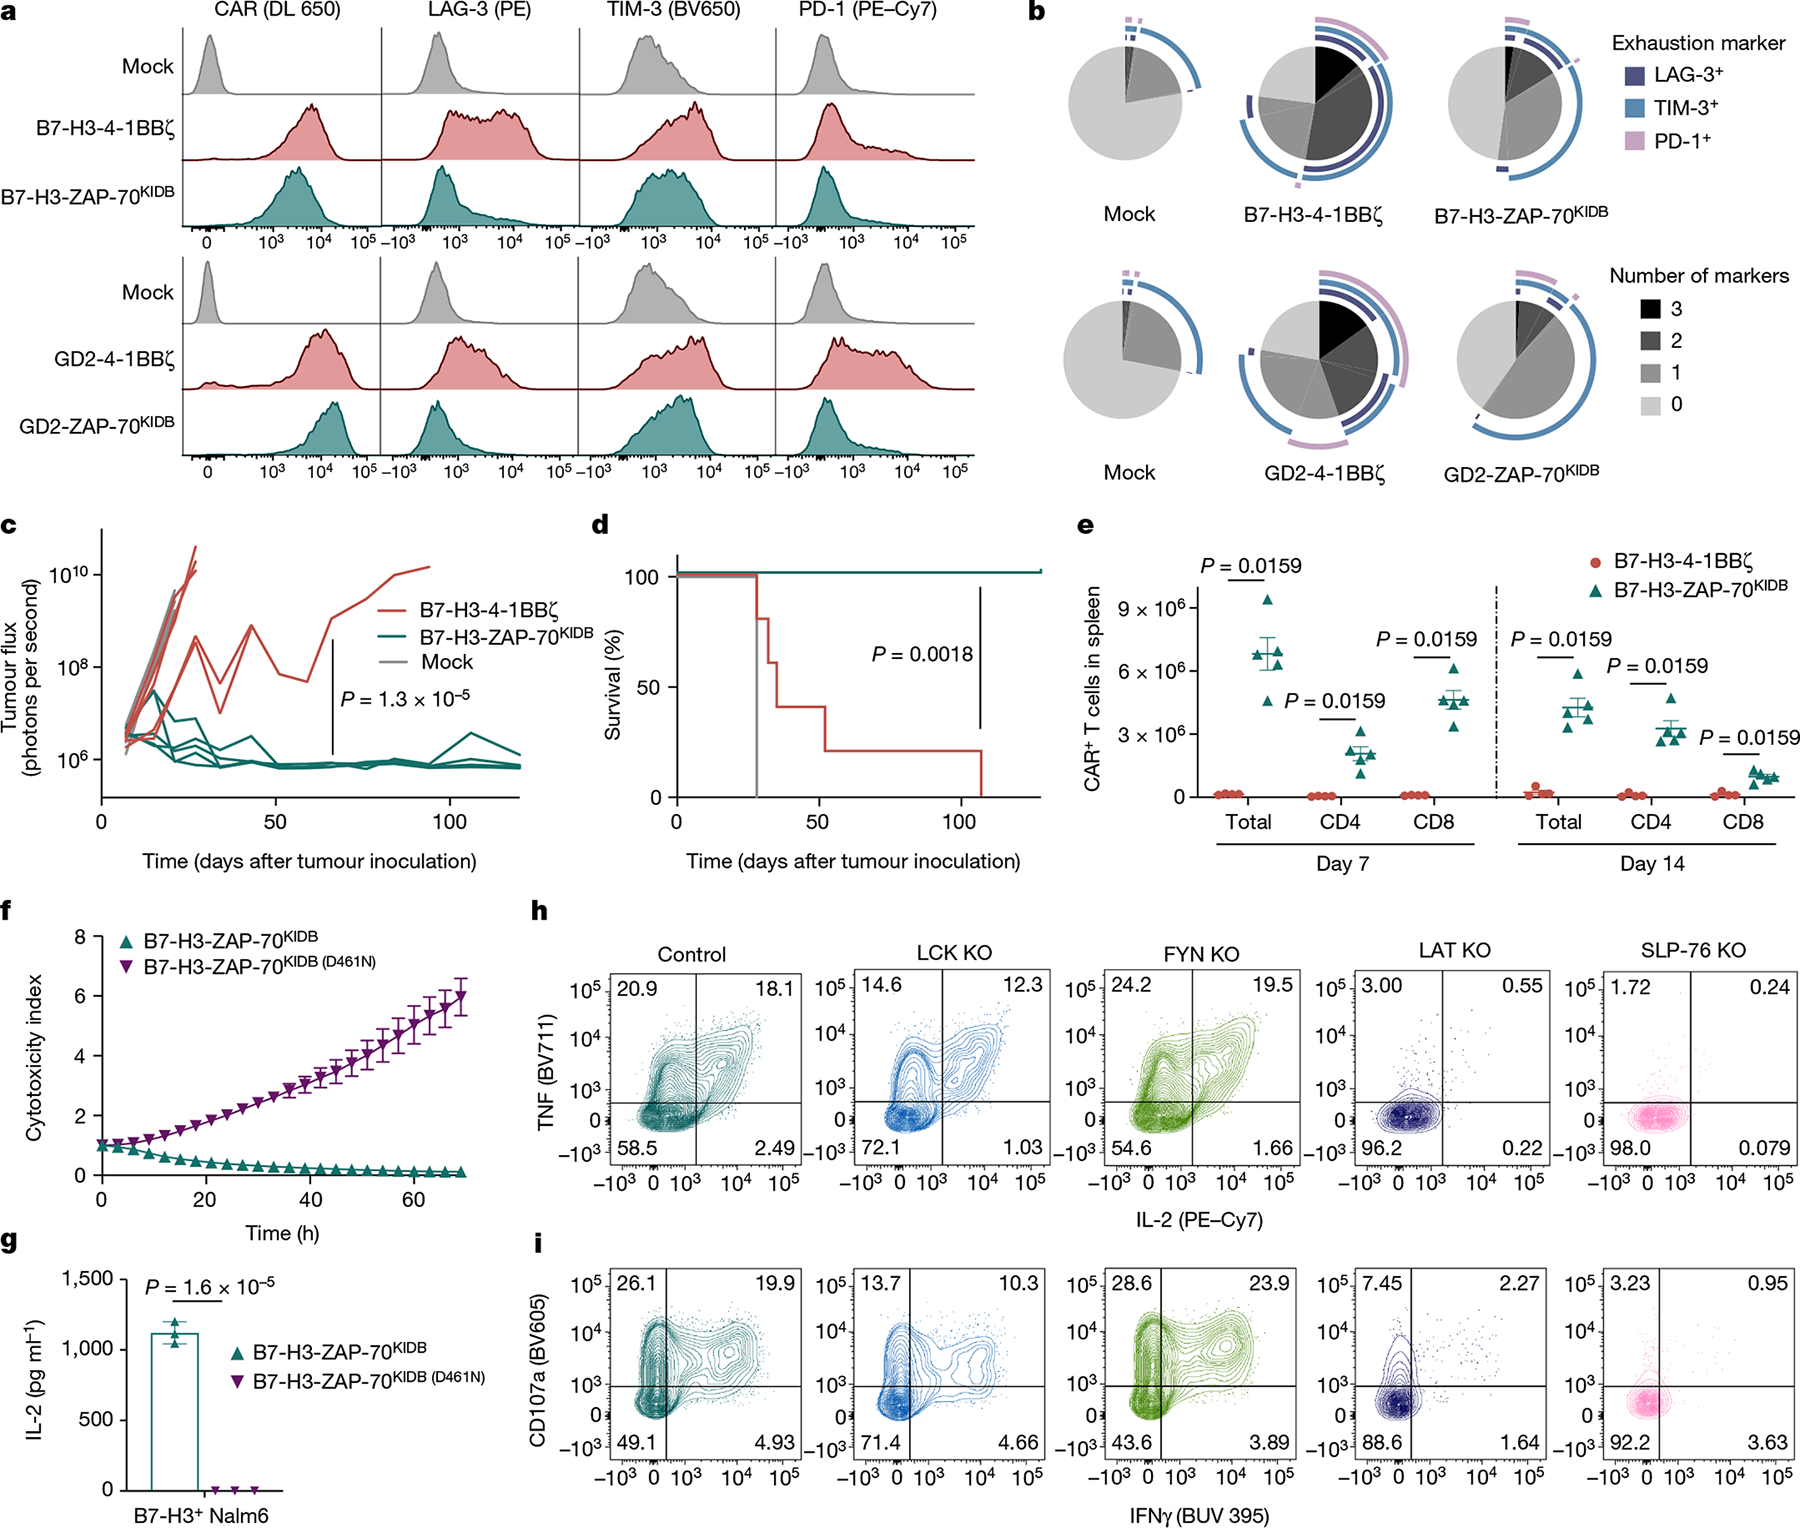
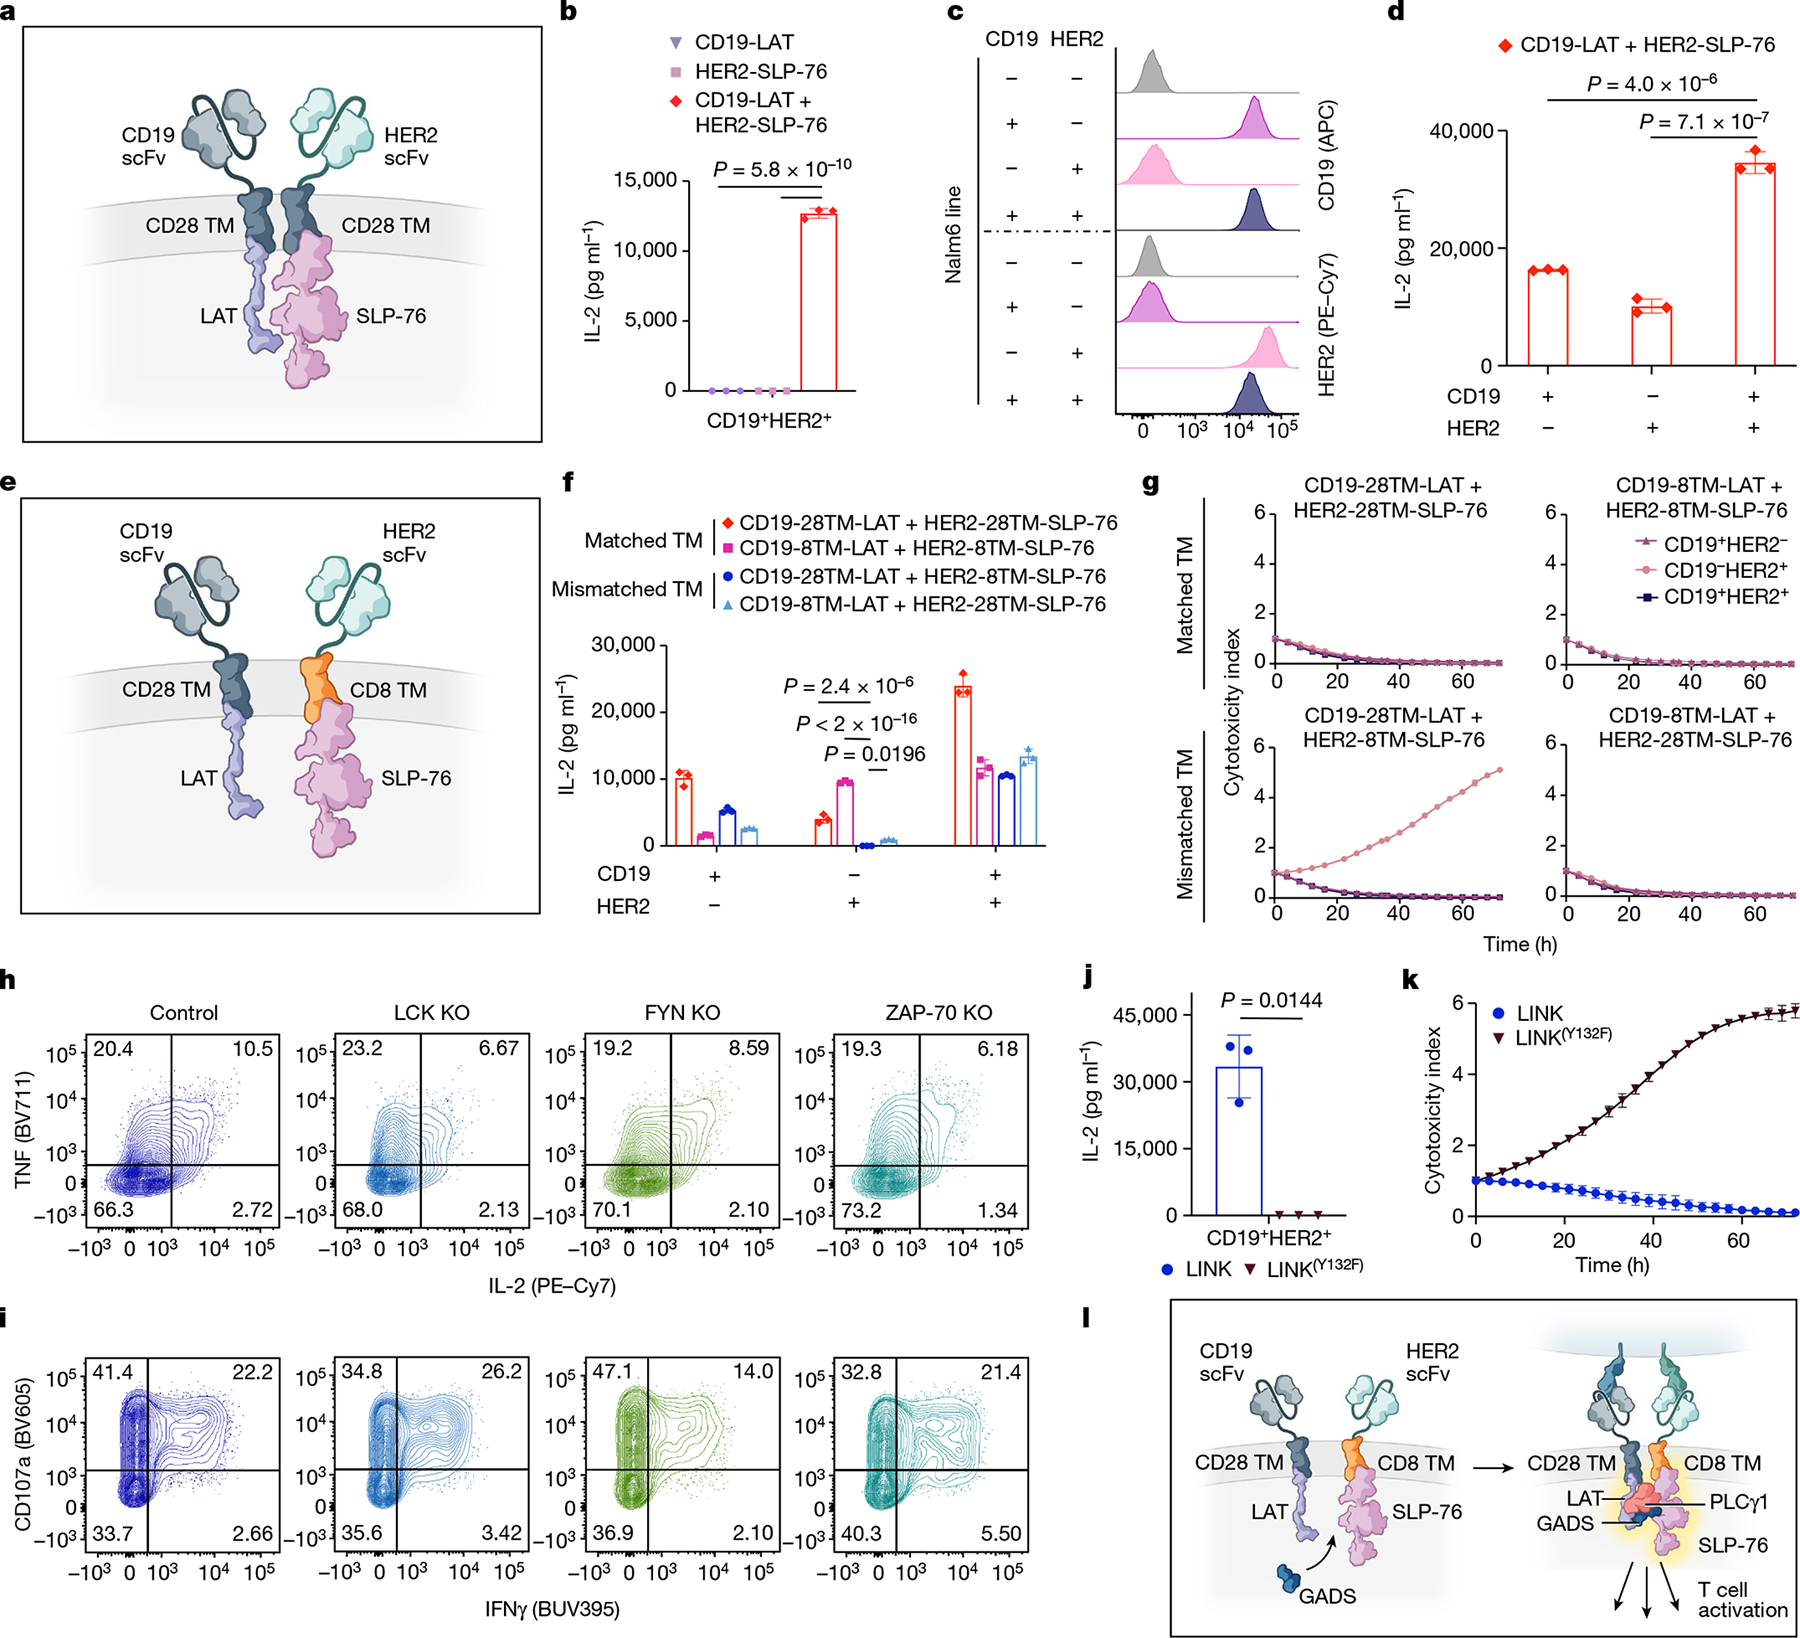
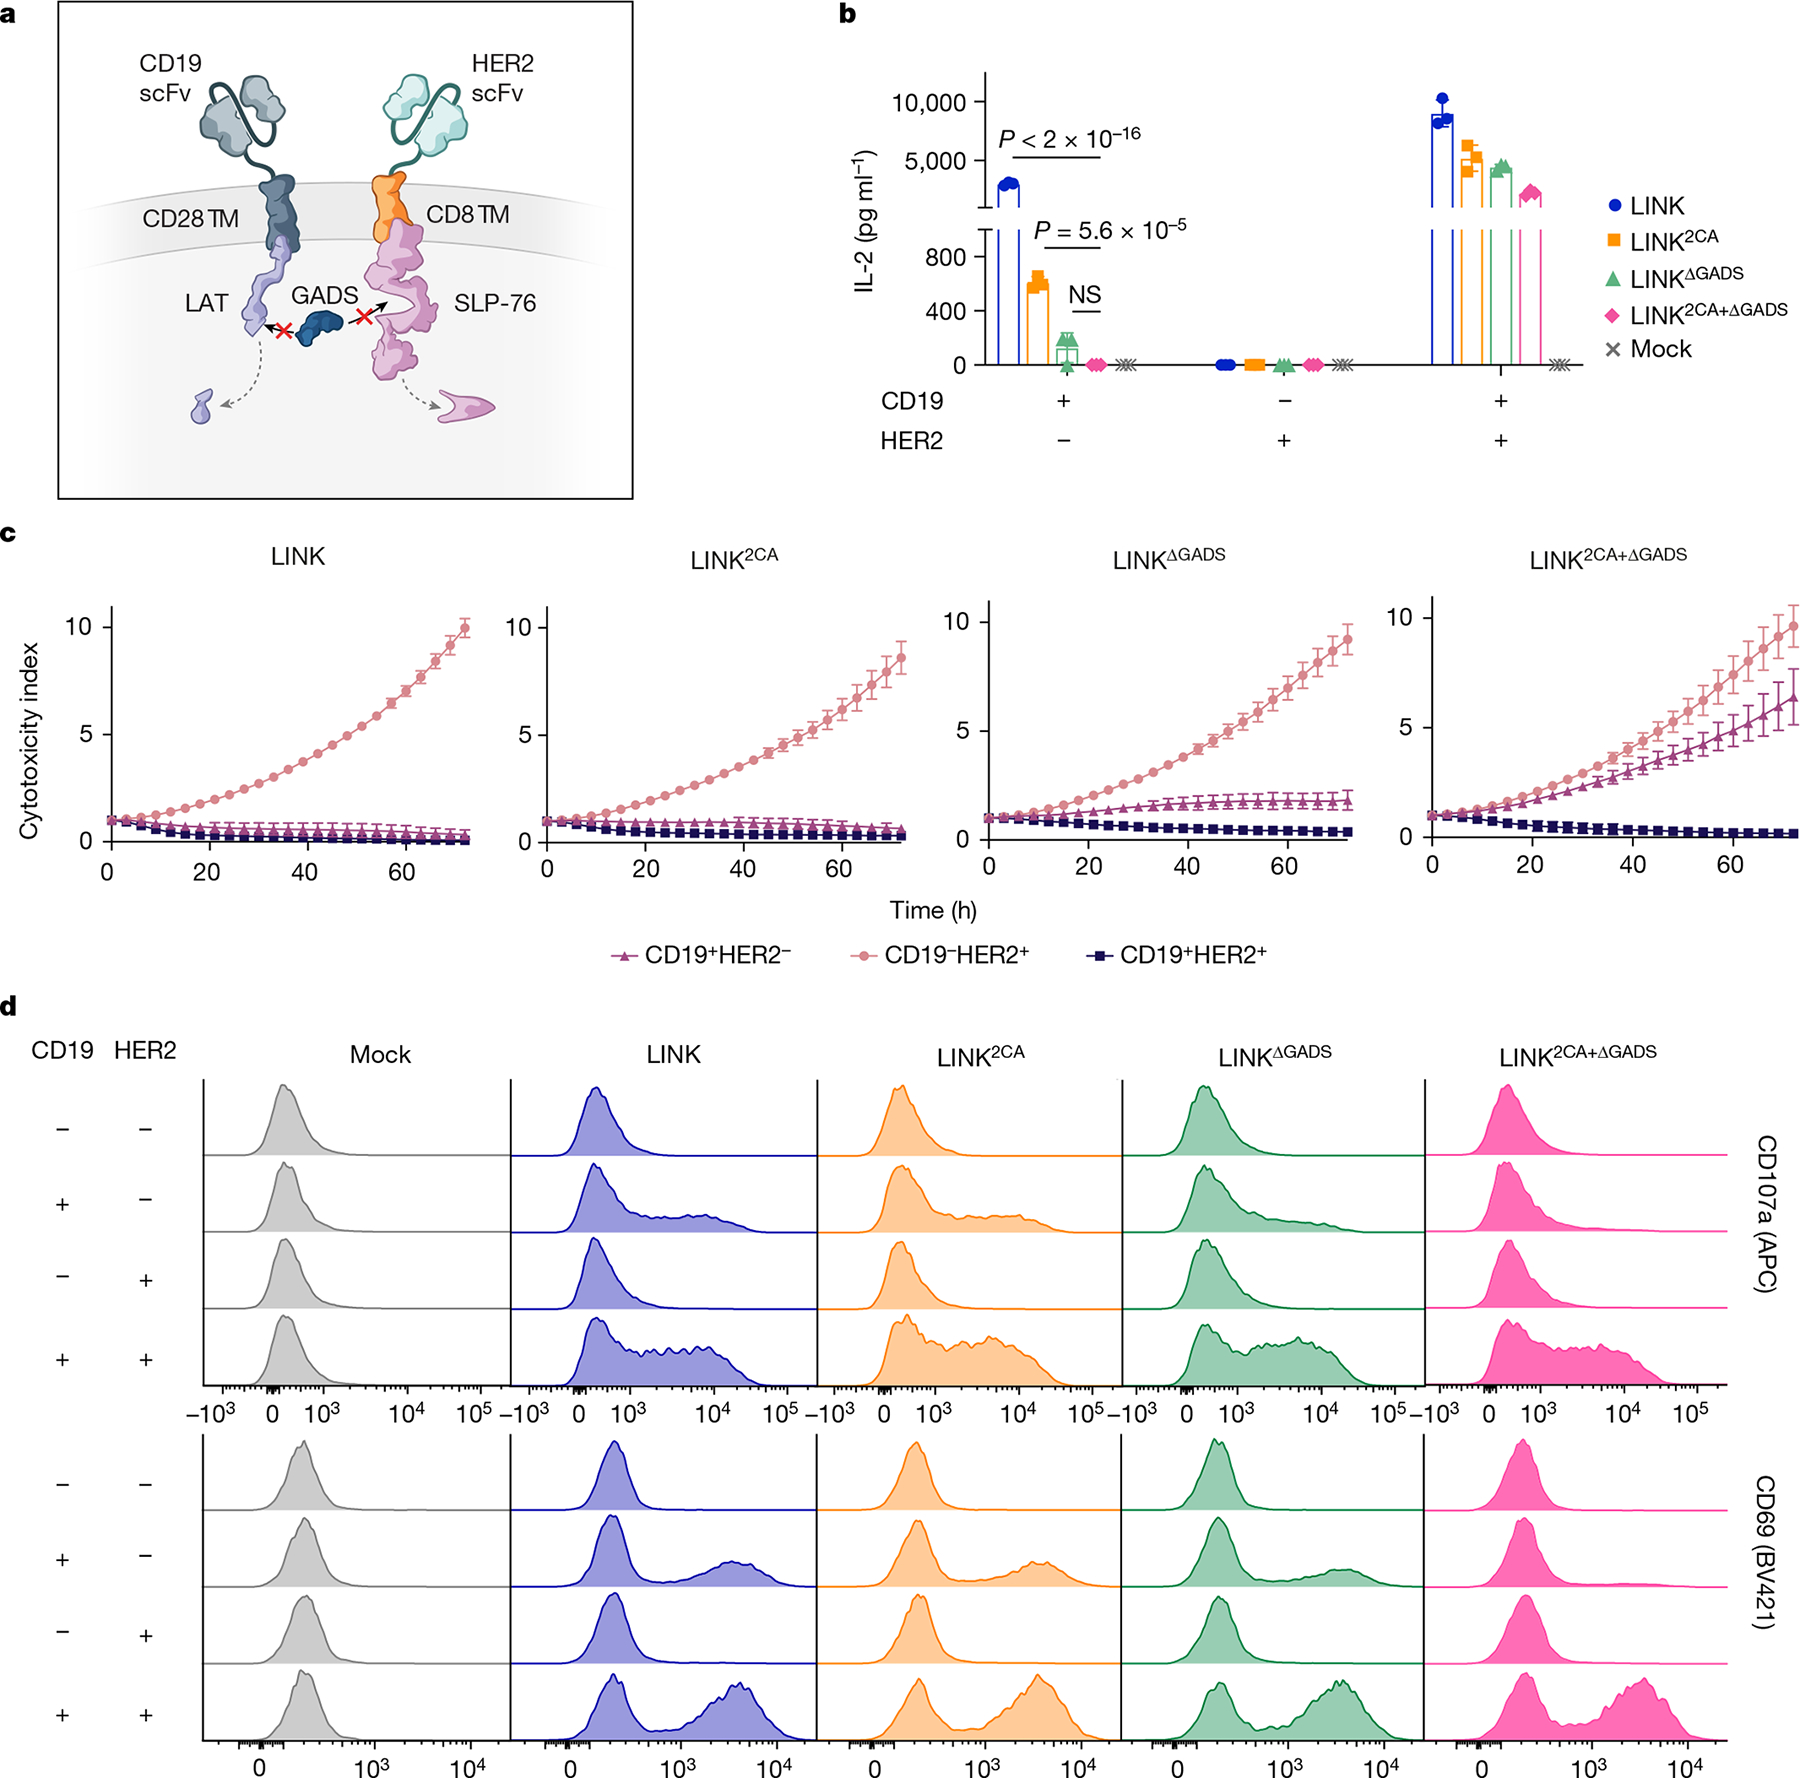
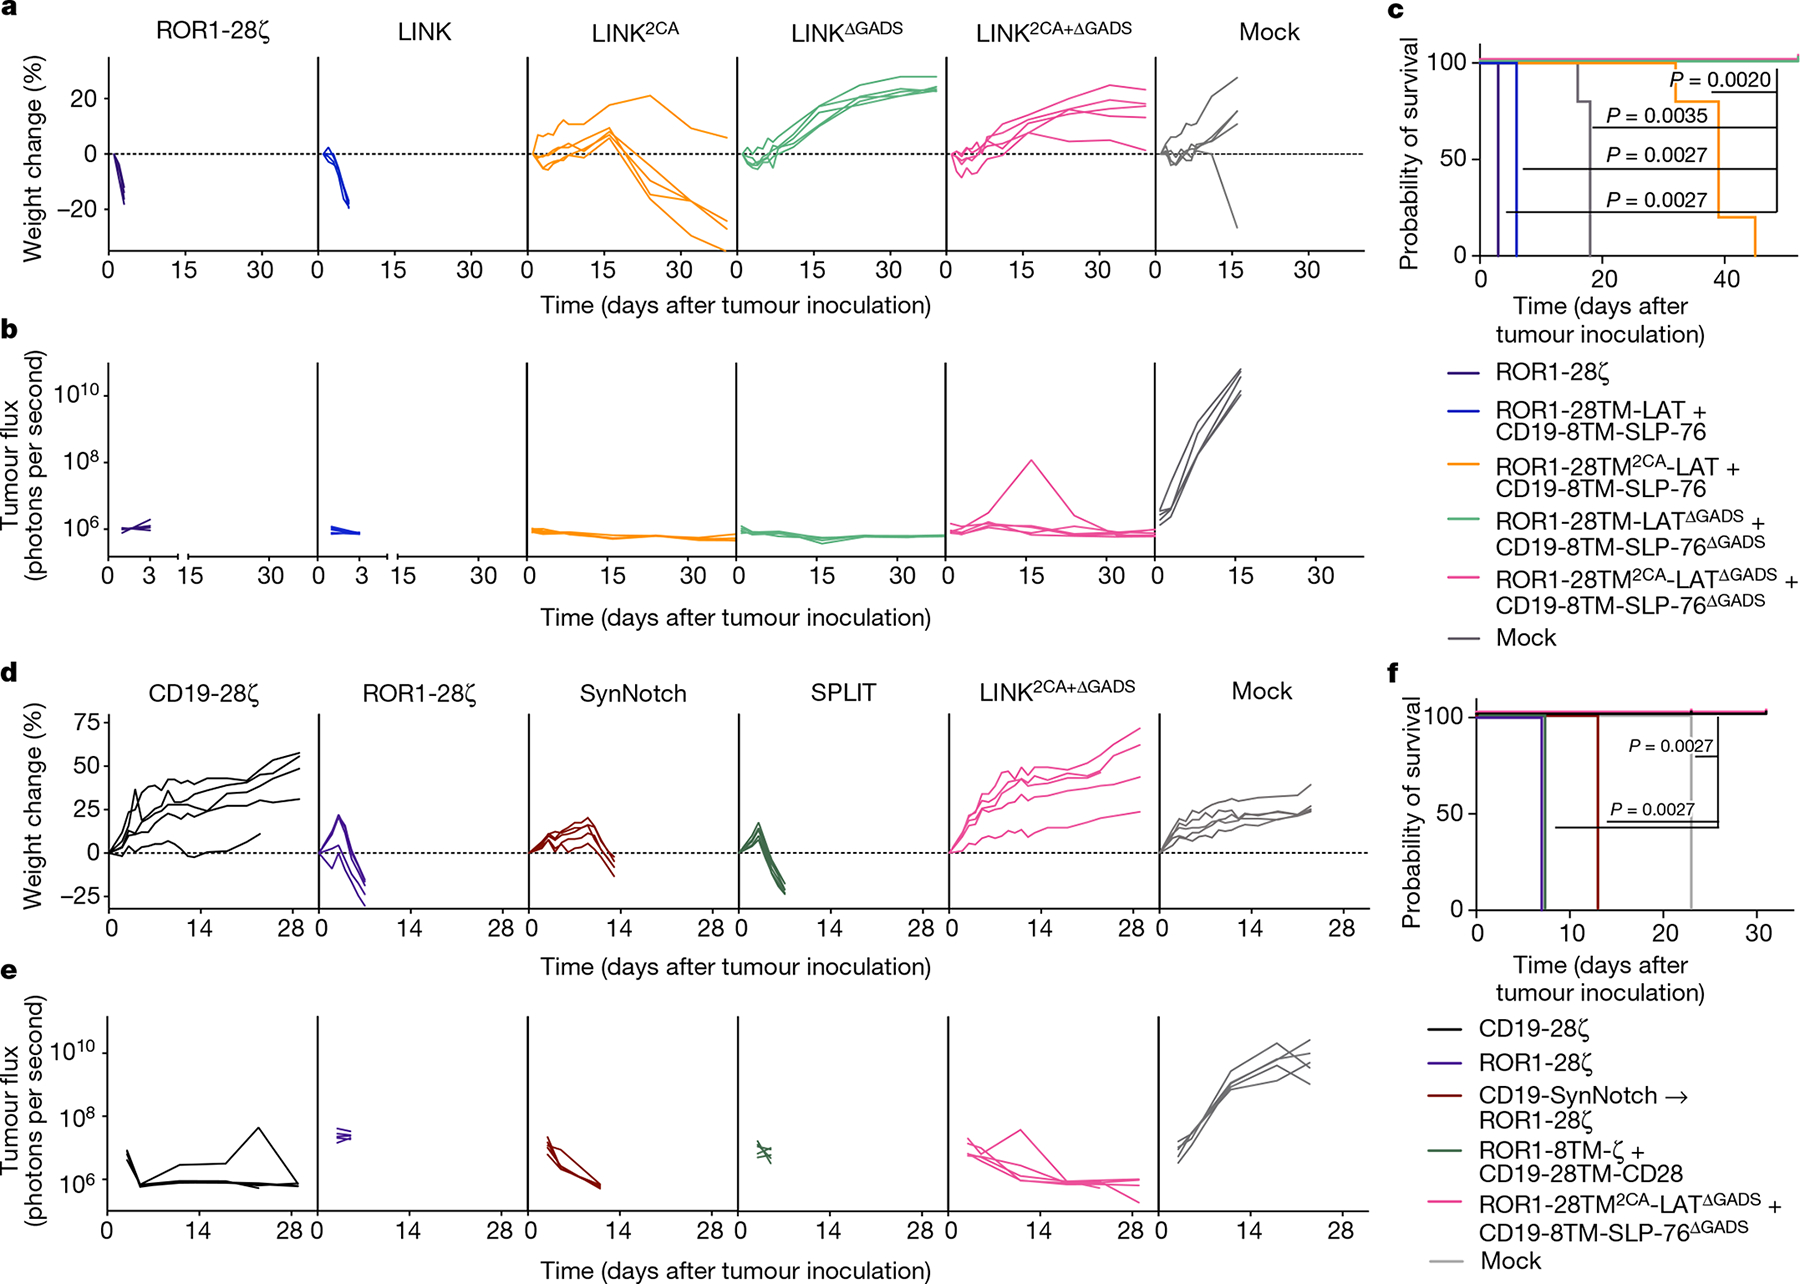
Although chimeric antigen receptor (CAR) T cells have altered the treatment landscape for B cell malignancies, the risk of on-target, off-tumour toxicity has hampered their development for solid tumours because most target antigens are shared with normal cells1,2. Researchers have attempted to apply Boolean-logic gating to CAR T cells to prevent toxicity3-5; however, a truly safe and effective logic-gated CAR has remained elusive6. Here we describe an approach to CAR engineering in which we replace traditional CD3ζ domains with intracellular proximal T cell signalling molecules. We show that certain proximal signalling CARs, such as a ZAP-70 CAR, can activate T cells and eradicate tumours in vivo while bypassing upstream signalling proteins, including CD3ζ. The primary role of ZAP-70 is to phosphorylate LAT and SLP-76, which form a scaffold for signal propagation. We exploited the cooperative role of LAT and SLP-76 to engineer logic-gated intracellular network (LINK) CAR, a rapid and reversible Boolean-logic AND-gated CAR T cell platform that outperforms other systems in both efficacy and prevention of on-target, off-tumour toxicity. LINK CAR will expand the range of molecules that can be targeted with CAR T cells, and will enable these powerful therapeutic agents to be used for solid tumours and diverse diseases such as autoimmunity7 and fibrosis8. In addition, this work shows that the internal signalling machinery of cells can be repurposed into surface receptors, which could open new avenues for cellular engineering.


Conflict of interest statement

Competing interests A.M.T., R.G.M., M.C.R., L.L. and C.L.M. are inventors on a pending patent application (PCT/US2022/017544, applicant: The Board of Trustees of the Leland Stanford Junior University) for the novel CARs described in this manuscript. R.G.M. and C.L.M. are co-founders of and hold equity in Link Cell Therapies. R.G.M., C.L.M. and L.L. are co-founders of and hold equity in Cargo Therapeutics (formerly Syncopation Life Sciences). C.L.M. is a co-founder of and holds equity in Lyell Immunopharma. R.G.M., L.L. and E.W.W. are consultants for and hold equity in Lyell Immunopharma. S.P.R. is a former employee of and holds equity in Lyell Immunopharma. R.G.M. is a consultant for NKarta, Arovella Pharmaceuticals, Innervate Radiopharmaceuticals, GammaDelta Therapeutics, Aptorum Group, Zai Labs, Immunai, Gadeta, FATE Therapeutics (DSMB) and Waypoint Bio. A.T.S. is a founder of Immunai and Cartography Biosciences and receives research funding from Allogene Therapeutics and Merck Research Laboratories. C.L. is a consultant for Cartography Biosciences. A.M.T. and M.C.R. are consultants for and hold equity in Link Cell Therapies. A.M.T. is a consultant for and holds equity in Cargo Therapeutics (formerly Syncopation Life Sciences). E.W.W. is a consultant for and holds equity in VISTAN Health and consults for Umoja Biopharma. The remaining authors declare no competing interests.

Figures

Extended Data Fig. 1 |
Extended Data Fig. 1 |. Required proximal signalling molecules for CD19-4-1BBζ and CD19-CD28ζ CAR signalling.
a, Schematic illustrating the TCR signalling pathway wherein LCK phosphorylates ITAM motifs in CD3ζ, creating a binding site for ZAP-70. ZAP-70 is then activated and phosphorylates adaptor proteins LAT and SLP-76. LAT and SLP-76 then form a scaffold for the recruitment of PLCγ1 and other downstream effector molecules that initiate T cell activation. b, Flow cytometric data exhibiting CD19-4-1BBζ CAR expression in unedited and edited T cells prior to stimulation. c, Quantification of TNF+IL-2+ and CD107a+IFNγ+ populations in edited CD19-4-1BBζ CAR T cells as shown in Fig. 1d,e. Baseline measurements from the unstimulated controls were subtracted from stimulated conditions. Shown are mean values ± s.d. of three experimental replicates. Data is representative of 3 independent experiments with different blood donors. Groups were compared using one-way ANOVA with correction for multiple comparisons (p < 2 × 10 for no guide vs LCK KO, no guide vs ZAP-70 KO, no guide vs LAT KO, and no guide vs SLP-76 KO). d, Flow cytometric data exhibiting CD19-CD28ζ CAR expression in unedited and edited T cells prior to stimulation. e, Flow cytometric plots demonstrating knockout efficiencies for proximal signalling molecules in CAR T cells shown in d. f,g, After CRISPR/Cas9-mediated knockout of the indicated proximal signalling molecules, CD19-CD28ζ CAR T cells were stimulated with Nalm6 tumour cells. Shown is flow cytometric data of TNF × IL-2 (f) and CD107a × IFNγ (g) in knockout populations designated in e. h, Quantification of TNF+IL-2+ and CD107a+IFNγ+ populations in edited CD19-CD28ζ CAR T cells as shown in f,g. Baseline measurements from the unstimulated controls were subtracted from stimulated conditions. Shown are mean values ± s.d. of three experimental replicates. The experiment shown in f-h was performed one time. Groups were compared using one-way ANOVA with correction for multiple comparisons (p < 2 × 10 for no guide vs LCK KO, no guide vs ZAP-70 KO, no guide vs LAT KO, and no guide vs SLP-76 KO). i, Schematic illustrating the protein domains of ZAP-70; dashed lines indicate the Kinase + Interdomain B (KIDB) region contained in the ZAP-70KIDB CAR. j, Flow cytometric data exhibiting expression of CD19-ZAP-70, CD19-ZAP-70Kinase, and CD19-ZAP-70KIDB CARs. k, Flow cytometric data exhibiting expression of HER2-targeting proximal signalling CARs.
Extended Data Fig. 2 |
Extended Data Fig. 2 |. ZAP-70 CAR T cells show potent in vitro and in vivo activity.
a, Representative flow cytometric plots of CAR, LAG-3, TIM-3, and PD-1 expression for T cells bearing CD19 or HER2-specific CARs containing 4-1BBζ or ZAP-70KIDB endodomains (day 10 after T cell activation). Representative of three experiments with different blood donors. b, IFNγ secretion (as measured by ELISA) by GD2-4-1BBζ and GD2-ZAP-70KIDB CAR T cells following 24-h culture in the absence of target cells. Shown are mean values ± s.d. of three experimental replicates. Representative of three experiments with different blood donors. Groups were compared with the unpaired t-test (two-tailed). c, IL-2 secretion by B7-H3 or GD2-specific CAR T cells containing ZAP-70KIDB or 4-1BBζ endodomains following co-culture with Nalm6 cells expressing B7-H3/GD2 or 143B osteosarcoma cells. Shown are mean values ± s.d. of three experimental replicates. Representative of four independent experiments with different blood donors. Groups were compared with the unpaired t-test (two-tailed). d, Tumour cell killing of GFP+ human neuroblastoma CHLA-255 cells co-cultured with B7-H3 or GD2-specific CAR T cells containing ZAP-70KIDB or 4-1BBζ endodomains at a 1:1 ratio of T cells to tumour cells. Shown are mean values ± s.d. of three experimental replicates. Representative of four independent experiments with different blood donors. e, Percent CAR+ T cells recovered from the bone marrow of CHLA-255-bearing mice on days 7 and 14 after treatment with 1 × 10⁷ B7-H3-4-1BBζ or B7-H3-ZAP-70KIDB CAR T cells 7 days after tumour inoculation. Shown are mean values ± s.e.m. for n = 5 mice (B7-H3-ZAP-70KIDB) or n = 4 mice (B7-H3-4-1BBζ) per group per time point. Experiment was performed once at two time points. Groups were compared with the Mann–Whitney test (two-tailed). f, Absolute number of CAR T cells recovered from the spleens of CHLA-255-bearing mice on day 28 after treatment with 1 × 10⁷ B7-H3-4-1BBζ or B7-H3-ZAP-70KIDB CAR T cells. Shown are mean values ± s.e.m. for n = 4 mice. Experiment was performed once. Groups were compared with the Mann–Whitney test (two-tailed). g,h, NSG mice bearing CHLA-255-luciferase xenografts were treated intravenously with 3 × 10⁶ B7-H3-ZAP-70KIDB CAR T cells on day 7 post CHLA-255 engraftment, then rechallenged with B7-H3+Nalm6-luciferase or WT B7-H3Nalm6-luciferase leukaemia lines on day 30 post initial tumour engraftment (dashed vertical line). g, Quantification of tumour progression for each individual mouse as measured by flux values acquired by BLI. h, Survival curves for mice bearing tumours shown in g. Experiment was performed once with n = 5 mice per group. Tumour growth in g was compared between groups using repeated measures one-way ANOVA with correction for multiple comparisons and survival in h was compared with the log-rank test. i, Flow cytometric plots of CAR expression on B7-H3-CD28ζ, B7-H3-CD28ζ(1XX), B7-H3-ζ(1XX), or B7-H3-ZAP-70KIDB CAR T cells (day 10 after T cell activation). j, NSG mice bearing 143B osteosarcoma xenografts were treated intravenously with 1 × 10⁷ B7-H3-CD28ζ, B7-H3-CD28ζ(1XX), B7-H3-ζ(1XX), or B7-H3-ZAP-70KIDB CAR T cells on day 13 post tumour inoculation. Tumours were measured at least twice weekly, and tumour area was calculated as the product of the tumour width and depth. Experiment was performed one time with n = 5 mice per group (n = 6 mice for B7-H3-CD28ζ, n = 4 mice for B7-H3-ζ(1XX)). Tumour growth curves were compared with repeated measures one-way ANOVA with correction for multiple comparisons.
Extended Data Fig. 3 |
Extended Data Fig. 3 |. ZAP-70KIDB CAR T cells show distinct transcriptomic profiles.
a, Uniform manifold approximation and projection (UMAP) embedding visualization showing overlaid B7-H3-4-1BBζ versus B7-H3-ZAP-70KIDB CAR T cells ± stimulation with B7-H3+Nalm6. b, UMAP embedding visualization showing an overlay annotating the three CAR T cell donors. c, Numbers of differentially expressed genes in B7-H3-4-1BBζ versus B7-H3-ZAP-70KIDB CAR T cells ± stimulation with B7-H3+Nalm6. Differentially expressed genes were defined by a Benjamini–Hochberg adjusted p-value < 0.01 and abs(logFC) > 0.5 from Seurat’s FindMarkers function (two-sided Wilcoxon signed rank test). d, Violin plots characterizing single-cell gene expression modules for T cell exhaustion (left panel; n = 61 genes) and T cell memory signature (right panel; n = 69 genes) in unstimulated B7-H3-4-1BBζ versus B7-H3-ZAP-70KIDB CAR T cells. Module scores were computed using the FindModuleScores function in Seurat. Comparisons were performed with the Mann–Whitney (two-tailed) test. e, UMAP embedding analysis showing KLF2 expression in overlaid B7-H3-4-1BBζ versus B7-H3-ZAP-70KIDB CAR T cells ± stimulation with B7-H3+Nalm6. f, Heat map exhibiting differentially expressed subsets of genes associated with T cell effector, exhaustion, function, and memory signalling pathways in B7-H3-4-1BBζ versus B7-H3-ZAP-70KIDB CAR T cells ± stimulation with B7-H3+Nalm6.
Extended Data Fig. 4 |
Extended Data Fig. 4 |. ZAP-70KIDB CAR T cells exhibit phosphorylation of key signalling molecules with reduced baseline activation.
a,b, GD2-4-1BBζ, GD2-ZAP-70KIDB, GD2-CD28ζ and CD19-4-1BBζ CAR T cells were stimulated for 5, 15 or 45 min with anti-idiotype antibody-coated beads at a 4:1 bead to T cell ratio. a, Phospho-PLCg1S1248, total PLCg1, phospho-SLP-76S376, total SLP-76, phospho-AKT1/2/3S473, total AKT1/2/3, phospho-ERK1/2T202 Y204, total ERK1/2, phospho-NF-κBS536, total NF-κB, and phospho-c-JUNS73, were measured by western blot. b, Densitometric quantifications of phosphorylation levels observed in a, normalized to the unstimulated conditions. Intensities of phospho-protein bands were normalized to that of each correspondent total protein. Fold change in band intensity was calculated relative to unstimulated sample. Data in a and b is representative of two experiments with different blood donors. Uncropped data with molecular weight markers is displayed in Supplementary Fig. 2.
Extended Data Fig. 5 |
Extended Data Fig. 5 |. ZAP-70KIDB CARs depend on ZAP-70 kinase activity on LAT and SLP-76.
a, Flow cytometric data exhibiting surface CAR and intracellular CD247/CD3ζ expression of B7-H3-ZAP-70KIDB (± CD247 CRISPR–Cas9 knockout) (left panel), and IL-2 secretion (right panel) by B7-H3-ZAP-70KIDB (± CD247 knockout) CAR T cells following co-culture with B7-H3+Nalm6 cells or anti-CD3/anti-CD28 beads. Shown are mean values ± s.d. of three experimental replicates. Performed one time. b, Flow cytometric data exhibiting surface CAR and CD3 expression of B7-H3-ZAP-70KIDB (± TRAC knockout) (left panel), and IL-2 secretion (right panel) by B7-H3-ZAP-70KIDB (± TRAC knockout) CAR T cells following co-culture with B7-H3+Nalm6 cells or anti-CD3/anti-CD28 beads. Shown are mean values ± s.d. of three experimental replicates. Representative of two experiments with different blood donors. c, Flow cytometric data exhibiting the expression of B7-H3-ZAP-70KIDB CARs ± D461N mutation. d, Flow cytometric data exhibiting B7-H3-ZAP-70KIDB CAR expression in unedited and edited T cells prior to stimulation. e, Flow cytometric plots demonstrating knockout efficiencies for proximal signalling molecules in CAR T cells shown in d. f, Quantification of TNF+IL-2+ and CD107a+IFNγ+ populations as shown in Fig. 3h,i. Baseline measurements from the unstimulated controls were subtracted from the stimulated conditions. Shown are mean values ± s.d. of three experimental replicates. Representative of three experiments performed with two different blood donors. Groups were compared via one-way ANOVA with correction for multiple comparisons.
Extended Data Fig. 6 |
Extended Data Fig. 6 |. LAT and SLP-76 CARs jointly mediate T cell activation.
a, Flow cytometric data exhibiting CAR expression of co-transduced CD19 and HER2 proximal signalling CAR (LCK, FYN, LAT, and SLP-76) combinations. b, IL-2 secretion (as measured by ELISA) by T cells shown in a following co-culture with CD19+HER2+Nalm6 cells. Shown are mean values ± s.d. of three experimental replicates. Representative of four experiments performed with three different blood donors. Statistical comparisons performed with one-way ANOVA with correction for multiple comparisons (p < 2 × 10 for all comparisons to CD19-LAT + HER2-SLP-76). c, Flow cytometric expression of LAT and SLP-76 CARs on T cells utilized in Fig. 4f,g. d, Schematic illustrating incorporation of a dual Cysteine-to-Alanine (2CA) mutation in the CD28 hinge–TM domain of the LAT CAR component of the LINK system. e, Flow cytometric data exhibiting LINK CAR (±2CA mutation) expression. f,g, IL-2 secretion (f) and tumour cell killing (g) by LINK CAR T cells (±2CA mutation) following co-culture with indicated cell lines. Shown are mean values ± s.d. of three experimental replicates. Representative of eight independent experiments performed with five different blood donors. Comparisons in f performed with unpaired t-test (two-tailed). h, Flow cytometric data exhibiting LINK CAR (CD19-28TM-LAT + HER2-8TM-SLP-76) expression in unedited and edited T cells before stimulation with CD19+HER2+ Nalm6. i, Flow cytometric plots demonstrating knockout efficiencies for proximal signalling molecules in CAR T cells utilized in Fig. 4h,i. j, Quantification of TNF+IL-2+ and CD107a+IFNγ+ populations as shown in Fig. 4h,i. Baseline measurements from the unstimulated controls were subtracted from the stimulated conditions. Shown are mean values ± s.d. of three experimental replicates. Comparisons were performed via one-way ANOVA with correction for multiple comparisons. Representative of two independent experiments with different blood donors. k, Flow cytometric expression of LINK CAR (±LAT Y132F).
Extended Data Fig. 7 |
Extended Data Fig. 7 |. Disrupting GADS interactions eliminates LINK CAR leakiness.
a, Schematic illustrating LINK CAR bearing both the Cysteine-to-Alanine (2CA) mutations and GADS-binding site deletions/truncations (ΔGADS). b, Flow cytometric expression of LINK CARs (±2CA, ±ΔGADS) on T cells utilized in Fig. 5b–d. c, Quantification of CD107a+ and CD69+ on indicated LINK CAR T cells following co-culture with indicated cell lines as shown in Fig. 5d. Representative of five independent experiments with four different blood donors. Shown are mean values ± s.d. of three experimental replicates. Comparisons were performed with one-way ANOVA with correction for multiple comparisons. d, Flow cytometric expression of LINK CAR T cells bearing either Y171F/Y191F point mutations (2YF) or deletion/truncation of the GADS-binding regions (ΔGADS). e, IL-2 secretion (as measured by ELISA) by indicated LINK CAR T cells following co-culture with indicated cell lines shown in Fig. 4c. Representative of two independent experiments with different blood donors. Shown are mean values ± s.d. of three experimental replicates. Note that data for CD19-28TM-LAT + HER2-8TM-SLP-76 and CD19-28TM-LATΔGADS + HER2-8TM-SLP-76ΔGADS conditions are identical to Fig. 5b. Comparisons were performed via one-way ANOVA with correction for multiple comparisons. f, Tumour cell killing of Nalm6 by CD19-CD28ζ, CD19–4-1BBζ, LINK (CD19-28TM-LAT + CD19-8TM-SLP-76), or LINK2CA+ΔGADS (CD19-28TM2CA-LATΔGADS + CD19-8TM-SLP-76ΔGADS) CAR T cells at a 1:1 ratio of T cells to tumour cells. Shown are mean values ± s.d. of three experimental replicates. Representative of three independent experiments with different blood donors.
Extended Data Fig. 8 |
Extended Data Fig. 8 |. Testing ROR1-targeting CARs in a model of on-target, off-tumour toxicity.
a, Schematic illustrating on-target, off-tumour toxicity in the lungs of tumour-bearing mice treated with ROR1 targeted CAR T cells. b, Flow cytometry plots exhibiting detection of ROR1-CD28ζ CAR on T cells with both recombinant human and mouse ROR1. c, IL-2 secretion (as measured by ELISA) by ROR1-CD28ζ CAR T cells after 24-h incubation with plate-bound human or mouse ROR1 protein at the indicated concentrations. Shown are mean values ± s.d. of three experimental replicates. Representative of three independent experiments with different blood donors. d, ROR1 and CD19 expression on single/double antigen positive Nalm6 lines used for experiments. e, Flow cytometric expression of ROR1-CD28ζ and indicated ROR1-and-CD19-targeted LINK CARs on T cells. f, Tumour cell killing of cell lines shown in d when co-cultured with the indicated CAR T cells at a 2:1 ratio of T cells to tumour cells. Shown are mean values ± s.d. of three experimental replicates. Representative of four independent experiments performed with two different blood donors. g,h, NSG mice bearing ROR1+CD19+Nalm6-luciferase were treated with 3 × 10⁶ CD19-CD28ζ, CD19–4-1BBζ, or indicated LINK CAR T cells 3 days after tumour inoculation. g, Quantification of tumour progression for each individual mouse as measured by flux values acquired by BLI, normalized to tumour-free mice. h, Survival curves for mice bearing tumours shown in g. Performed once with n = 5 mice per group. Comparisons performed by the log-rank test. ik, NSG mice bearing ROR1+CD19+Nalm6-luciferase were treated with 8 × 10⁶ of the indicated CAR+ T cells three days after tumour inoculation. i, Absolute number of CAR+ T cells recovered from spleens on day 28 post treatment. j, Representative flow cytometric plots and k, quantification of CAR+ T central memory cells (TCM, CD45RACD62L+), T stem cell memory cells (TSCM, CD45RA+CD62L+), T effector memory cells (TEM, CD45RACD62L), and T effector memory CD45RA+ cells (TEMRA, CD45RA+CD62L) recovered from the spleens on day 28 post treatment. Data shown in i,k are mean values ± s.e.m. Performed one time with n = 5 mice (CD19–4-1BBζ and LINKΔGADS) or n = 4 mice (CD19-CD28ζ and LINK2CA+ΔGADS) per group. Comparisons made with the Mann–Whitney test (two-tailed).
Extended Data Fig. 9 |
Extended Data Fig. 9 |. Both the LAT and SLP-76 components of LINK CAR protect normal tissues expressing shared antigens.
a, Flow cytometric expression of ROR1-and-CD19-targeted LINK CARs on T cells. b-d, NSG mice bearing ROR1+CD19+Nalm6-luciferase were treated with 8 × 10⁶ of the indicated LINK CAR T cells with the SLP-76 CAR bearing specificity for ROR1 on D+2 following tumour inoculation. b, Weights for individual mice over time plotted as a percentage of the weight on day 0. c, Quantification of tumour progression for each individual mouse as measured by flux values acquired by BLI. (d) Survival curves for mice bearing tumours shown in b,c. Comparisons were performed with the log-rank test. bd was performed once with n = 5 mice per group. eh, To assess on-target, off-tumour toxicity against normal B cells, NSG mice that had been intravenously injected with 2 × 10⁶ human B cells on D-7 and ROR1+CD19+Nalm6-luciferase cells on D-3 were infused with 8 × 10⁶ CD19-CD28ζ, LINK2CA+ΔGADS, or control (anti-CD19 scFv tethered to a CD8 hinge–TM with no signalling domain) CAR T cells from the same blood donor on D0. e, Weights for individual mice over time plotted as a percentage of the weight on day 0. f, Quantification of tumour progression for each individual mouse as measured by flux values acquired by BLI, normalized to tumour-free mice. g, Survival curves for mice bearing tumours shown in e-f. Comparisons performed by the log-rank test. h, Absolute number of CD20+ B cells recovered from the spleens of mice depicted in e-g on day 9 following treatment. Shown are mean values ± s.e.m. for n = 3 mice per group. Comparisons performed with the Mann–Whitney test (two-tailed). Data is representative of three different blood donors.
Extended Data Fig. 10 |
Extended Data Fig. 10 |. LINK CAR outperforms both the SynNotch and the SPLIT CAR system.
a, Schematic illustrating the potential for on-target, off-tumour toxicity for SynNotch CAR T cells. b, Flow cytometric expression of CD19-CD28ζ, ROR1-CD28ζ, ROR1-and-CD19-targeted LINK2CA+ΔGADS, SPLIT (ROR1-8TM-ζ + CD19-28TM-CD28), and SynNotch (CD19-SynNotch → ROR1-CD28ζ) CARs on T cells day 10 after activation. c, Inducible ROR1-CD28ζ CAR expression (detected with recombinant ROR1 protein) following stimulation through the CD19-SynNotch receptor after a 24-h co-culture with CD19+Nalm6. d, Killing of bystander ROR1+CD19 Nalm6-GFP either in the presence of ROR1CD19 Nalm6-TdTomato (top panel) or ROR1+CD19+ Nalm6-TdTomato (bottom panel) by CD19-CD28ζ, LINK, or SynNotch CAR T cells on day 10 post T cell activation. Shown are mean values ± s.e.m. from four independent experiments with different blood donors. eg, NSG mice bearing ROR1+CD19+Nalm6-luciferase were treated with 8 × 10⁶ of the indicated CAR+ T cells three days after tumour inoculation. e, Weights for individual mice over time plotted as a percentage of the weight on day 0. f, Quantification of tumour progression for each individual mouse as measured by flux values acquired by BLI. g, Survival curves for mice bearing tumours shown in e,f. Comparisons performed with the log-rank test. Note: eg is a repeat with a different blood donor of the experiment shown in Fig. 6d–f but without the CD19-CD28ζ group. n = 5 mice per group (n = 4 mice for Mock).
Fig. 1 |
Fig. 1 |. Proximal signalling molecules are necessary to propagate CAR T cell activation.
a, Schematic (top) and flow cytometric CAR expression (bottom) for unedited CD19-4-1BBζ CAR T cells. b, Schematics of the 5 proximal signalling molecules targeted for CRISPR–Cas9-mediated knockout (KO) in CD19-4-1BBζ CAR T cells. c, Flow cytometric plots showing knockout efficiencies for the proximal signalling molecules illustrated in b. Dashed peaks represent the protein expression levels in unedited control cells. d,e, After CRISPR–Cas9-mediated knockout of the proximal signalling molecules depicted in b, CD19-4-1BBζ CAR T cells were stimulated with Nalm6 tumour cells. Flow cytometric data are shown for TNF × IL-2 (d) and CD107a × IFNγ (e) in the knockout populations designated in c. Data in ae are representative of three independent experiments performed with different blood donors.
Fig. 2 |
Fig. 2 |. Proximal signalling molecules are sufficient to propagate CAR T cell activation.
ac, Schematics (a), CAR expression (b) and in vitro activity (c) of CD19-targeting CARs with proximal signalling endodomains. CARs incorporated full-length (LCK, FYN, SLP-76 and PLCγ1), intracellular (LAT), or truncated (ZAP-70KIDB; see Extended Data Fig. 1i–j) domains. In vitro activity was assessed by measurement of IL-2 by enzyme-linked immunosorbent assay (ELISA) in the supernatant after co-culturing CAR T cells with CD19+ tumour cells (Nalm6). Data are mean ± s.d of three experimental replicates. Representative of three independent experiments performed with different blood donors. P values were determined by unpaired t-test (two-tailed). d, IL-2 secretion (as measured by ELISA) by HER2-targeting proximal signalling CARs after co-culture with HER2+ Nalm6 tumour cells. Mean ± s.d. of three experimental replicates. Representative of four independent experiments with different blood donors. P values were determined by unpaired t-test (two-tailed).
Fig. 3 |
Fig. 3 |. ZAP-70 CARs bypass upstream signalling elements and can exhibit enhanced anti-tumour activity.
a, Representative flow cytometric plots of CAR, LAG-3, TIM-3 and PD-1 expression for T cells bearing B7-H3 or GD2-specific CARs containing 4-1BBζ or ZAP-70KIDB endodomains (day 10 after T cell activation). b, SPICE (Simplified Presentation of Incredibly Complex Evaluations) analysis plots from data shown in a. c,d, NSG mice bearing CHLA-255-luciferase xenografts were treated intravenously on day 7 after tumour inoculation with 3 × 10⁶ B7-H3-4-1BBζ or B7-H3-ZAP-70KIDB CAR T cells. c, Quantification of tumour progression for each individual mouse as measured by flux values acquired by bioluminescence imaging (BLI). d, Survival curves for mice bearing tumours shown in c. Performed with n = 5 mice per group. e, Absolute number of CAR T cells recovered from the spleens of CHLA-255-bearing mice on days 7 and 14 after treatment with 1 × 10⁷ B7-H3-4-1BBζ or B7-H3-ZAP-70KIDB CAR T cells on day 7 after tumour inoculation. Mean ± s.e.m. for n = 5 mice (B7-H3-ZAP-70KIDB) or n = 4 mice (B7-H3-4-1BBζ) per group per time point. Experiment was performed once at two time points. f, Tumour cell killing of B7-H3+ Nalm6 cells co-cultured with B7-H3-ZAP-70KIDB (with or without the D461N mutation) CAR T cells at a 1:1 effector to target (E:T) ratio. g, IL-2 secretion by B7-H3-ZAP-70KIDB (with or without the D461N mutation) CAR T cells after co-culture with B7-H3+ Nalm6 cells. h,i, After CRISPR–Cas9-mediated knockout of the indicated proximal signalling molecules, B7-H3-ZAP-70KIDB CAR T cells were stimulated with B7-H3+ Nalm6 tumour cells. Flow cytometric data are shown for TNF × IL-2 (h) and CD107a × IFNγ (i) in the knockout populations designated in Extended Data Fig. 5e. Data in h,i are representative of three experiments performed with two different blood donors. Unless otherwise noted, data are mean ± s.d. of three experimental replicates and representative of three experiments with different blood donors. Statistical comparisons were performed using repeated-measures one-way ANOVA (c), log-rank test (d), Mann–Whitney test (two-tailed) (e) or unpaired t-test (two-tailed) (g).
Fig. 4 |
Fig. 4 |. LAT and SLP-76 CARs bypass upstream signalling elements to function together as a Boolean-logic AND gate.
a, Schematic of LAT and SLP-76 CARs co-expressed on one T cell. b, Secretion of IL-2 by CD19-LAT, HER2-SLP-76 or CD19-LAT + HER2-SLP-76 CAR T cells after co-culture with CD19+HER2+ Nalm6 cells (CD19+HER2+). Representative of eight independent experiments. c, Flow cytometry plots of CD19 and HER2 expression on engineered Nalm6 lines. d, IL-2 secretion by CD19-LAT + HER2-SLP-76 CAR T cells after co-culture with cells from c. Representative of eight independent experiments. e, Schematic of LAT and SLP-76 CARs with mismatched hinge–TM domains co-expressed on one T cell. f, Secretion of IL-2 by CD19-LAT + HER2-SLP-76 CAR T cells with the indicated TM regions after co-culture with cells from c. Representative of three independent experiments. g, Killing of cell lines shown in c co-cultured with CD19-LAT + HER2-SLP-76 CAR T cells with the indicated TM regions at a 1:1 E:T ratio. Representative of three independent experiments. h,i, After CRISPR–Cas9-mediated knockout of the indicated proximal signalling molecules, LINK (CD19-28TM-LAT + HER2-8TM-SLP-76) CAR T cells were stimulated with CD19+HER2+ Nalm6. Flow cytometric data are shown for TNF × IL-2 (h) and CD107a × IFNγ (i) in the knockout populations designated in Extended Data Fig. 6i. Data in h,i are representative of two independent experiments. j, Secretion of IL-2 by CD19-28TM-LAT + HER2-8TM-SLP-76 (±LAT(Y132F) mutation) CAR T cells after co-culture with CD19+HER2+ Nalm6. Representative of four independent experiments. k, Killing of CD19+HER2+ Nalm6 cells co-cultured with CD19-28TM-LAT + HER2-8TM-SLP-76 (± LAT(Y132F) mutation) CAR T cells at a 1:1 E:T ratio. Representative of four independent experiments. l, Schematic of the potential mechanism of LINK CAR activity. Unless otherwise noted, data are mean ± s.d. of three experimental replicates. Statistical comparisons were performed using one-way ANOVA with correction for multiple comparisons (b,d,f) and unpaired t-test (two-tailed) (j). All replicates used different blood donors.
Fig. 5 |
Fig. 5 |. Targeted mutations establish LINK CAR specificity.
a, Schematic of the deletion of the GADS-binding regions in LAT and SLP-76 CAR endodomains. bd, IL-2 secretion (b), tumour cell killing (1:1 E:T) (c) and flow cytometric plots of T cell degranulation (CD107a, top) and activation (CD69, bottom) (d) for the indicated LINK CAR T cells after co-culture with the cell lines shown in Fig. 4c. Data in b,c are mean b1x s.d. of three experimental replicates. Data in bd are representative of five independent experiments with four blood donors. Statistical comparisons were performed using one-way ANOVA with correction for multiple comparisons. NS, not significant.
Fig. 6 |
Fig. 6 |. LINK CAR mediates tumour eradication while preventing on-target, off-tumour toxicity.
ac, NSG mice bearing ROR1+CD19+Nalm6-luciferase were treated with 6 × 10⁶ of the indicated CAR+ T cells on day 1 after tumour engraftment. a, Weight of individual mice over time plotted as a percentage of the weight on day 0. b, Quantification of tumour progression for each individual mouse as measured by flux values acquired with BLI. c, Survival curves for mice bearing tumours shown in a,b. Data in ac are representative of three independent experiments with two different donors; n = 5 mice per group per experiment. In one of three experiments, the LINK2CA mice did not lose enough weight to meet the criteria for euthanasia. df, NSG mice bearing ROR1+CD19+Nalm6-luciferase were treated with 8 × 10⁶ of the indicated CAR+ T cells and logic-gated CAR T cell systems (including SPLIT (ROR1-8TM-ζ + CD19-28TM-CD28) and SynNotch (CD19-SynNotch → ROR1-CD28ζ)) on day 3 after tumour engraftment. d, Weight of individual mice over time plotted as a percentage of the weight on day 0. e, Quantification of tumour progression for each individual mouse as measured by flux values acquired with BLI. f, Survival curves for mice bearing tumours shown in d,e. The experiment in df was performed once with n = 5 mice per group and was repeated with another donor with all groups except CD19-CD28ζ (Extended Data Fig. 10e–g). Statistical comparisons were performed using log-rank test (c,f).

Comment in

References

    1. Majzner RG & Mackall CL Clinical lessons learned from the first leg of the CAR T cell journey. Nat. Med. 25, 1341–1355 (2019). - PubMed
    1. June CH & Sadelain M Chimeric antigen receptor therapy. N. Engl. J. Med. 379, 64–73 (2018). - PMC - PubMed
    1. Kloss CC, Condomines M, Cartellieri M, Bachmann M & Sadelain M Combinatorial antigen recognition with balanced signaling promotes selective tumor eradication by engineered T cells. Nat. Biotechnol. 31, 71–75 (2013). - PMC - PubMed
    1. Roybal KT et al. Engineering T cells with customized therapeutic response programs using synthetic Notch receptors. Cell 167, 419–432 (2016). - PMC - PubMed
    1. Fedorov VD, Themeli M & Sadelain M PD-1- and CTLA-4-based inhibitory chimeric antigen receptors (iCARs) divert off-target immunotherapy responses. Sci. Transl Med. 5, 215ra172 (2013). - PMC - PubMed

Publication types

MeSH terms