. 2023 Mar;615(7952):490-498.
doi: 10.1038/s41586-023-05720-6. Epub 2023 Mar 8.

Macrophage fumarate hydratase restrains mtRNA-mediated interferon production

Affiliations

Macrophage fumarate hydratase restrains mtRNA-mediated interferon production

Alexander Hooftman et al. Nature. 2023 Mar.

Abstract

Metabolic rewiring underlies the effector functions of macrophages1-3, but the mechanisms involved remain incompletely defined. Here, using unbiased metabolomics and stable isotope-assisted tracing, we show that an inflammatory aspartate-argininosuccinate shunt is induced following lipopolysaccharide stimulation. The shunt, supported by increased argininosuccinate synthase (ASS1) expression, also leads to increased cytosolic fumarate levels and fumarate-mediated protein succination. Pharmacological inhibition and genetic ablation of the tricarboxylic acid cycle enzyme fumarate hydratase (FH) further increases intracellular fumarate levels. Mitochondrial respiration is also suppressed and mitochondrial membrane potential increased. RNA sequencing and proteomics analyses demonstrate that there are strong inflammatory effects resulting from FH inhibition. Notably, acute FH inhibition suppresses interleukin-10 expression, which leads to increased tumour necrosis factor secretion, an effect recapitulated by fumarate esters. Moreover, FH inhibition, but not fumarate esters, increases interferon-β production through mechanisms that are driven by mitochondrial RNA (mtRNA) release and activation of the RNA sensors TLR7, RIG-I and MDA5. This effect is recapitulated endogenously when FH is suppressed following prolonged lipopolysaccharide stimulation. Furthermore, cells from patients with systemic lupus erythematosus also exhibit FH suppression, which indicates a potential pathogenic role for this process in human disease. We therefore identify a protective role for FH in maintaining appropriate macrophage cytokine and interferon responses.


Conflict of interest statement

Competing interests The authors declare no competing interests.

Figures

Extended Data Figure 1 –
Extended Data Figure 1 –. LPS stimulation drives fumarate accumulation and protein succination
a-c, Fumarate-mediated protein succination with LPS (n = 3) and 2SC abundance in NS and LPS-stimulated mouse macrophages (n = 5; LPS 4 h). d, Heatmap of metabolites linked to aspartate-argininosuccinate shunt in NS and LPS-stimulated mouse macrophages (n = 5; LPS 24 h) e, Metabolite abundance of aspartate-argininosuccinate shunt metabolites in LPS-stimulated mouse macrophages pre-treated with DMSO or AOAA (n = 3; LPS 4 h). f, 2SC levels following LPS stimulation with or without AOAA pre-treatment (3 h) (n = 3; LPS 4 h). c,e-g, Data are mean ± s.e.m. a, Representative blots shown. P values calculated using two-tailed Student’s t-test for paired comparisons or one-way ANOVA for multiple comparisons.
Extended Data Figure 2 –
Extended Data Figure 2 –. LPS stimulation drives fumarate accumulation via glutamine anaplerosis and an aspartate-argininosuccinate shunt
a, Schematic diagram indicating U-13C-glutamine tracing into distinct metabolic nodules. b, U-13C-glutamine tracing into glutamate, α-KG and succinate in LPS-treated mouse macrophages (m+4 and m+5 labelling intensity and total isotopologue fraction distribution) (n = 3; LPS 4 h). c, U-13C-glutamine tracing into γ-glutamylcysteine, GSH and GSSG in LPS-treated mouse macrophages (m+5 labelling intensity and total isotopologue fraction distribution) (n = 3; LPS 4 h). d, U-13C-glutamine tracing into aspartate, argininosuccinate, fumarate and malate in LPS-treated mouse macrophages (m+4 and m+5 labelling intensity and total isotopologue fraction distribution) (n = 3; LPS 4 h). Data are mean ± s.e.m. P values calculated using two-tailed Student’s t-test for paired comparisons.
Extended Data Figure 3 –
Extended Data Figure 3 –. LPS stimulation drives fumarate accumulation via glutamine anaplerosis and an aspartate-argininosuccinate shunt
a, Schematic diagram indicating 15N2-glutamine tracing into distinct metabolic nodules. b, 15N2-glutamine tracing into glutamate and asparagine in LPS-treated mouse macrophages (m+1 and m+2 labelling intensity and total isotopologue fraction distribution) (n = 3; LPS 4 h). c, 15N2-glutamine tracing into GSH and GSSG in LPS-treated mouse macrophages (m+1 and m+2 labelling intensity and total isotopologue fraction distribution) (n = 3; LPS 4 h). d, 15N2-glutamine tracing into aspartate, arginine and citrulline in LPS-treated mouse macrophages (m+1 labelling intensity and total isotopologue fraction distribution) (n = 3; LPS 4 h). Data are mean ± s.e.m. P values calculated using one-way ANOVA for multiple comparisons.
Extended Data Figure 4 –
Extended Data Figure 4 –. Increase in aspartate-argininosuccinate shunt metabolites in cytosol and Irg1−/− macrophages
Heatmap (min-max) of metabolites linked to mitochondrial bioenergetics and redox signalling (a) and the aspartate-argininosuccinate shunt (b) in NS and LPS-stimulated mouse macrophages (n = 3; LPS 24 h). c, Metabolite abundance of TCA cycle and aspartate-argininosuccinate shunt metabolites in LPS-stimulated WT and Irg1−/− mouse macrophages (n = 3; LPS 24 h). d, Nitrite levels in LPS-stimulated WT and Irg1−/− mouse macrophages (n = 3; LPS 24 h). e, Schematic of metabolic changes occurring during mid-phase TCA cycle rewiring in WT and Irg1−/− mouse macrophages (n = 3; LPS 4 h). Data are mean ± s.e.m. P values calculated using two-tailed Student’s t-test for paired comparisons or one-way ANOVA for multiple comparisons.
Extended Data Figure 5 –
Extended Data Figure 5 –. FH deletion increases bioenergetic stress, fumarate, and mitochondrial membrane potential
a, Bioenergetic ratios in macrophages treated with DMSO or FHIN1 (n = 3; LPS 4 h). b, Fumarate and 2SC levels in macrophages treated with DMSO or FHIN1 (n = 3; LPS 4 h). qPCR (n = 5) (c) and western blot (n = 2) (d) analysis of Fh expression in Fh1+/+ and Fh−/− LPS-stimulated macrophages (LPS 4 h). e, Bioenergetic ratios in Fh1+/+ and Fh−/− macrophages (n = 3; LPS 4 h). f, Heatmap of top 50 significantly abundant metabolites in LPS-stimulated Fh1+/+ and Fh−/− macrophages (n = 3; LPS 4 h). g, h, Fumarate and 2SC levels in Fh1+/+ and Fh−/− macrophages treated with or without LPS (n = 3; LPS 4 h). i, Glycolysis as measured by ECAR in LPS-stimulated macrophages pre-treated (3 h) with DMSO, FHIN1 or DMF (n = 3; LPS 4 h). Representative experiment shown. Data are mean ± s.d. Immunofluorescence (k) and quantification (j) of Mitotracker red staining in LPS-stimulated mouse macrophages pre-treated (3 h) with DMSO or FHIN1 (n = 3, LPS 4 h). Representative experiment shown. Data are mean ± s.d. l, MFI of TMRM staining in LPS-stimulated Fh1+/+ and Fh−/− macrophages (n = 3; LPS 4 h). m, Flow cytometry plot for CellROX staining. a-c,e,g,h,l Data are mean ± s.e.m. d,k, Representative blots or images shown. P values calculated using two-tailed Student’s t-test for paired comparisons or one-way ANOVA for multiple comparisons.
Extended Data Figure 6 –
Extended Data Figure 6 –. FH inhibition remodels inflammatory gene expression
a, Il10 and Tnfa expression in LPS-stimulated mouse macrophages pre-treated (3 h) with DMSO, FHIN1 or DMF (n = 4–6; LPS 4 h). b, Il1b expression and IL-6 release in LPS-stimulated mouse macrophages pre-treated (3 h) with DMSO, FHIN1 or DMF (n = 6; 4 h LPS). c, Enrichment map plot of shared significantly increased genes in LPS-stimulated mouse macrophages pre-treated (3 h) with DMF or FHIN1 compared to DMSO control (n = 3; LPS 4 h). d, Western blot of total and phospho-AKT, JNK, ERK and p38 levels in LPS-stimulated mouse macrophages pre-treated with DMSO, FHIN1 or DMF (n = 2–3). e, Jun expression from RNA seq from LPS-stimulated mouse macrophages pre-treated (3 h) with DMF or FHIN1 compared to DMSO control (n = 3; LPS 4 h). f, Fos expression from RNA seq from LPS-stimulated mouse macrophages pre-treated (3 h) with DMF or FHIN1 compared to DMSO control (n = 3; LPS 4 h). g, FH protein and gene expression levels in Fh1+/+ and Fh1+/− LPS-stimulated macrophages (n = 2). h, ELISA of IL-10 in LPS-stimulated Fh+/+ and Fh1+/− (n = 2)/Fh−/− (n = 2) macrophages (LPS 4 h). i, ELISA of IL-10 and TNF-α release in LPS-stimulated macrophages pre-treated with DMSO or AOAA (n = 3; LPS 4 h). j, Schematic depicting mild suppression of IL-10 expression during typical LPS signalling (right), and increased suppression of IL-10 following FH inhibition, leading to dysregulated TNF-α release (right). a,b,e,f,h,i Data are mean ± s.e.m. d,g, Representative blots shown. P values calculated using two-tailed Student’s t-test for paired comparisons or one-way ANOVA for multiple comparisons.
Extended Data Figure 7 –
Extended Data Figure 7 –. FH inhibition triggers the NRF2 and ATF4 stress response and promotes GDF15 release
a, Heatmap of significantly differentially expressed mRNA seq data in LPS-stimulated mouse macrophages pre-treated (3 h) with FHIN1 compared to DMSO control (n = 3; LPS 4 h). Volcano plots of proteomics in LPS-stimulated mouse macrophages pre-treated (3 h) with DMSO, FHIN1 (b) or DMF (c) (n = 5; LPS 4 h). d, ELISA of GDF15 in LPS-stimulated macrophages pre-treated (3 h) with DMSO or FHIN1 (n = 3; LPS 4 h). e, Nrf2 expression or ATF4 protein levels after silencing of Nrf2 or Atf4, respectively, in NS and LPS-stimulated macrophages pre-treated (3 h) with DMSO or FHIN1 (n = 6; LPS 4 h). f, Gdf15 expression after silencing of Nrf2 or Atf4 respectively in NS and LPS-stimulated macrophages pre-treated (3 h) with DMSO or FHIN1 (n = 3, LPS 4 h). d-f, Data are mean ± s.e.m. e, Representative blots shown. P values calculated using one-way ANOVA for multiple comparisons.
Extended Data Figure 8 –
Extended Data Figure 8 –. IFN-β release following FH inhibition is independent of cGAS-STING
a, Heatmap (min-max) of significantly differentially expressed mRNA seq data in LPS-stimulated mouse macrophages pre-treated (3 h) with DMF compared to DMSO control (n = 3; LPS 4 h). b, Western blot of phospho-STAT1, STAT1, phospho-JAK1 and JAK1 levels in LPS-stimulated macrophages pre-treated (3 h) with DMSO, FHIN1 or DMF (n = 3; LPS 4 h). c, Ifnb1 expression after silencing of Nrf2 in LPS-stimulated macrophages pre-treated (3 h) with DMSO, FHIN1 or DMF (n = 3, LPS 4 h). d, Nrf2 expression after silencing of Nrf2 in LPS-stimulated macrophages pre-treated (3 h) with DMSO, FHIN1 or DMF (n = 3, LPS 4 h). e, Ifnb1 expression in LPS-stimulated macrophages pre-treated (3 h) with DMSO or FHIN1 in the presence of absence of NAC (n = 3; LPS 4 h). f, D-loop and Non-NUMT fold expression in EtBr-treated macrophages (n = 5). g, Western blot of lamin B1 and α-tubulin in cytosolic and membrane-bound organelle fractions following digitonin fractionation (n = 3). h, IFN-β levels in 2’,3’ cGAMP- or CpG-transfected macrophages pre-treated (1 h) with C-178 or ODN2088 (n = 3–4; 3 h). i, Ifnb1 expression in LPS-stimulated macrophages pre-treated (3 h) with DMSO or FHIN1 in conjunction with C-178 or ODN2088 (1 h) respectively (n = 3; LPS 4 h). j, Cgas, Tmem173 and Tlr9 expression with silencing of Cgas, Tmem173 and Tlr9 respectively in LPS-stimulated macrophages pre-treated (3 h) with DMSO or FHIN1 (n = 3; LPS 4 h). k, IFN-β levels with silencing of Cgas, Tmem173 and Tlr9 respectively in LPS-stimulated macrophages pre-treated (3 h) with DMSO or FHIN1 (n = 3; LPS 4 h). l, Tmem173 expression in LPS-stimulated macrophages pre-treated (3 h) with DMSO, FHIN1 or DMF (n = 3, LPS 4 h). m, IFN-β release (fold change over DMSO control) in LPS-stimulated macrophages pre-treated (3 h) with DMSO or FHIN1 in the presence of absence of IMT1 (n = 5; LPS 4 h). n, Tlr7 expression with silencing of Tlr7 in LPS-stimulated macrophages pre-treated (3 h) with DMSO or FHIN1 (n = 3; LPS 4 h). o, Ddx58 and Ifih1 expression with silencing of Ddx58 and Ifih1 respectively in LPS-stimulated macrophages pre-treated (3 h) with DMSO or FHIN1 (n = 3; LPS 4 h). c-f,h-o, Data are mean ± s.e.m. b,g, Representative blots or images shown. P values calculated using two-tailed Student’s t-test for paired comparisons or one-way ANOVA for multiple comparisons.
Extended Data Figure 9 –
Extended Data Figure 9 –. Mitochondrial membrane potential modifiers increase mtRNA and trigger IFN-β release
a, Western blot of TBK1 and p-TBK1 in LPS-stimulated macrophages pre-treated (3 h) with DMSO or FHIN1 (n = 3; LPS 4 h). b, Ifnb1 expression in LPS-stimulated WT and Mavs−/− macrophages pre-treated (3 h) with DMSO or FHIN1 (n = 3; LPS 4 h). c, MFI of TMRM staining in LPS-stimulated macrophages pre-treated (3 h) with DMSO, FHIN1, oligomycin or valinomycin (n = 3, LPS 4 h). d, IFN-β levels in LPS-stimulated macrophages pre-treated (3 h) with DMSO, FHIN1, oligomycin or valinomycin (n = 4; LPS 4 h).). e, MFI of TMRM staining in LPS-stimulated macrophages pre-treated (3 h) with DMSO or CCCP (n = 4, LPS 4 h). f, IFN-β levels in LPS-stimulated macrophages pre-treated (3 h) with DMSO or CCCP (n = 3; LPS 4 h). g, MFI of TMRM staining in LPS-stimulated macrophages pre-treated (3 h) with DMSO or MMF (n = 3, LPS 4 h). Immunofluorescence (h) and quantification (i) of dsRNA in LPS-stimulated macrophages pre-treated (3 h) with DMSO, FHIN1 or oligomycin or transfected with poly (I:C) (n = 3; LPS 4 h). Representative experiment shown. Data are mean ± s.d. j, D-loop fold expression in DNA and RNA isolated from cytosolic fractions of digitonin-fractionated LPS-stimulated mouse macrophages pre-treated with DMSO or oligomycin (n = 4 for mtDNA, n = 5 for mtRNA). Immunofluorescence (k) and quantification (l) of dsRNA in LPS-stimulated macrophages pre-treated with DMSO or valinomycin (n = 3; LPS 4 h). Representative experiment shown. Data are mean ± s.d. m, Quantification of dsRNA immunofluorescence in LPS-stimulated Fh+/+ and Fh−/− macrophages (n = 3; LPS 4 h). Data are mean ± s.d. n, MFI of TMRM staining in LPS-stimulated macrophages (n = 3). Immunofluorescence (o) and quantification (p) of dsRNA immunofluorescence in LPS-stimulated macrophages (n = 3). Representative experiment shown. Data are mean ± s.d. q, Ddx58 and Ifih1 expression in LPS-stimulated macrophages (n = 4; LPS 4 h). r, Fh expression in IFN-β-stimulated macrophages (n = 3). b-g,j,n,q,r Data are mean ± s.e.m. a,h,k,o, Representative blots or images shown. P values calculated using two-tailed Student’s t-test for paired comparisons, one-way ANOVA for multiple comparisons.
Extended Data Figure 10 –
Extended Data Figure 10 –. FH inhibition triggers IFN-β release via a mtRNA-driven retrograde response
Schematic depicting the mitochondrial retrograde signalling cascades occurring following FH inhibition during early-phase LPS signalling (left), and during late-phase LPS signalling in the absence of pharmacological or genetic targeting of FH (right).
Fig. 1 |
Fig. 1 |. LPS stimulation drives fumarate accumulation through glutamine anaplerosis and an aspartate–argininosuccinate shunt.
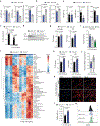
a,b,d, Metabolite abundance (a,d) and bioenergetic ratios (b) in non-stimulated (NS) and LPS-stimulated BMDMs (n = 3). LPS 4 h: argininosuccinate, P = 0.000044; fumarate, P = 0.000141; malate, P = 0.000219. a.u., arbitrary units; FC, fold change. c, Respirometry as measured by oxygen consumption rates (OCRs) of NS and LPS-stimulated BMDMs (n = 6 (NS) or 8 (LPS); LPS 4 h). n = technical replicates from 1 experiment performed with 3 pooled biological replicates. Data are mean ± s.d. e, Ass1 and Fh1 gene expression with LPS time course (n = 9). LPS 24 h, P = 0.000729; LPS 48 h, P = 0.000001. f, Quantitative proteomics of aspartate–argininosuccinate shunt enzymes in NS and LPS-stimulated BMDMs (n = 4). LPS 24 h: ASS1, P = 0.000156. g, FH levels with LPS time course (n = 1). h, Fumarate levels following LPS stimulation with or without AOAA pre-treatment (1 h) (n = 6, LPS 4 h). i, Schematic of metabolic changes occurring during early-phase TCA cycle rewiring (LPS 4 h). For b,df,h, data are mean ± s.e.m. n = biological replicates unless stated otherwise. P values calculated using two-tailed Student’s t-test for paired comparisons or one-way analysis of variance (ANOVA) for multiple comparisons. Schematic in panel i was created using BioRender (https://biorender.com).
Fig. 2 |
Fig. 2 |. FH inhibition increases bioenergetic stress, fumarate levels and MMP.
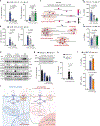
a,c, Bioenergetic ratios (a) and heatmap of top 50 differentially abundant metabolites (c) in BMDMs pre-treated with vehicle (DMSO), FHIN1 or DMF (n = 3). LPS 4 h: ATP/ADP, P = 0.000004; phosphocreatine/creatine, P = 0.00000001. b, Respirometry of BMDMs pre-treated with DMSO, FHIN1 or DMF (n = 8; LPS 4 h). n = technical replicates from 1 experiment performed with 3 pooled biological replicates. Data are mean ± s.d. d, Principal component analysis plot of metabolomics in BMDMs pre-treated with DMSO, FHIN1 or DMF (n = 3; LPS 4 h). e, Fumarate levels in BMDMs pre-treated with DMSO or FHIN1 (n = 9; LPS 4 h). f, Fumarate and 2SC levels in Fh1+/+ and Fh1−/− BMDMs (n = 3; 96 h ethanol and 4-hydroxytamoxifen (TAM); LPS 4 h). g, Mean fluorescence intensity (MFI) of CellROX staining in BMDMs pre-treated with DMSO, FHIN1 or DMF (n = 3; LPS 4 h). h, MFI of TMRM staining in BMDMs pre-treated with DMSO, FHIN1 or DMF or Fh1+/+ and Fh1−/− BMDMs (n = 4 (DMSO, FHIN1 and DMF) or n = 3 (Fh1+/+ and Fh1−/−); 72 h ethanol and TAM; LPS 4 h). i, Aconitate/citrate ratio following LPS stimulation with or without FHIN1 or DMF pre-treatment (n = 3; LPS 4 h). j, GSH and GSSG levels following LPS stimulation with or without FHIN1 or DMF pre-treatment (n = 3; LPS 4 h). For a,ej, data are mean ± s.e.m. n = biological replicates unless stated otherwise. P values calculated using two-tailed Student’s t-test for paired comparisons or one-way or ANOVA for multiple comparisons.
Fig. 3 |
Fig. 3 |. FH activity is required to maintain appropriate cytokine responses.
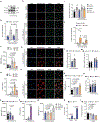
a,b, GSEA (a) and overrepresentation analysis (b) of RNA-seq data of BMDMs pre-treated with FHIN1 or DMSO (n = 3; LPS 4 h). HRI, haem-regulated inhibitor. c, IL-10 and TNF release from BMDMs pre-treated with DMSO, FHIN1 or DMF (n = 6; LPS 4 h). FHIN1 and IL-10, P = 0.0000024; DMF and IL-10, P = 0.0000018; FHIN1 and TNF, P = 0.000001. d, Il10 and Tnf expression in BMDMs pre-treated with DMSO or MMF (n = 3; LPS 4 h). e, Enrichment map plot of shared significantly decreased genes in BMDMs pre-treated with FHIN1 or DMF (n = 3; LPS 4 h). f, Il10 expression in BMDMs pre-treated with DMSO, FHIN1 or DMF in the presence of NAC (n = 3; LPS 4 h). g, c-Fos activity in BMDMs pre-treated with DMSO, FHIN1 or DMF (n = 3; LPS 4 h). DMF, P = 0.0000298. h, TNF release from BMDMs pre-treated with anti-CD210 antibody (1 h) (n = 4; LPS 4 h). i,j, Western blot for STAT3 and phospho-STAT3 (pSTAT-3; i) and TNF release (j) from BMDMs pre-treated with DMSO, FHIN1 or DMF and treated with IL-10 (n = 3, LPS 4 h).DMF, P = 0.000163. k, Il10 expression and IL-10 release in Fh1+/+ and Fh1−/− (n = 5 or 2) and Fh1+/− (n = 2) BMDMs (ethanol and TAM 72 h; LPS 4 h). Il10,P = 0.000055. l, TNF release from Fh1+/+ and Fh1−/− (n = 5) and Fh1+/− (n = 2) BMDMs (ethanol and TAM 72 h; LPS 4 h). m, IL10 and TNF expression in human PBMCs pre-treated with DMSO or FHIN1 (n = 8, LPS 4 h). FHIN1, P = 0.00000008. n, IL10 and TNF expression in human macrophages pre-treated with DMSO or FHIN1 (n = 3, LPS 4 h) FHIN1, P = 0.000028. For c,d,fh,jn, data are mean ± s.e.m. For i, blot is representative of three. n = biological replicates. P values calculated using two-tailed Student’s t-test for paired comparisons or one-way ANOVA for multiple comparisons.
Fig. 4 |
Fig. 4 |. FH impairment triggers IFNβ release through a mtRNA-driven retrograde response.
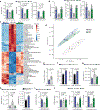
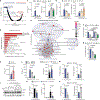
a, Volcano plot of type I IFN response in BMDMs pre- treated with DMSO or FHIN1 (n = 3; LPS 4 h). b, IFNβ release from BMDMs pre- treated with DMSO, FHIN1 or DMF (n = 6; LPS 4 h). FHIN1, P = 0.000004. c, Ifnb1 expression in BMDMs pre-treated with DMSO or MMF (n = 3; LPS 4 h). d, IFNβ release from BMDMs treated with ethidium bromide (EtBr) (for 6 days) before pre-treatment with DMSO or FHIN1 (n = 6; LPS 4 h). Ctrl, control. e, Cytosolic D-loop expression in DNA and RNA in BMDMs pre-treated with DMSO or FHIN1 (n = 4 (mtDNA) or 5 (mtRNA); LPS 4 h). f, dsRNA immunofluorescence in BMDMs pre-treated with DMSO or FHIN1 (n = 3; LPS 4 h). g, Ifnb1 with Tlr7 silencing in BMDMs pre-treated with DMSO or FHIN1 (n = 3; LPS 4 h). h, IFNβ with Ddx58 or Ifih1 silencing in BMDMs pre-treated with DMSO or FHIN1 (n = 7; LPS 4 h). i, MAVS in BMDMs pre-treated with DMSO or FHIN1 (n = 3; LPS 4 h). j, IFNβ levels in Fh1+/+ and Fh1−/− BMDMs (n = 3; ethanol and TAM 72 h; LPS 4 h). k, dsRNA immunofluorescence in Fh1+/+ and Fh1−/− BMDMs (n = 3; ethanol and TAM 72 h; LPS 4 h). l, Ifnb1 with Ddx58 or Ifih1 silencing (n = 3). m, Serum IFNβ of mice treated with FHIN1 or DMF before PBS or LPS injection (n = 5 (PBS), 10 (FHIN1 and LPS), 11 (vehicle and LPS) or 12 (DMF and LPS)). n, IFNβ release from human PBMCs pre-treated with DMSO, FHIN1 or DMF (n = 3; LPS 4 h). o, FH expression in whole blood from healthy individuals (HC) and patients with SLE (n = 30; P = 0.0000005). For be,g,h,j,lo, data are mean ± s.e.m. For f,i,k, blot or image is representative of three experiments. n = biological replicates. P values calculated using two-tailed Student’s t-test for paired comparisons, one-way ANOVA for multiple comparisons. Scale bars, 20 μm (f,k).

Comment in

Similar articles

  • Metabolic remodelling produces fumarate via the aspartate-argininosuccinate shunt in macrophages as an antiviral defence.
    Xia W, Mao Y, Xia Z, Cheng J, Jiang P. Xia W, et al. Nat Microbiol. 2025 May;10(5):1115-1129. doi: 10.1038/s41564-025-01985-x. Epub 2025 Apr 18. Nat Microbiol. 2025. PMID: 40251448 Free PMC article.
  • Prescription of Controlled Substances: Benefits and Risks.
    Preuss CV, Kalava A, King KC. Preuss CV, et al. 2025 Jul 6. In: StatPearls [Internet]. Treasure Island (FL): StatPearls Publishing; 2025 Jan–. 2025 Jul 6. In: StatPearls [Internet]. Treasure Island (FL): StatPearls Publishing; 2025 Jan–. PMID: 30726003 Free Books & Documents.
  • Regulation of airway fumarate by host and pathogen promotes Staphylococcus aureus pneumonia.
    Chen YT, Liu Z, Fucich D, Giulieri SG, Liu Z, Wadhwa R, Rios G, Henschel H, Tyagi N, Olivier FAB, Monk IR, Shah SS, Sridhar SH, Drikic M, Bianco C, Lohia GK, Beg AZ, Planet PJ, Lewis IA, Sebra R, Traven A, Hachani A, Stinear TP, Howden BP, Boyd JM, Riquelme SA, Wang C, Prince A, Wong Fok Lung T. Chen YT, et al. Nat Commun. 2025 Aug 1;16(1):7050. doi: 10.1038/s41467-025-62453-y. Nat Commun. 2025. PMID: 40745169 Free PMC article.
  • Functional implications of fumarate-induced cysteine succination.
    Guberovic I, Frezza C. Guberovic I, et al. Trends Biochem Sci. 2024 Sep;49(9):775-790. doi: 10.1016/j.tibs.2024.05.003. Epub 2024 Jun 13. Trends Biochem Sci. 2024. PMID: 38876954 Review.
  • Citrullinemia Type I.
    Quinonez SC, Lee KN. Quinonez SC, et al. 2004 Jul 7 [updated 2022 Aug 18]. In: Adam MP, Feldman J, Mirzaa GM, Pagon RA, Wallace SE, Amemiya A, editors. GeneReviews® [Internet]. Seattle (WA): University of Washington, Seattle; 1993–2025. 2004 Jul 7 [updated 2022 Aug 18]. In: Adam MP, Feldman J, Mirzaa GM, Pagon RA, Wallace SE, Amemiya A, editors. GeneReviews® [Internet]. Seattle (WA): University of Washington, Seattle; 1993–2025. PMID: 20301631 Free Books & Documents. Review.

Cited by

References

    1. Mills EL et al. Succinate dehydrogenase supports metabolic repurposing of mitochondria to drive inflammatory macrophages. Cell 167, 457–470.e13 (2016). - PMC - PubMed
    1. Mills EL et al. Itaconate is an anti-inflammatory metabolite that activates Nrf2 via alkylation of KEAP1. Nature 556, 113–117 (2018). - PMC - PubMed
    1. Tannahill GM. et al.. Succinate is an inflammatory signal that induces IL-1β through HIF-1α. Nature 496, 238–242 (2013). - PMC - PubMed
    1. Lampropoulou V. et al. Itaconate links inhibition of succinate dehydrogenase with macrophage metabolic remodeling and regulation of inflammation. Cell Metab. 24, 158–166 (2016). - PMC - PubMed
    1. Jha AK et al. Network integration of parallel metabolic and transcriptional data reveals metabolic modules that regulate macrophage polarization. Immunity 42, 419–430 (2015). - PubMed

Publication types

MeSH terms