. 2023 Mar;615(7952):499-506.
doi: 10.1038/s41586-023-05770-w. Epub 2023 Mar 8.

Fumarate induces vesicular release of mtDNA to drive innate immunity

Affiliations

Fumarate induces vesicular release of mtDNA to drive innate immunity

Vincent Zecchini et al. Nature. 2023 Mar.

Abstract

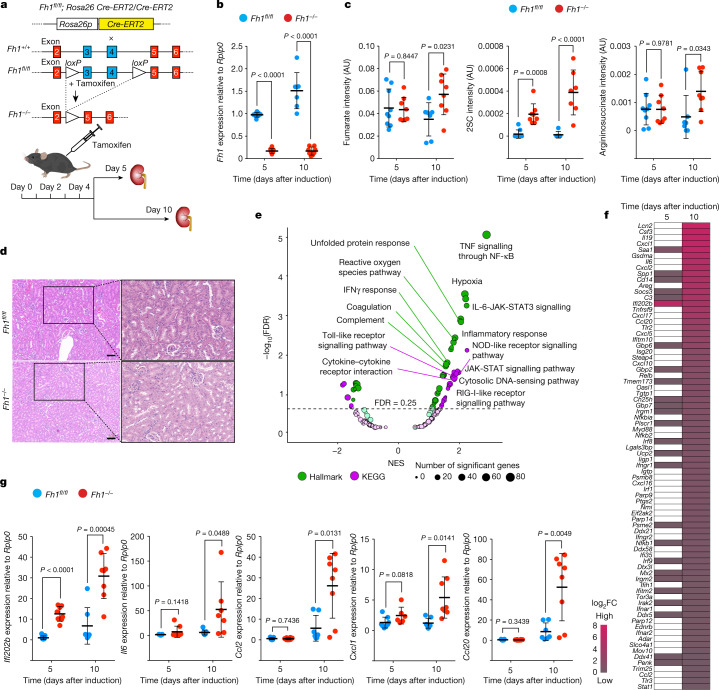
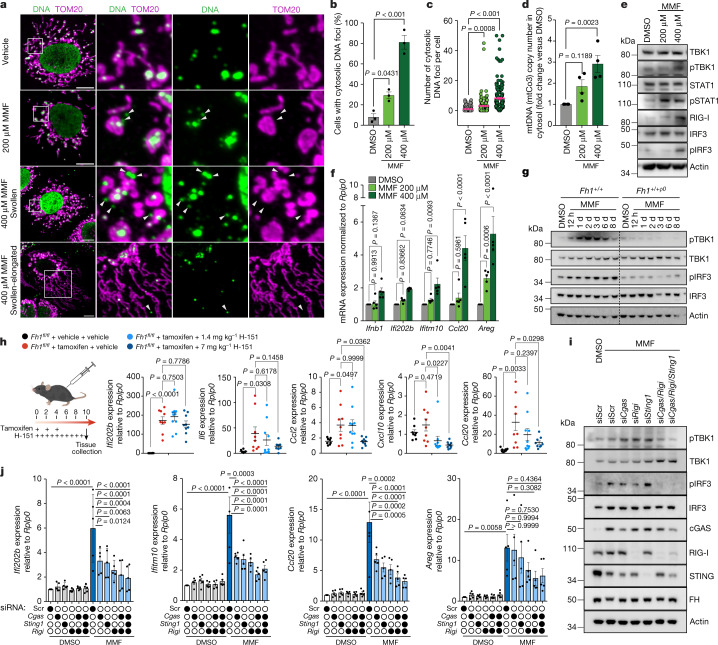
Mutations in fumarate hydratase (FH) cause hereditary leiomyomatosis and renal cell carcinoma1. Loss of FH in the kidney elicits several oncogenic signalling cascades through the accumulation of the oncometabolite fumarate2. However, although the long-term consequences of FH loss have been described, the acute response has not so far been investigated. Here we generated an inducible mouse model to study the chronology of FH loss in the kidney. We show that loss of FH leads to early alterations of mitochondrial morphology and the release of mitochondrial DNA (mtDNA) into the cytosol, where it triggers the activation of the cyclic GMP-AMP synthase (cGAS)-stimulator of interferon genes (STING)-TANK-binding kinase 1 (TBK1) pathway and stimulates an inflammatory response that is also partially dependent on retinoic-acid-inducible gene I (RIG-I). Mechanistically, we show that this phenotype is mediated by fumarate and occurs selectively through mitochondrial-derived vesicles in a manner that depends on sorting nexin 9 (SNX9). These results reveal that increased levels of intracellular fumarate induce a remodelling of the mitochondrial network and the generation of mitochondrial-derived vesicles, which allows the release of mtDNAin the cytosol and subsequent activation of the innate immune response.


Conflict of interest statement

C.F. is a scientific adviser for Istesso. The remaining authors declare no competing interests.

Figures

Fig. 1
Fig. 1. Loss of Fh1 in the adult mouse kidney triggers an early inflammatory response.
a, Genome-editing strategy for generating inducible Fh1 knockout alleles. Rosa26-Cre-ERT2 mice carry the tamoxifen-responsive Cre recombinase transgene downstream of the Rosa26 promoter. Fh1fl/fl mice contain two loxP sites flanking Fh1 exons 3 and 4. Intraperitoneal injection of tamoxifen in the adult mouse induces the nuclear translocation of the ubiquitously expressed Cre–ERT2 fusion protein, resulting in the excision of the genomic fragment located between the loxP sites to generate Fh1 null alleles (Fh1−/−). Mice of about 90 days of age are treated with tamoxifen and the kidneys are collected for analysis at day 5 and day 10 after injection. b, Fh1 mRNA expression levels in wild-type control (Fh1+/+) and Fh1-deficient (Fh1−/−) adult mouse kidneys, measured by qRT–PCR. c, Metabolite abundance (normalized peak ion intensity, arbitrary units (AU)) in Fh1+/+ and Fh1−/− adult mouse kidney measured by liquid chromatography–mass spectrometry (LC–MS). d, Haematoxylin and eosin (H&E) staining of Fh1+/+ and Fh1−/− adult mouse kidney at day 10 after induction. Scale bars, 100 μm. e, Volcano plots of the GSEA, highlighting the differentially regulated pathways in Fh1−/− versus Fh1+/+ kidney tissue at day 10 after induction. FDR, false discovery rate; NES, normalized enrichment score. f, Heat map showing upregulated inflammation-related genes in Fh1−/− versus Fh1+/+ kidney tissue at day 5 and day 10 after induction (white cells mean no difference between the two groups). g, Expression levels of ISGs in Fh1−/− versus Fh1+/+ kidney tissue at day 5 and day 10 after induction, measured by qRT–PCR. Data are mean ± s.e.m. b,c,g, n = minimum 8 mice in each group, Student’s t-test corrected for multiple comparisons with the Holm–Sidak method. Source data
Fig. 2
Fig. 2. Activation of the cGAS–STING pathway in Fh1-deficient cells is triggered by cytosolic mtDNA.
a, qRT–PCR (top) and immunoblots (bottom) showing the expression levels of Fh1 (top) or FH protein (bottom) in inducible iFh1 epithelial kidney cell lines clones 29 (iFh1fl/flCL29) that were not treated (NT) or were treated with either vehicle (ethanol; EtOH) or 4-OHT (iFh1−/−CL29) for the indicated period of time. n = 5 independent experiments. b, Relative abundance (normalized peak ion intensity) of fumarate (left), 2SC (middle) and argininosuccinate (right) in iFh1CL29 cells measured by LC–MS. n = 5 independent experiments. c, Immunoblots of specified proteins in iFh1CL29 cells. d, Representative confocal images of mitochondrial morphology (TOM20) and DNA foci (DNA) in iFh1CL29 cells. White arrowheads indicate cytosolic DNA foci. Scale bar, 10 μm. e,f, Percentage of iFh1CL29 cells showing cytosolic DNA foci (e) and number of cytosolic DNA foci per cell (f) from d. n = 3 independent experiments. g, TEM images of mitochondria from Fh1+/+ and Fh1−/− adult mouse kidney tissue. Scale bars, 1 μm (top); 500 nm (bottom). hj, Quantification of mtDNA copy number by ddPCR using a mtCo3 (h), mtND1 (i) or mtD-loop (j) probe, from isolated cytosolic fractions of iFh1CL29 cells at day 1 to day 15 after induction. n = 3 independent experiments. Data are mean ± s.e.m. a,b, Student’s t-test corrected for multiple comparisons with the Holm–Sidak method; P values are indicated above each condition and relative to the corresponding vehicle-treated control; e,f,hj, one-way ANOVA with Tukey’s multiple comparisons test. Source data
Fig. 3
Fig. 3. Fumarate induces a remodelling of mitochondrial morphology and the release of mtDNA.
af, Chronic Fh1 kidney cells (cFh1fl/fl) were treated with 200 μM or 400 μM MMF or vehicle (dimethyl sulfoxide; DMSO) for 8 days. n = 3 independent experiments (unless otherwise specified). In g, iFh1fl/flCL29 cells were treated with 400 μM MMF or DMSO for 8 days. a, Representative confocal images of mitochondrial morphology (TOM20) and DNA foci (DNA) in cFh1fl/fl cells. White arrowheads indicate cytosolic DNA foci. Scale bars, 10 μm. b,c, Percentage of cFh1fl/fl cells showing cytosolic DNA foci (b) and number of cytosolic DNA foci per cell (c) from a. d, Quantification of mtDNA copy number by ddPCR using a mtCo3 probe, from isolated cytosolic fractions of cFh1fl/fl cells. e, Immunoblots of specified proteins in cFh1fl/fl cells. f, ISG expression in cFh1fl/fl cells measured by qRT–PCR. n = 5 independent experiments. g, Immunoblots of specified proteins in iFh1fl/flCL29 and mtDNA-depleted iFh1fl/flCL29ρ0 cells. h, mRNA expression of a panel of ISGs in mouse kidney tissue treated with the STING inhibitor H-151, measured by qRT–PCR. n = 9 mice per group. i,j, Immunoblots of specified proteins (i) and ISG expression measured by qRT–PCR (j) in cFh1fl/fl cells treated with 400 µM MMF or DMSO for 8 d, and transfected with the indicated siRNAs (Scr, scramble). n = 5 independent experiments. Data are mean ± s.e.m. bd,f,j, One-way ANOVA with Tukey’s multiple comparison test; h, one-way ANOVA with Dunnett’s multiple comparison test. Source data
Fig. 4
Fig. 4. mtDNA is conveyed to the cytosol by MDVs.
For all panels: n = 3 independent experiments (unless otherwise specified). In b,c,f,h,i, cFh1fl/fl cells were treated with 400 μM MMF or vehicle (DMSO) for 6 days. For immunofluorescence experiments, mitochondria or MDVs were labelled using anti-TOM20, anti-PDH and anti-TFAM antibodies and DNA with an anti-DNA antibody. a, TEM images of Fh1+/+ and Fh1−/− mouse kidney showing potential vesicle budding at the mitochondrial surface (black arrowheads). Scale bars, 1 μm. b, Representative confocal images of cFh1fl/fl cells transfected with the indicated siRNAs. Red arrowheads: TOM20PDH+DNA+ MDVs; blue arrowheads: TOM20PDH+DNA MDVs; white arrowheads: cytosolic DNA foci; green arrowheads: stalled TOM20PDH+DNA+ MDV budding events. Scale bar, 10 μm. c, Representative N-structured illumination microscopy (N-SIM) super-resolution images of MMF-treated cFh1fl/fl cells. Red arrowheads: TOM20PDH+DNA+ MDV budding event; blue arrowheads: TOM20PDH+DNA+-released MDVs. Scale bar, 5 μm. d,e, Quantification of TOM20PDH+DNA+ MDVs (d), and compared to cytosolic DNA foci (e) in cFh1fl/fl cells; P values are relative to the corresponding DMSO-treated control. f, Representative confocal images of MMF-treated cFh1fl/fl cells. White arrowheads: TOM20PDH+TFAM+ MDVs. Scale bar, 10 μm. Bottom left, histogram showing the quantification of TOM20PDH+ MDVs that are positive for TFAM. g, Quantification of mtDNA copy number by ddPCR using a mtCo3 probe from isolated cytosolic fractions of MMF-treated cFh1fl/fl cells (12 h or 24 h), and pre-transfected with the indicated siRNAs. n = 4 independent experiments. h,i, Quantification of TOM20PDH+DNA+ MDVs (h) and compared to cytosolic DNA foci (i) in MMF-treated cFh1fl/fl cells and pre-transfected with the indicated siRNAs. j,k, Immunoblots of specified proteins (j) and Ifnb1 mRNA expression measured by qRT–PCR (k) in cFh1fl/fl cells transfected with the indicated siRNAs and treated with MMF for the indicated period of time. Data are mean ± s.e.m. d,gi,k, One-way ANOVA with Tukey’s multiple comparisons test; e, two-way ANOVA with Tukey’s multiple comparisons test. Source data
Fig. 5
Fig. 5. FH-deficient tumour tissue is characterized by an inflammatory signature.
a, GSEA of the gene expression profile of HLRCC tumour versus normal tissue. b, mRNA expression of a panel of ISGs in HLRCC tumour versus normal tissue measured by qRT–PCR; N, normal (healthy individuals); T, tumour (patients with HLRCC). n = 3 serum samples for each N and T, in 3 technical replicates each. c, Cellular composition of the bulk RNA-sequencing datasets from FH-deficient RCCs, SDH-deficient RCCs and common RCC subtypes from TCGA (as described in the Methods). ccRCC, clear cell RCC; pRCC, papillary RCC; chRCC, chromophobe RCC. d, Levels of IL-6 and IL-10 in HLRCC tumour versus normal tissue measured by enzyme-linked immunosorbent assay (ELISA). n = 5 and 20 samples for normal tissue (N) and FH-deficient HLRCC tumour tissue (T), respectively. e, Schematic of the pathway. Loss of Fh1 in the mouse kidney results in profound metabolic adaptations and mitochondrial network remodelling mediated by fumarate within the cell. Increased levels of fumarate lead to the release of mtDNA in the cytosol through an SNX9-dependent MDV-mediated mechanism, which results in the activation of the cGAS–STING pathway as well as RIG-I, upregulation of genes involved in the innate immune response and chronic low-grade inflammation. Data are mean ± s.e.m. b, Unpaired two-tailed t-test; c, Wilcoxon rank sum test, P < 0.05 (Benjamini–Hochberg adjustment); d, unpaired two-tailed Mann–Whitney test. Source data
Extended Data Fig. 1
Extended Data Fig. 1. Characterization of an inducible mouse model of Fh1 loss.
a, Genomic DNA PCR using primers flanking exons 3 and 4 of Fh1 showing amplification product for the Fh1 wild-type allele (bottom band; Fh1+/+), the floxed (unrecombined) allele (top band; Fh1fl/fl) and the recombined allele (middle band; excised LoxP fragments; Fh1−/−) from kidney samples at day 5 post-induction. Mice carrying one allele of each Fh1+/+ and Fh1fl/fl i.e. Fh1+/fl; Rosa26-Cre-ERT2 were used for comparison with Fh1+/+ and Fh1−/− mice and labelled Fh1+/−. b, Immunoblots of specified proteins in kidney tissue samples at day 5 post-induction. Five kidney samples are shown. c, Upon loss of Fh1 activity, fumarate cannot enter the enzymatic reaction that converts it into succinate but, instead, can enter a chemical reaction termed Michael addition whereby it is chemically added to thiol residues of free cysteine to form 2SC, and of proteins which is considered a metabolic marker of FH activity loss. This reaction can be seen as a “buffering tank” that mop-up the excess of fumarate. Therefore, succinated proteins and 2SC levels increase before an intracellular increase in fumarate is detected. Only when succination is “at saturation” with the 2SC intracellular sinks (or “buffering tanks”) full, fumarate starts to accumulate. Thus, a modest increase in fumarate can still be accompanied by a strong effect. d, Volcano plots showing the differentially expressed genes in Fh1−/− vs Fh1+/+ kidney at day 5 (left) and day 10 (right). e, Deconvolution method on bulk expression data (https://github.com/Danko-Lab/TED and Methods) was applied to determine the cellular composition of mouse kidney tissue at day 5 and day 10 post-induction. Pairwise comparison using Wilcoxon rank sum exact test and Benjamini–Hochberg p-value adjustment were used. f, Immunohistological staining of Fh1fl/fl (top) vs Fh1−/− (bottom) mouse kidney tissue at day 10 post-induction. Left: 2SC staining, right: CD14 staining. Scale bars: 100 μm. Source data
Extended Data Fig. 2
Extended Data Fig. 2. Characterization of inducible iFh1 epithelial kidney cell lines.
a, Schematic diagram of the generation of inducible iFh1 epithelial kidney cell lines clones 29 (iFh1fl/flCL29) and 33 (iFh1fl/flCL33). b, Mitochondrial membrane potential analysis using MitoTracker Red CMXROS in iFh1fl/flCL29 and iFh1fl/flCL33 cells treated with either vehicle (ethanol; EtOH) or 4-OHT (iFh1−/−CL29 and iFh1−/−CL33, respectively). Scale bar: 25 μm. c, Mitochondrial respiration measured using Seahorse in iFh1CL29 cells. n = 3 independent experiments. d, qRT-PCR showing expression levels of the transcriptional marker of Fh1 loss, Hmox1, in iFh1CL29 cells. n = 5 independent experiments. Bar graphs show the fold change expression, for which the expression in control samples was set to 1. Indicated p-values are relative to the corresponding vehicle (EtOH)-treated time point. e, Schematic of Pattern Recognition Receptors (PRR) and downstream cascades. f, qRT-PCR showing expression levels of Ifnb1 and ISGs (Ifi202b, Ifitm10, Areg and Ccl20) in iFh1CL29 cells. n = 5 independent experiments. Bar graphs show the fold change expression, for which the expression in control samples was set to 1. Indicated p-values are relative to the corresponding vehicle (EtOH)-treated time point. g-i, Classification of mitochondrial morphology (g), quantification of mitochondria number (h), and area (i), in iFh1CL29 cells. n = 3 independent experiments. Indicated p-values are relative to the corresponding vehicle (EtOH)-treated morphology category. j, TEM images (left) and mean mitochondria volume quantification (right) in wild-type (Fh1+/+) or chronic floxed Fh1 (cFh1fl/fl) mouse kidneys epithelial cells treated with Cre-expressing Adenovirus. Data are mean ± s.e.m. d,f, Students t-test corrected for multiple comparison with the Holm-Sidak method, g, two-way ANOVA with Tukey’s multiple comparison test, h,i, one-way ANOVA with Tukey’s multiple comparison test. For (g) p-values are indicated above each specific phenotype and relative to the corresponding phenotype in vehicle-treated control. Source data
Extended Data Fig. 3
Extended Data Fig. 3. Chronic loss of Fh1 leads to abnormal mitochondrial morphology and mtDNA release in the cytosol.
a, Representative N-SIM super-resolution images of mitochondrial morphology (TOM20) in epithelial kidney cell line with chronic Fh1 deletion (cFh1−/−CL1) from cFh1fl/fl, compared to cFh1fl/fl cells. Scale bar: 5 μm. b, Quantification of mitochondrial diameter in cFh1 cells from (a). n = 3 independent experiments. c, Quantification of mitochondrial morphology in cFh1 cells. n = 3 independent experiments. d, Quantification of mitochondrial number (left) and area (right) in cFh1 cells. n = 3 independent experiments. e, Representative confocal images of mitochondrial morphology (TOM20) and DNA foci (DNA) in cFh1 cells. White arrows indicate cytosolic DNA foci. Scale bar: 10 μm. f,g, Percentage of cFh1 cells showing cytosolic DNA (f), and number of cytosolic DNA foci per cell (g), from e. n = 6 independent experiments. h-j, Quantification of mtDNA copy number by ddPCR using either a mtCo3 (h), ND1 (i) or D-loop (j) probe, from isolated cytosolic fractions of cFh1 cells. n = 3 independent experiments. k, Immunoblots of specified proteins in cFh1 cells. l, Expression of inflammation-related Ifi202b and ISGs in cFh1 cells measured by qRT-PCR. n = 3 independent experiments. Data are mean ± s.e.m. b,d,f-j, one-way ANOVA with Tukey’s multiple comparison test, c,l, two-way ANOVA with Tukey’s multiple comparison test. Source data
Extended Data Fig. 4
Extended Data Fig. 4. MMF treatment phenocopies Fh1 loss.
a, Expression levels of the transcriptional markers of Fh1 loss Hmox1 and Nqo1 as well as Tfam expression in monomethyl fumarate (MMF)-treated cFh1fl/fl cells for 8 days compared to vehicle (DMSO)-treated cells, measured by qRT-PCR. n = 3 independent experiments. Bar graphs show the fold change expression, for which the expression in control samples was set to 1. b, Relative abundance of fumarate levels measured by LC–MS in iFh1fl/flCL29 untreated (NT) or treated with vehicle (iFh1fl/flCL29) or 4-OHT (iFh1−/−CL29) or 400 µM MMF for the indicated period of time. n = 5 independent experiments. c, Relative abundance of 2SC levels measured by LC–MS in iFh1CL29 cells and iFh1fl/flCL29 treated with 400 µM MMF for the indicated period of time. n = 5 independent experiments. d, Representative confocal images of cFh1fl/fl cells treated with vehicle (DMSO) or 400 µM MMF for the indicated period of time. Mitochondria and succinated proteins were labelled using anti-TOM20 and anti-2SC antibodies, respectively. Blue arrows indicate 2-SC-decorated proteins accumulation in mitochondria. Scale bar: 10 µm. e-g, Classification of mitochondrial morphology (e), quantification of mitochondrial number (f), and area (g) in cFh1fl/fl cells treated with DMSO or 400 µM MMF for 8 days. n = 3 independent experiments. Data are mean ± s.e.m. ac, one-way ANOVA with Tukey’s multiple comparison test, e, two-way ANOVA with Tukey’s multiple comparison test, f,g, one-way ANOVA with Tukey’s multiple comparison test, for (e) p-values are indicated above each specific phenotype and relative to the corresponding phenotype in vehicle (DMSO)-treated control. Source data
Extended Data Fig. 5
Extended Data Fig. 5. MMF treatment induces mtDNA release and the translocation of pTBK1 to the Golgi apparatus.
a, Percentage of MMF-treated cFh1fl/fl cells for 8 days showing cytosolic DNA foci according to mitochondrial morphology phenotype. n = 3 independent experiments. b,c, Quantification of mtDNA copy number by ddPCR using either a ND1 (b) or D-loop (c) probe, from isolated cytosolic fractions of DMSO- or MMF-treated (8 days) cFh1fl/fl cells. n = 3 independent experiments. d, Representative confocal images of cFh1fl/fl treated with 400 μM MMF or DMSO for 8 days. Mitochondria, Golgi apparatus, and pTBK1 were labelled using anti-TOM20, anti-GM130 and anti-pTBK1 antibodies, respectively. Scale bar: 10 μm. e, Quantification of cFh1fl/fl showing the percentage of cells with pTBK1 recruitment and colocalization with the Golgi apparatus marker, GM130 from d. n = 3 independent experiments. Data are mean ± s.e.m. b,c, one-way ANOVA with Tukey’s multiple comparison test, e, Students paired t-test. Source data
Extended Data Fig. 6
Extended Data Fig. 6. Cytosolic re-expression of FH only partially rescues the Fh1 loss phenotype.
a, Representative confocal images of cFh1−/−CL1 and cFh1−/−CL1 cells stably expressing pcytoFH-EGFP (cFh1−/−CL1+cytoFh1-GFP). Mitochondria and succinated proteins were labelled using Mitotracker and anti-2SC antibody, respectively. Nucleus was labelled using DAPI. Scale bar: 25 μm. b, Representative confocal images of cFh1fl/fl and cFh1−/−CL1 cells stably expressing pcytoFH-EGFP (cFh1−/−CL1+cytoFh1-GFP) or pFH-EGFP (cFh1−/−CL1+ pFH-GFP). Mitochondria and DNA were labelled using anti-TOM20 and anti-DNA antibodies, respectively. White arrows indicate cytosolic DNA foci. Scale bar: 10 μm. c, Fh1 mRNA expression levels in cFh1 cells measured by qRT-PCR. n = 3 independent experiments. d, Basal OCR in cFh1 cells measured using Seahorse. n = 5 independent experiments. e,f, Relative abundance of fumarate (e), and 2SC (f), in cFh1 cells measured by LC–MS. n = 5 independent experiments. g, Number of cytosolic DNA foci in cFh1 cells from b. n = 3 independent experiments. h, Representative immunoblots of specified proteins in cFh1 cells. i, mRNA expression levels of a panel of ISGs in cFh1 cells measured by qRT-PCR. n = 3 independent experiments. Data are mean ± s.e.m. c-g,i, one-way ANOVA with Tukey’s multiple comparison test. Source data
Extended Data Fig. 7
Extended Data Fig. 7. Effects of treatment with TCA-cycle intermediates on cytosolic mtDNA and the inflammation profile.
a, Representative confocal images of mitochondrial morphology (TOM20) and DNA foci (DNA) in iFh1fl/flCL29 cells treated with dimethylsuccinate (DMS) or vehicle (DMSO) for 8 days at the indicated concentration. Scale bar: 10 μm. b,c, Quantification of iFh1fl/flCL29 cells showing the percentage of cells with cytosolic DNA (b), and the number of cytosolic DNA foci per cell (c), from a. n = 3 independent experiments. d, Quantification of mtDNA copy number by ddPCR using a mtCo3 probe, from isolated cytosolic fractions of iFh1fl/flCL29 cells treated with DMSO or DMS. n = 3 independent experiments. e,f, Immunoblots of specified proteins in iFh1fl/flCL29 cells treated with αKG (e), and 2HG (f), at indicated concentration. g, Expression of the ISGs Ifnb1, Ifi202b, Ifitm10, Ccl20 and Areg in iFh1fl/flCL29 cells treated with DMSO, MMF, αKG or 2HG at indicated concentration, measured by qRT-PCR. n = 5 independent experiments. Data are mean ± s.e.m. b-d,g, one-way ANOVA with Tukey’s multiple comparison test, b-d, Bar graphs show the fold change expression, for which the expression in control samples was set to 1. p-values indicated above each bar are relative to the DMSO control. Source data
Extended Data Fig. 8
Extended Data Fig. 8. In cellulo and in vivo inhibition of the cGAS–STING pathway.
a, Top: schematic showing depletion of mtDNA in iFh1fl/flCL29 cells using ethidium bromide (EtBr). Bottom: representative confocal images of untreated iFh1fl/flCL29 and mtDNA-depleted iFh1fl/flCL29ρ0 cells. Mitochondria and DNA were labelled using anti-TOM20 and anti-DNA antibodies, respectively. Scale bar: 10 μm. b, mRNA expression of the ISGs Ifnb1, Areg and Mx1 in non-induced iFh1fl/fl CL29 and mtDNA-depleted iFh1fl/fl CL29 (Fh1ρ0) cell lines, treated with vehicle (DMSO) or 400 μM MMF for the indicated period of time, measured by qRT-PCR. n = 3 independent experiments. c, Representative confocal images of cFh1fl/fl cells treated with 400 μM MMF or vehicle (DMSO) for 8 days. cGAS and nucleus were labelled using an anti-cGAS antibody and DAPI staining, respectively. Scale bar: 10 μm. d, Quantification of cFh1fl/fl cells showing the percentage of cells with cytosolic cGAS translocation from c. n = 3 independent experiments. e, mRNA expression of a panel of ISGs in iFh1fl/flCL29 cells treated with vehicle (DMSO) or MMF and DMSO or cGAS inhibitor RU.521 for the indicated period of time, measured by qRT-PCR. n = 5 independent experiments. Bar graphs show the fold change expression, for which the expression in control samples was set to 1. f, mRNA expression of the ISGs Ifi202b and Ifitm10 in iFh1fl/fl CL29 cells at day 10 post-induction, treated with vehicle (DMSO) or cGAS inhibitor (RU.521), measured by qRT-PCR. The 4-OHT vs vehicle (EtOH) ratios are shown. n = 5 independent experiments. Bar graphs show the fold change expression, for which the expression in RU.521 samples was set to 1. g, mRNA expression of the ISGs Ifi202b, Ifitm10, and Ccl20 in cFh1fl/fl and cFh1−/−CL1 cells, treated with vehicle (DMSO) or cGAS inhibitor (RU.521), measured by qRT-PCR. n = 3 independent experiments. (h) mRNA expression of a panel of ISGs in mouse kidney tissue treated with the STING inhibitor H-151, measured by qRT-PCR. n = 9 mice per group. Black dots=Fh1+/+ + vehicle, red dots = Fh1−/− + vehicle, light blue dots = Fh1−/− + 0.7 mg H-151, dark blue dots = Fh1−/− + 1.4 mg H-151. i, Immunoblots of specified proteins in iFh1cl29 cells at 15 days post-induction transfected with indicated siRNA. Data are mean ± s.e.m. b, Students t-test (FDR two-stage Benjamini, Krieger and Yekutieli) at the corresponding time points, d,f, multiple Student’s t-test, e,g, two-way ANOVA with Tukey’s multiple comparison test, h, one-way ANOVA with Dunnett’s multiple comparison test. Source data
Extended Data Fig. 9
Extended Data Fig. 9. Targeted siRNA screen of key genes involved in mtDNA release and regulation of mitochondrial morphology.
a, Number of cytosolic DNA foci per cell in cFh1−/−CL1 cells treated with indicated siRNAs. n = 3 independent experiments. b-d, Quantification of mtDNA copy number by ddPCR using either a mtCo3 (b), ND1 (c) or D-loop (d) probe, from isolated cytosolic fractions of cFh1−/−CL1 cells. n = 3 independent experiments. e, Representative confocal images of cFh1+/+ and cFh1−/−CL1 cells. Mitochondria and cytochrome c (Cyt c) were labelled using anti-TOM20 and anti-cytochrome c antibodies, respectively. Scale bar: 10 μm. f, Immunoblots of specified proteins from whole cells (WCE), cytosol and heavy membrane (crude mitochondria) isolated fractions of cFh1 cells. Data are mean ± s.e.m. a-d, two-tailed unpaired t-test, p-values are indicated above each specific siRNA and relative to the scramble (scr) siRNA transfected control. Source data
Extended Data Fig. 10
Extended Data Fig. 10. Loss of Snx9 rescues mtDNA release and TBK1–IRF3 activation triggered by Fh1 loss.
a, Representative confocal images of mitochondrial morphology (TOM20) and DNA foci (DNA) in cFh1−/−CL19 cells transfected with scramble (scr) or Snx9 siRNA. White arrows indicate cytosolic DNA foci. Scale bars: 10 μm. b, Number of cytosolic DNA foci per cell in cFh1 cells. n = 3 independent experiments. c, Percentage of cells with cytosolic DNA foci in cFh1 cells. n = 3 independent experiments. d, Immunoblots of specified proteins of cFh1 cells. e,f, Quantification of mitochondrial number (e), and area (f), in cFh1 cells. n = 3 independent experiments. g,h, Average number of cytosolic DNA foci per cell (g), and number of cytosolic DNA foci per cell (h), in iFh1fl/flCL29 cells transfected with scr or Snx9 siRNA and treated with either vehicle (EtOH) or 4-OHT (iFh−/−CL29) for the indicated period of time. n = 3 independent experiments. i, Immunoblots of specified proteins in iFh1CL29 cells. j-l, Quantification of mtDNA copy number by ddPCR using either a mtCo3 (j), ND1 (k) or D-loop (l) probe, from isolated cytosolic fractions of iFh1fl/flCL29 cells. n = 3 independent experiments. Data are mean ± s.e.m. b,c,e-h,j-l, one-way ANOVA with Tukey’s multiple comparison test. Source data
Extended Data Fig. 11
Extended Data Fig. 11. Characterization of MDVs containing mtDNA.
a,b, Percentage of cells harbouring TOM20PDH+DNA+ MDVs (a), and number of TOM20PDH+ MDVs containing or not mtDNA per cell (b), in cFh1fl/fl cells treated with vehicle (DMSO) or 400 μM monomethyl fumarate (MMF) for the indicated period of time. n = 3 independent experiments. p-values are indicated above each specific time point and relative to the untreated control for each of the one (a) or two (b) parameters. c, Number of cytosolic DNA foci per cell in cFh1fl/fl cells. n = 3 independent experiments. d, Representative Airyscan super-resolution images of cFh1fl/fl cells treated with 400 μM MMF for 6 days. Mitochondria were labelled using anti-TOM20 and anti-PDH antibodies, TFAM using an anti-TFAM antibody, and DNA using an anti-DNA antibody. White arrows indicate TOM20PDH+DNA+TFAM+ MDVs. Scale bar: 5 μm. e, Representative lattice super-resolution SIM image of MMF-treated cFh1fl/fl cells (6 days). Mitochondria were labelled using anti-TOM20 and anti-PDH antibodies, TFAM using an anti-TFAM antibody, and DNA using an anti-DNA antibody. Scale bar: 5 μm; magnification : scale bar: 1 μm. f,g, Quantification of the average maximal Feret’s diameter (f), and average area (g), of TOM20PDH+DNA+ MDVs from e. n = 3 independent experiments. h, Representative confocal images of iFh1fl/flCL29 cells treated with either vehicle (ethanol; EtOH) or 4-OHT (iFh−/−CL29) for the indicated period of time. Mitochondria were labelled using anti-TOM20 and anti-PDH antibodies, and DNA using an anti-DNA antibody. White arrows indicate TOM20PDH+DNA+ MDVs. Scale bar: 10 μm. i, Quantification of TOM20PDH+DNA+ MDVs from h. n = 3 independent experiments. Data are mean ± s.e.m. a,c,i, one-way ANOVA with Tukey’s multiple comparison test, b, two-way ANOVA with Tukey’s multiple comparison test. Source data
Extended Data Fig. 12
Extended Data Fig. 12. Loss of Snx9 prevents MDV formation and inflammation induced by Fh1 loss.
a, Representative confocal images of iFh1fl/flCL29ρ0 cells treated with 400 μM MMF for 1–8 days. Mitochondria were labelled using anti-TOM20 and anti-PDH antibodies, and DNA using an anti-DNA antibody. Scale bar: 10 μm. b, Quantification of the number of TOM20PDH+ MDVs from a. n = 3 independent experiments. c, Number of cytosolic DNA foci per cell in cFh1fl/fl cells pre-transfected with scramble (scr) or Snx9 siRNA and treated with vehicle (DMSO) or MMF for 6 days. n = 3 independent experiments. d, mRNA expression of a panel of ISGs in cFh1fl/fl cells pre-transfected with scramble (scr) or Snx9 siRNA and treated with 400 μM MMF or vehicle (DMSO) for the indicated period of time, measured by qRT-PCR. n = 3 independent experiments. Bar graphs show the fold change expression, for which the expression in control samples was set to 1. Data are mean ± s.e.m. b-d, one-way ANOVA with Tukey’s multiple comparison test. Source data

Comment in

References

    1. The Multiple Leiomyoma Consortium. Germline mutations in FH predispose to dominantly inherited uterine fibroids, skin leiomyomata and papillary renal cell cancer. Nat. Genet. 2002;30:406–410. doi: 10.1038/ng849. - DOI - PubMed
    1. Schmidt C, Sciacovelli M, Frezza C. Fumarate hydratase in cancer: a multifaceted tumour suppressor. Semin. Cell Dev. Biol. 2020;98:15–25. doi: 10.1016/j.semcdb.2019.05.002. - DOI - PMC - PubMed
    1. Pollard PJ, et al. Accumulation of Krebs cycle intermediates and over-expression of HIF1α in tumours which result from germline FH and SDH mutations. Hum. Mol. Genet. 2005;14:2231–2239. doi: 10.1093/hmg/ddi227. - DOI - PubMed
    1. Pollard PJ, et al. Targeted inactivation of Fh1 causes proliferative renal cyst development and activation of the hypoxia pathway. Cancer Cell. 2007;11:311–319. doi: 10.1016/j.ccr.2007.02.005. - DOI - PubMed
    1. Hameyer D, et al. Toxicity of ligand-dependent Cre recombinases and generation of a conditional Cre deleter mouse allowing mosaic recombination in peripheral tissues. Physiol. Genomics. 2007;31:32–41. doi: 10.1152/physiolgenomics.00019.2007. - DOI - PubMed

Publication types