. 2023 Mar;615(7953):697-704.
doi: 10.1038/s41586-023-05787-1. Epub 2023 Mar 8.

Neoantigen-targeted CD8+ T cell responses with PD-1 blockade therapy

Affiliations

Neoantigen-targeted CD8+ T cell responses with PD-1 blockade therapy

Cristina Puig-Saus et al. Nature. 2023 Mar.

Abstract

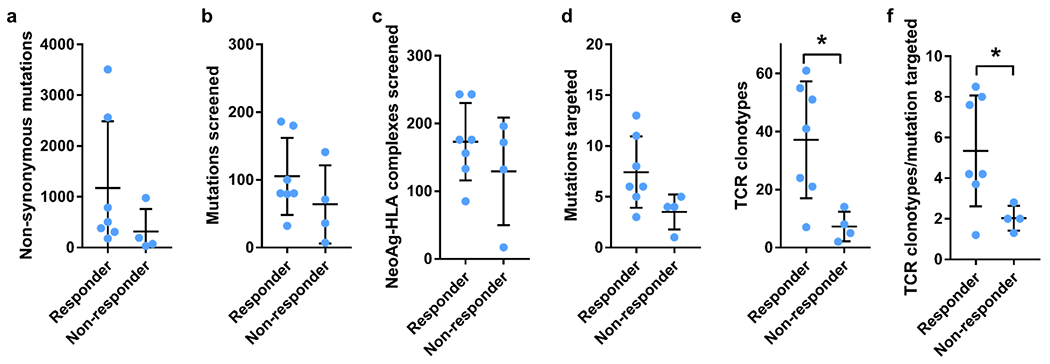
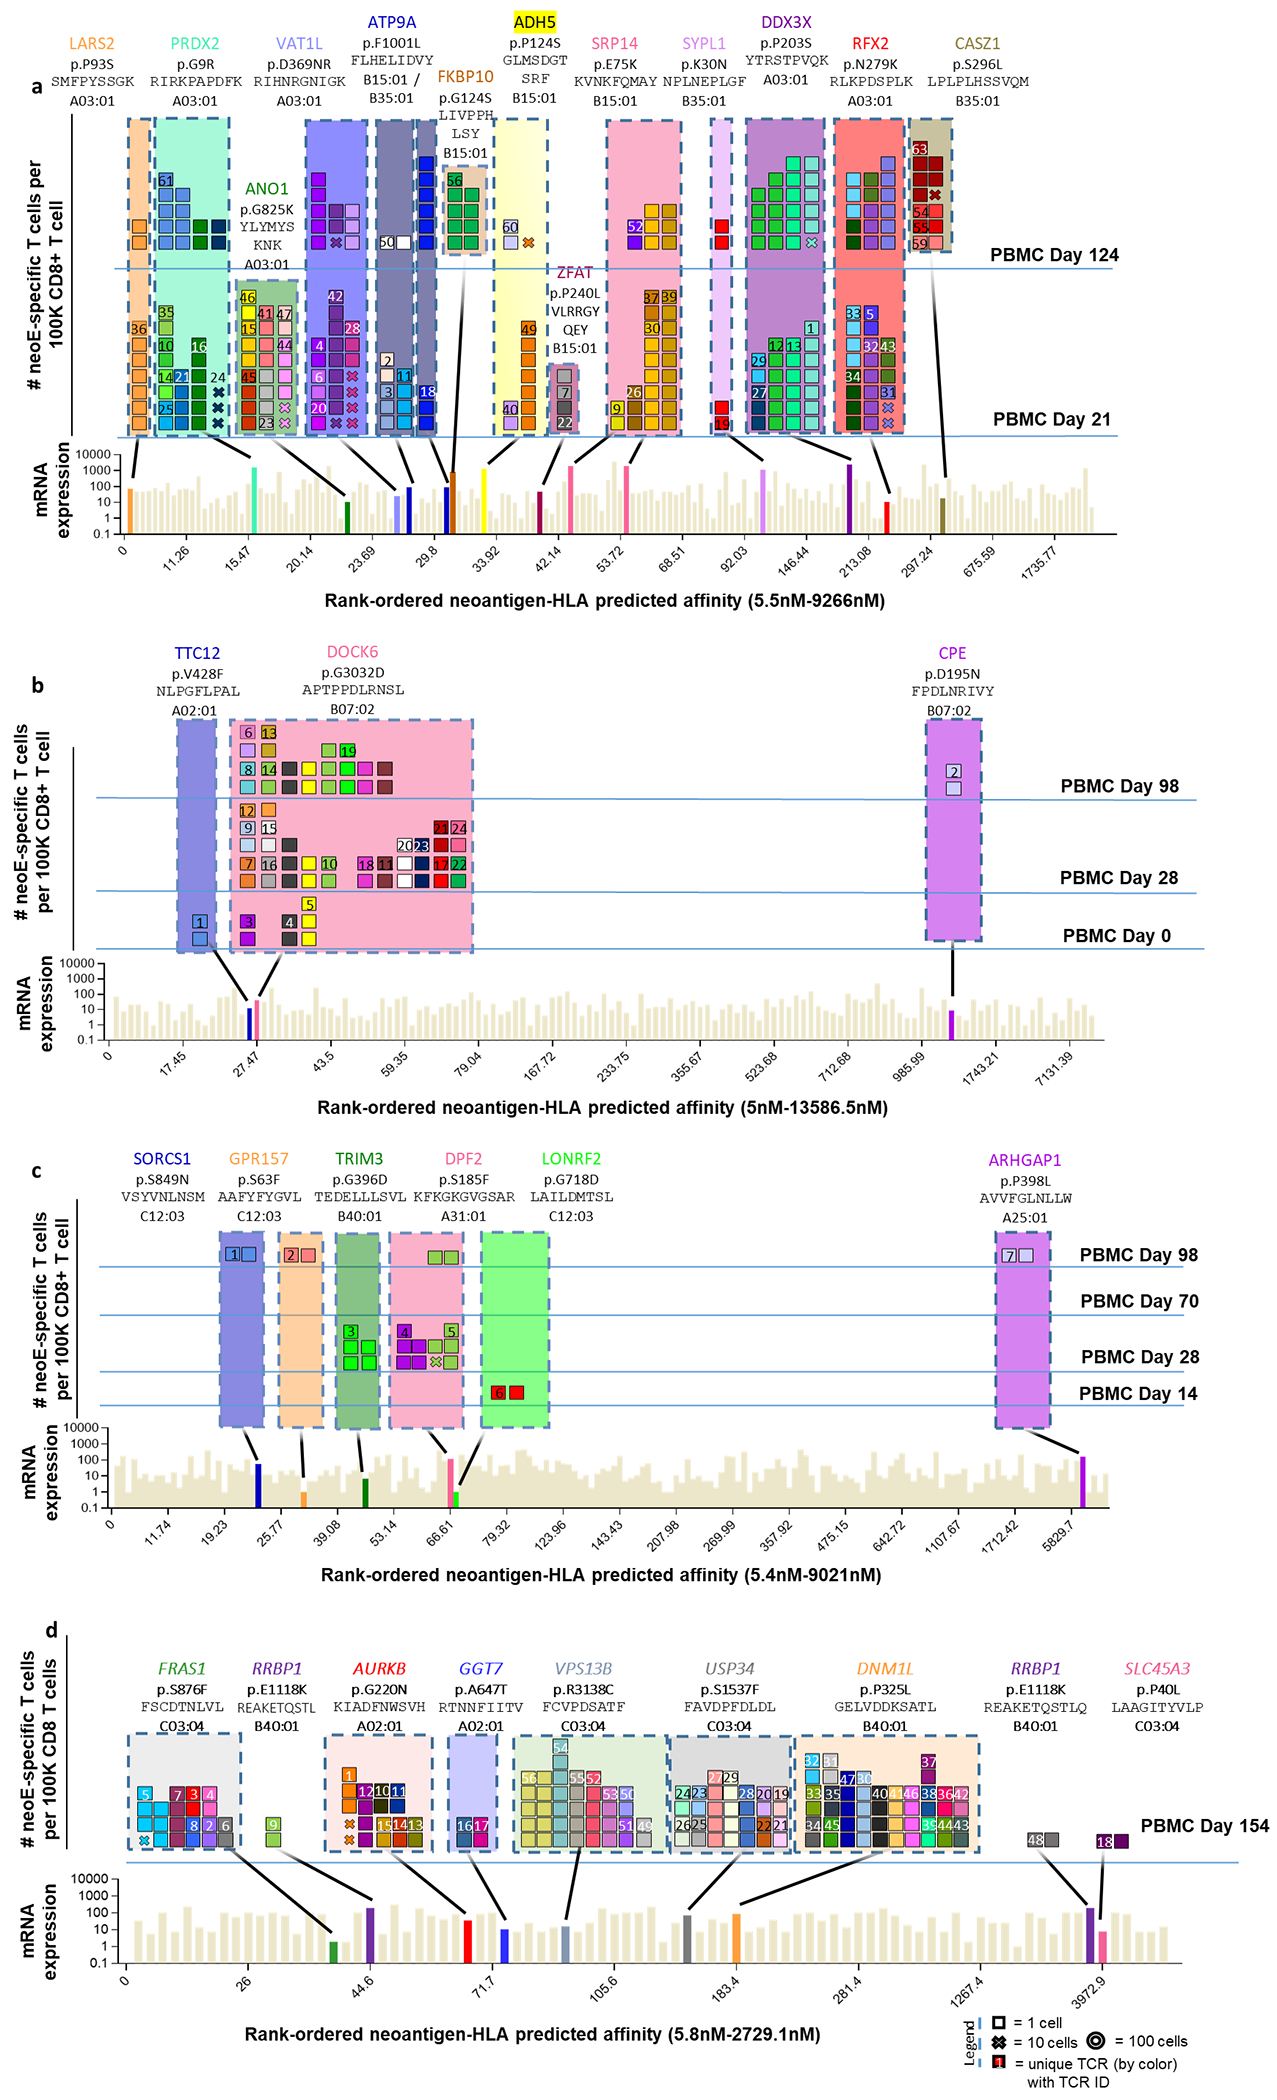
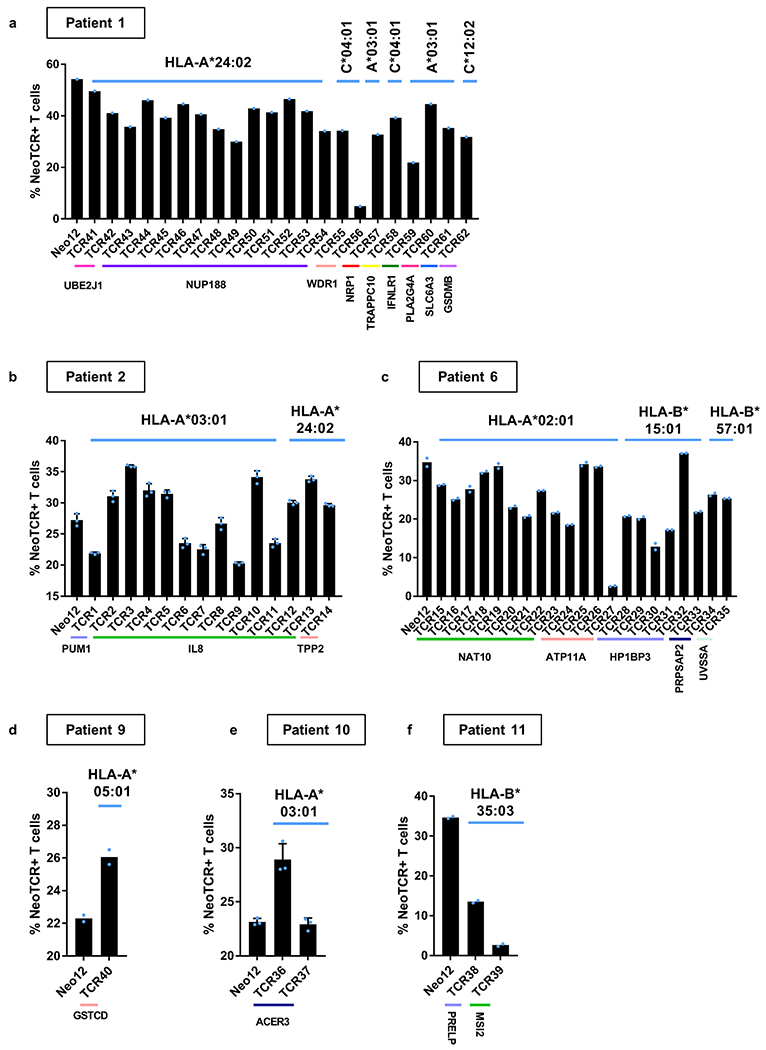
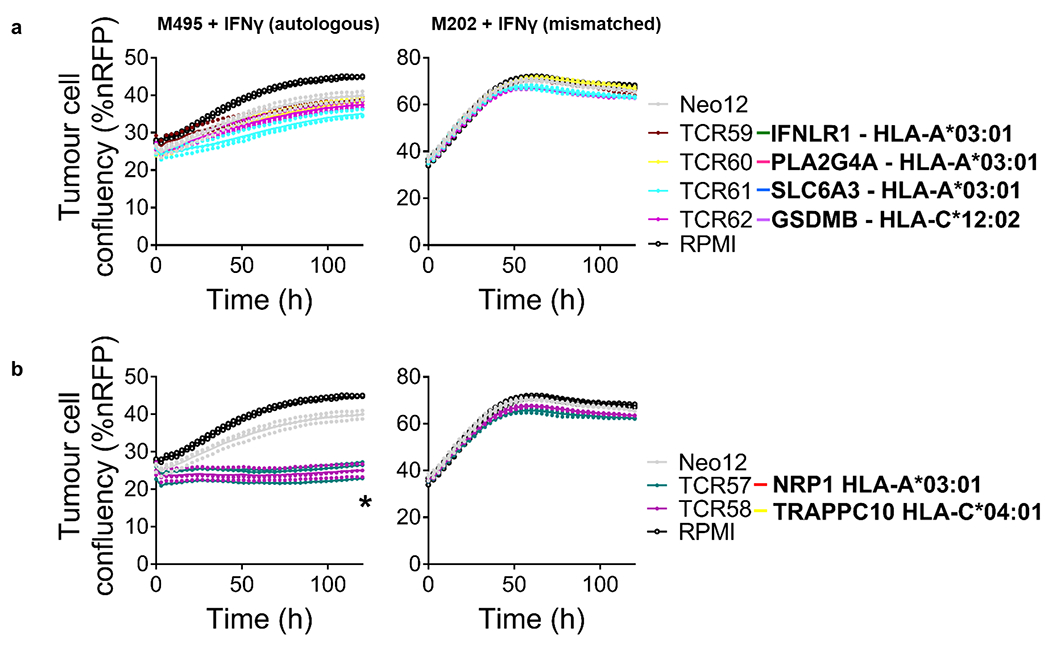
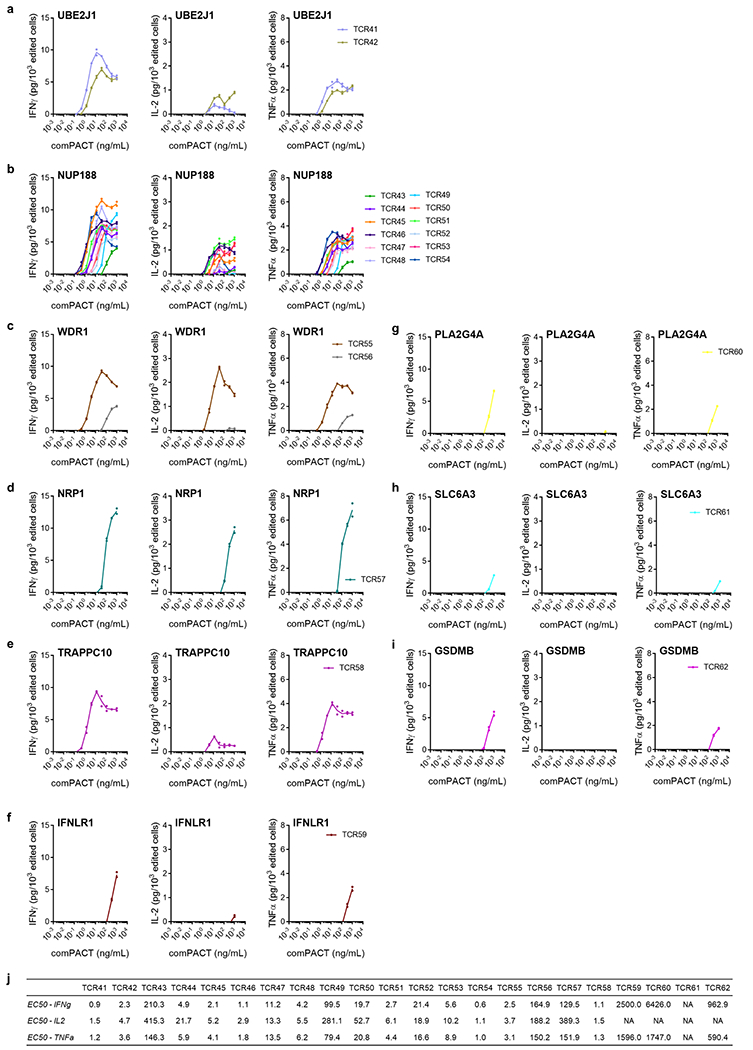
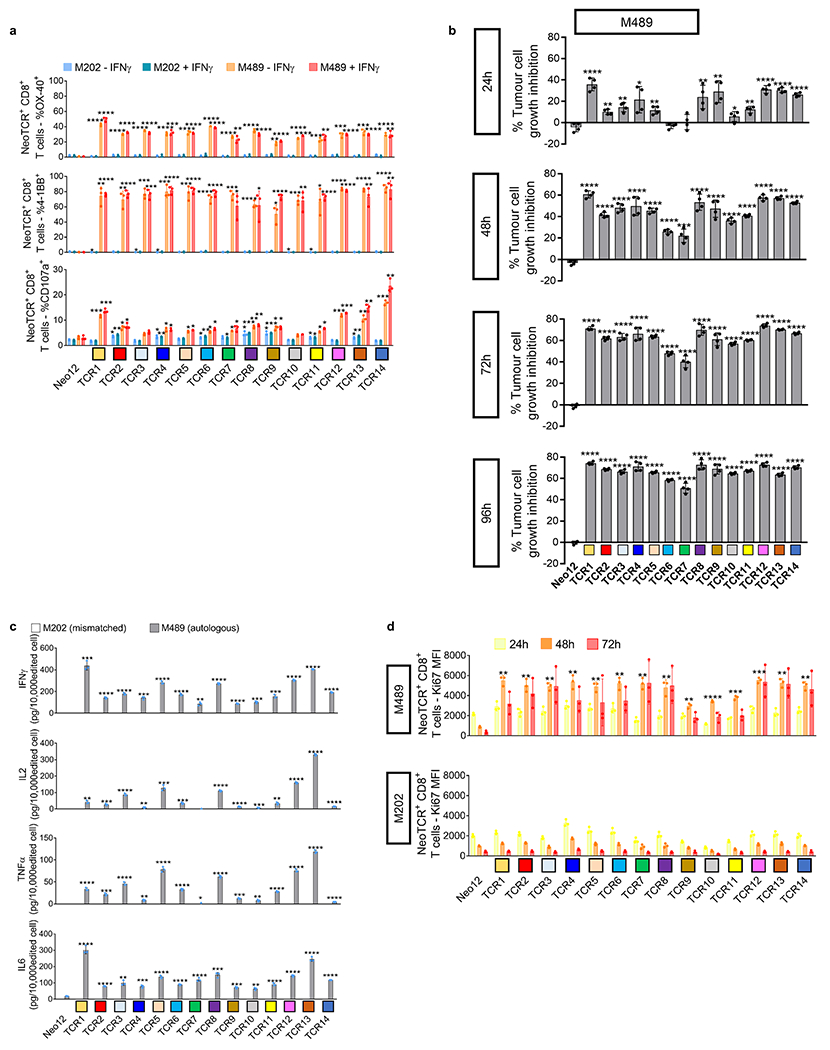
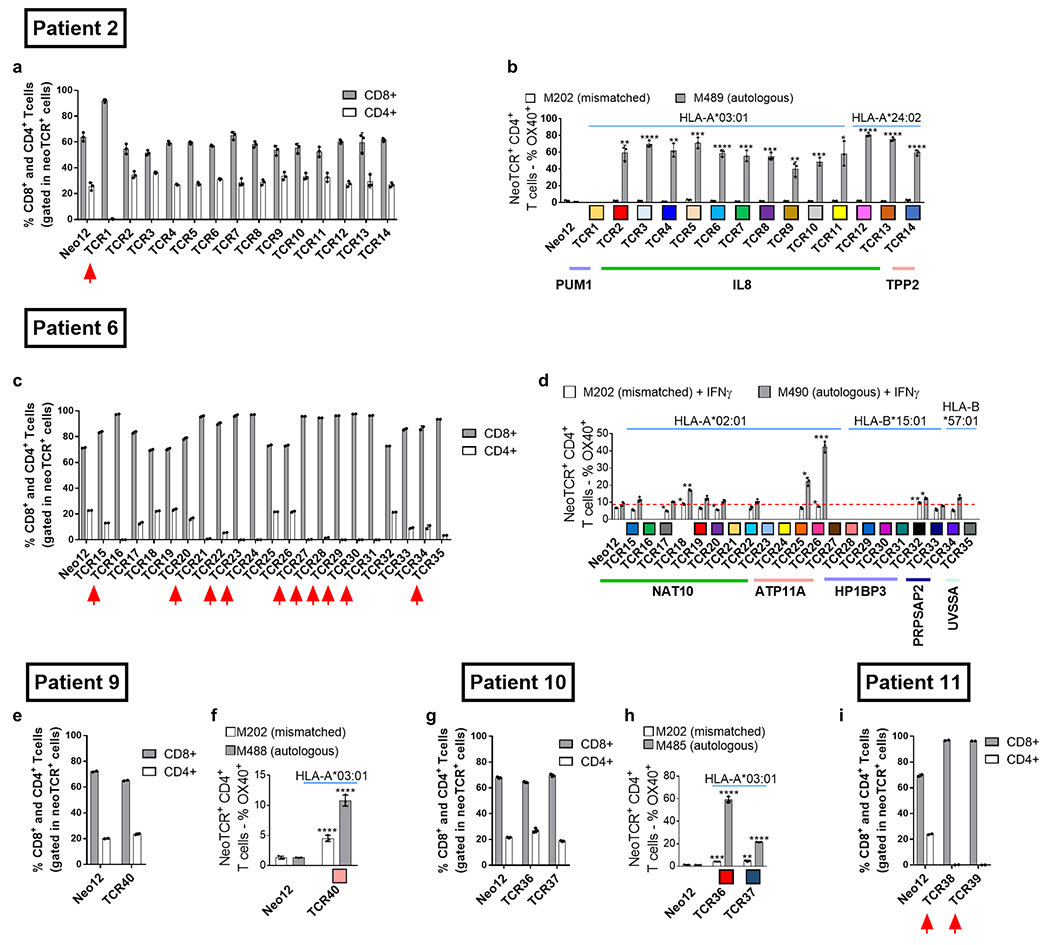
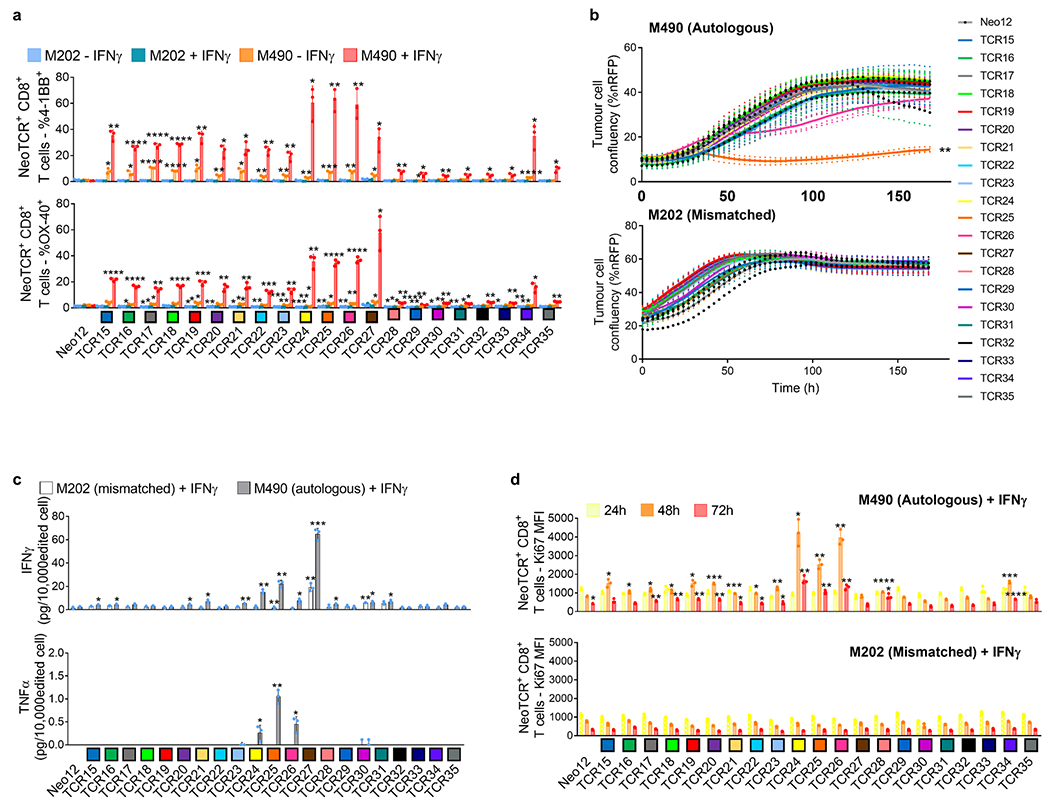
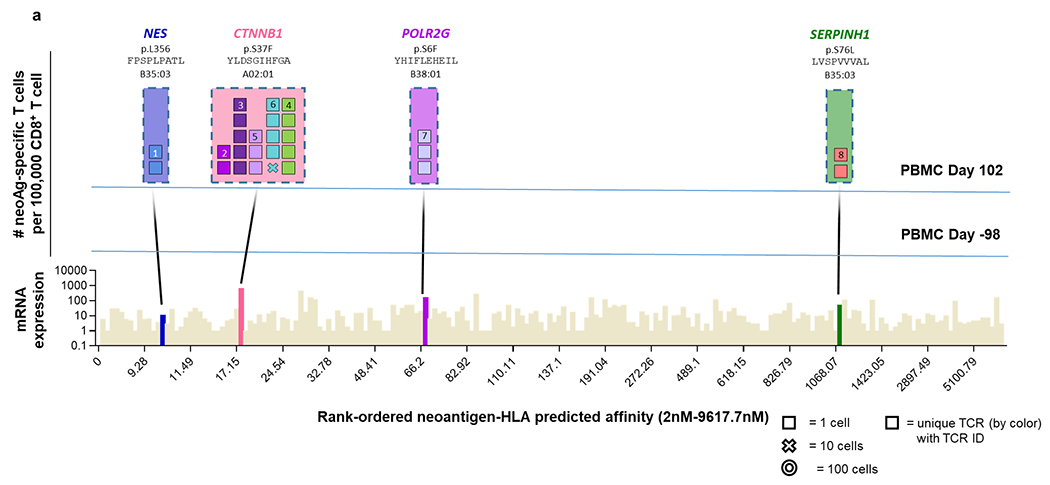
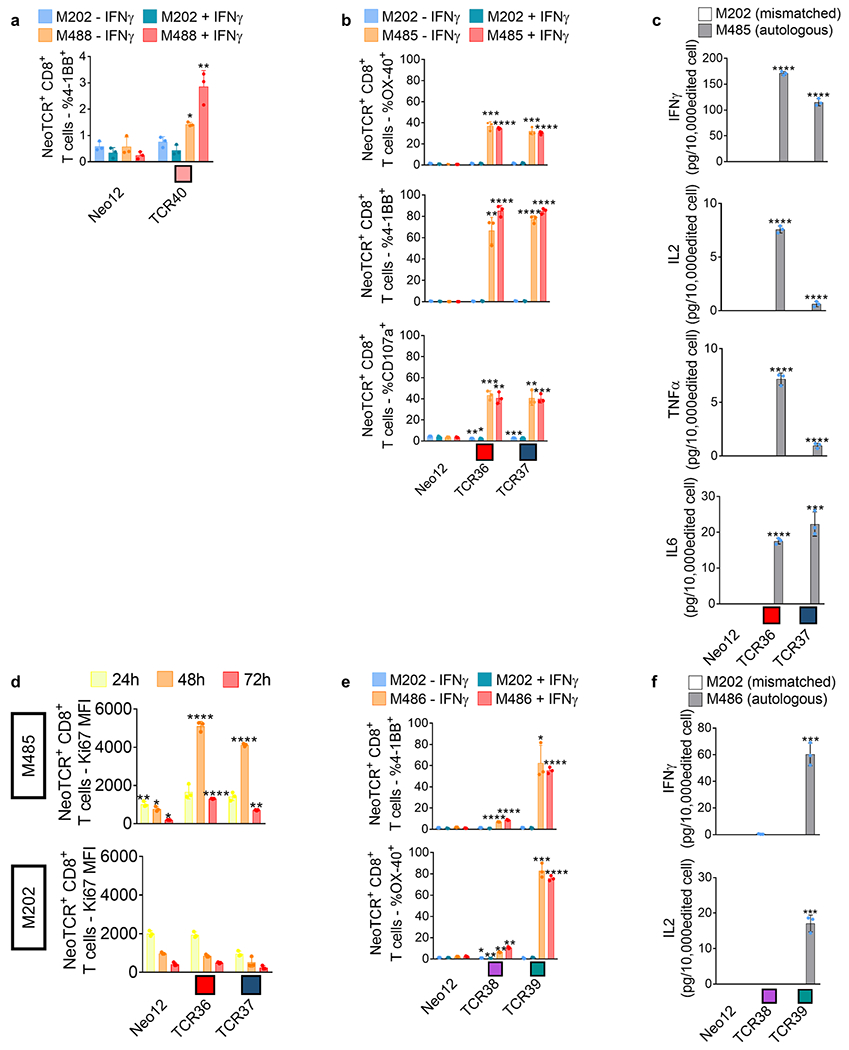
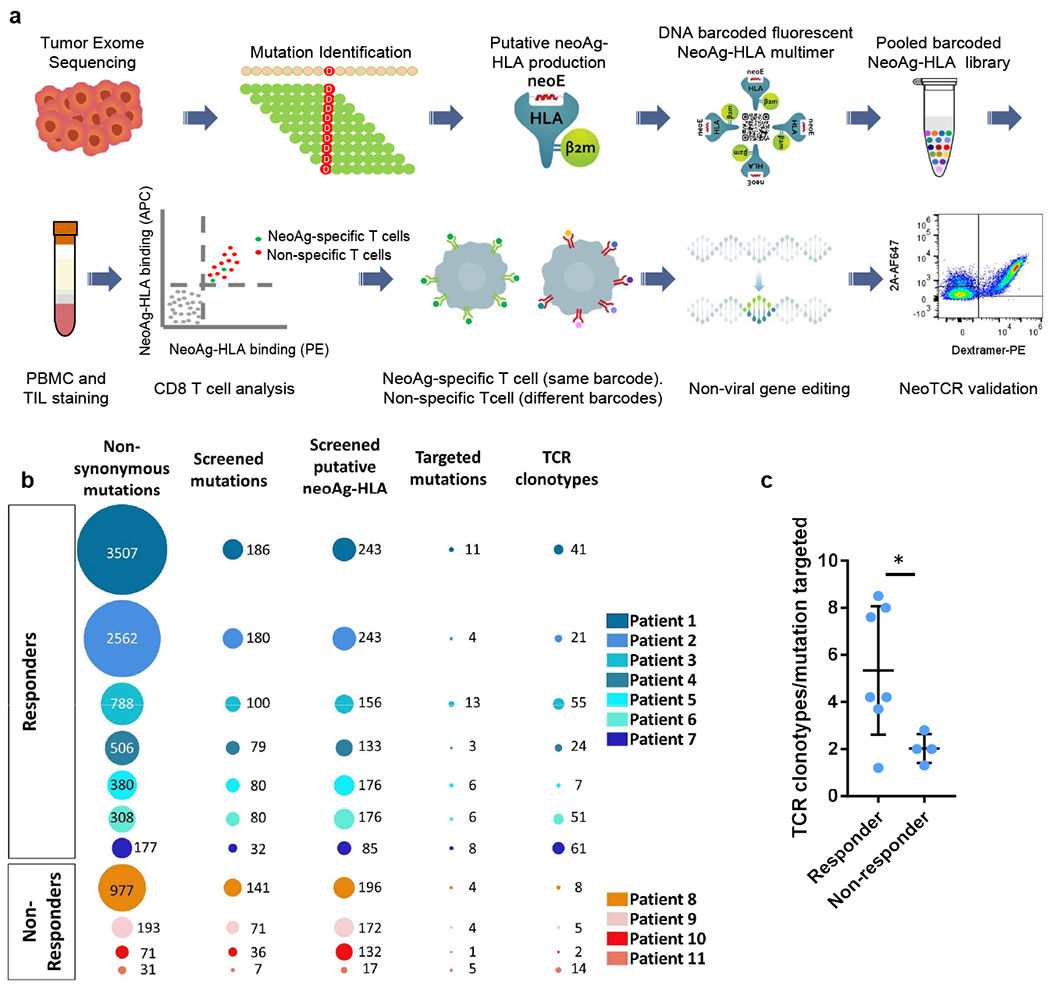
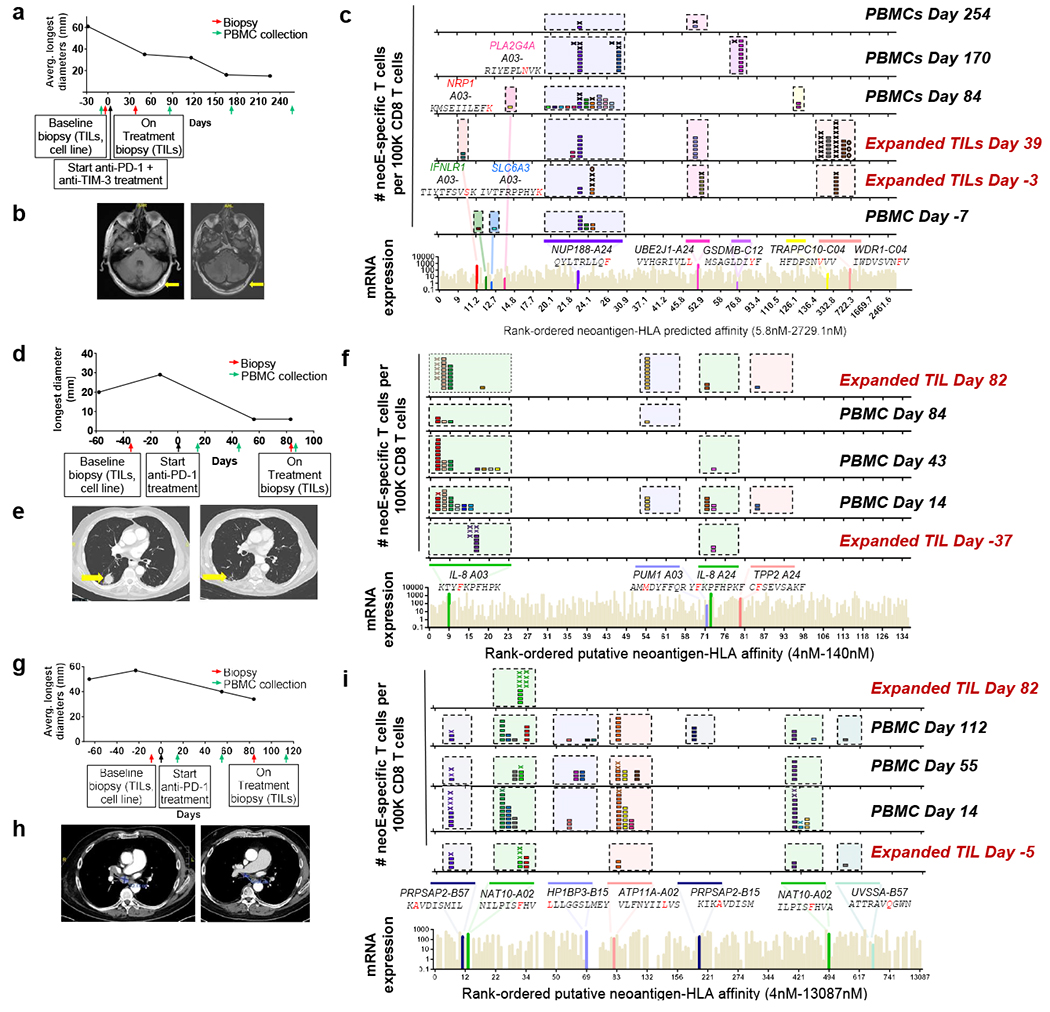
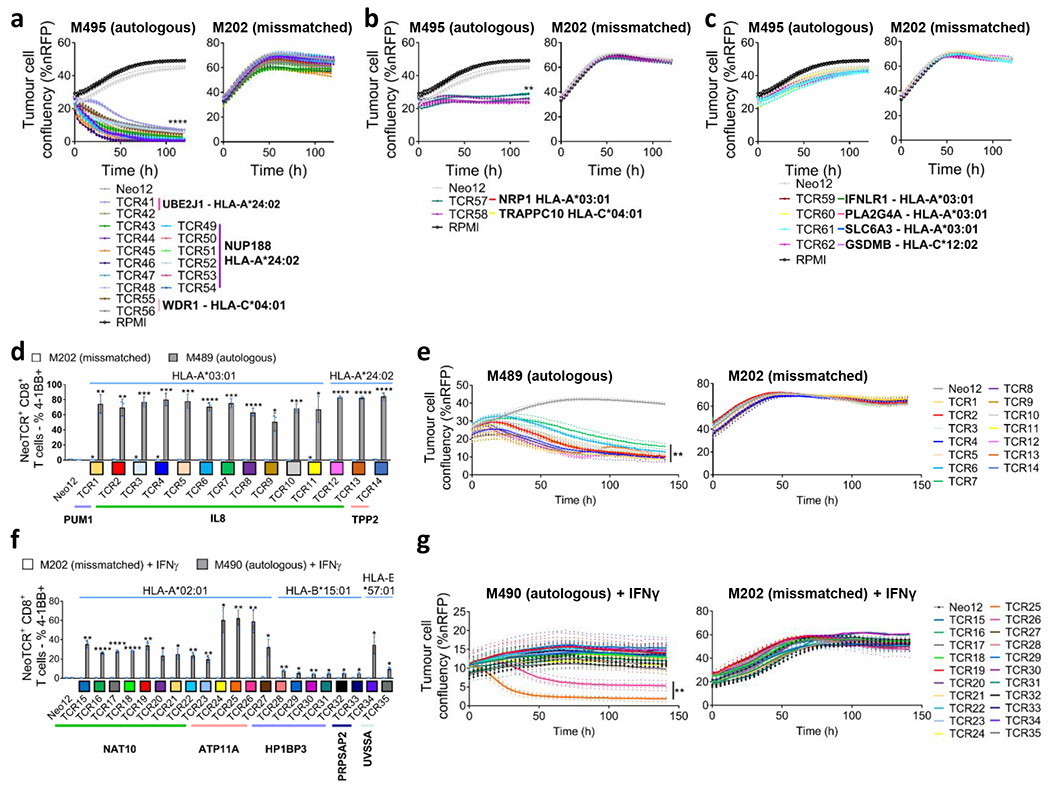
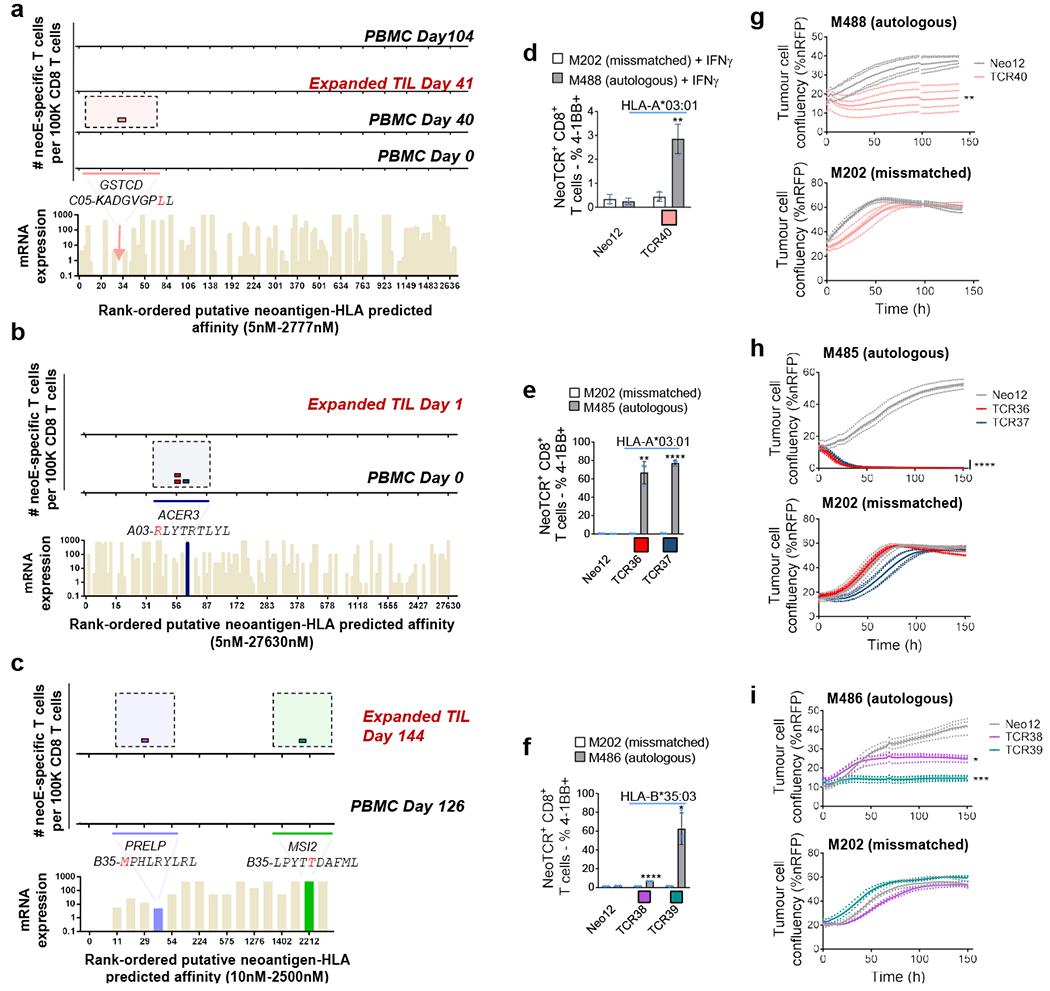
Neoantigens are peptides derived from non-synonymous mutations presented by human leukocyte antigens (HLAs), which are recognized by antitumour T cells1-14. The large HLA allele diversity and limiting clinical samples have restricted the study of the landscape of neoantigen-targeted T cell responses in patients over their treatment course. Here we applied recently developed technologies15-17 to capture neoantigen-specific T cells from blood and tumours from patients with metastatic melanoma with or without response to anti-programmed death receptor 1 (PD-1) immunotherapy. We generated personalized libraries of neoantigen-HLA capture reagents to single-cell isolate the T cells and clone their T cell receptors (neoTCRs). Multiple T cells with different neoTCR sequences (T cell clonotypes) recognized a limited number of mutations in samples from seven patients with long-lasting clinical responses. These neoTCR clonotypes were recurrently detected over time in the blood and tumour. Samples from four patients with no response to anti-PD-1 also demonstrated neoantigen-specific T cell responses in the blood and tumour to a restricted number of mutations with lower TCR polyclonality and were not recurrently detected in sequential samples. Reconstitution of the neoTCRs in donor T cells using non-viral CRISPR-Cas9 gene editing demonstrated specific recognition and cytotoxicity to patient-matched melanoma cell lines. Thus, effective anti-PD-1 immunotherapy is associated with the presence of polyclonal CD8+ T cells in the tumour and blood specific for a limited number of immunodominant mutations, which are recurrently recognized over time.


Conflict of interest statement

B.S., S.P., C.L.W., Z.P., B.P., A.C., D.A., B.B.Q., B.Y., K.J., O.D., D.N., K.S., J.G., J. Hoover., S. Said., W.L., C.S., K.H., Y.M., S.C., M.J.P., M.T., R.T., C.M., P.P., S.N., S.P.F., T.H., M.Y., S. Sandoval., R.M., X.R.B., M.T.B., A.F. and S.J.M. are current or former employees of PACT Pharma, and hold stock in the company. S.P., M.T.B., J.R.H. and A.R. are co-founders of PACT Pharma, and hold founder stock. J.R.H. and A.R. are members of the scientific advisory board of PACT Pharma. J.R.H. and A.R. are members of the board of directors of PACT Pharma. A.R. has received honoraria from consulting with Amgen, Bristol-Myers Squibb, Chugai, Dynavax, Genentech, Merck, Nektar, Novartis, Roche and Sanofi; is or has been a member of the scientific advisory board and holds stock in Advaxis, Arcus Biosciences, Bioncotech Therapeutics, Compugen, CytomX, Five Prime, RAPT, ImaginAb, Isoplexis, Kite-Gilead, Lutris Pharma, Merus, Rgenix and Tango Therapeutics. C.P.-S. and A.R. are listed as inventors on and receive licensing revenue from a patent application covering the use of non-viral gene editing of T cells that was licensed by The Regents of the University of California to Arsenal Bio (South San Francisco; WO2019084552A1, application filed by The Regents Of The University Of California); the methods and technology described therein were not used in the experiments performed herein. A.G. reports receiving funding from Novartis, VCN Biosciences and Merck KGaA, has received speaker honoraria from Roche, and has consulted for Achilles Therapeutics, Neon Therapeutics, PACT Pharma and Oxford Immunotherapy. Patent applications have been filed on aspects of the described work by PACT Pharma, entitled ‘Peptide-MHC comPACTs’, ‘Compositions and Methods For Identification of Antigen Specific T Cells’ and ‘Primary Cell Gene Editing’. The other authors declare no competing interests.

Figures

Extended Data Fig. 1 |
Extended Data Fig. 1 |. Neoantigen-specific T-cell isolation and TCR clonotype identification. Summary of key parameters from the longitudinal landscape analysis of neoantigen-specific T cells in patients with and without response to therapy.
a, Total number of non-synonymous mutations. b, Total number of mutations screened. c, Total number of predicted neoantigen–HLA complexes screened. c, Total number of mutations targeted. e, Total number of neoantigen-specific TCR clonotypes isolated. f, Ratio of the number of neoantigen specific TCR clonotypes isolated per mutation targeted in each patient. Mean ± SD and individual values are plotted. (n) indicates the number of different patients, n = 7 for responders and n = 4 for non-responders. * p < 0.05, two-tailed unpaired t test, using the Two-stage linear step-up procedure of Benjamini, Krieger and Yekutieli, with Q = 1%. p = 0.0190 for TCR clonotypes and p = 0.0434 for TCR clonotype/mutation targeted.
Extended Data Fig. 2 |
Extended Data Fig. 2 |. Neoantigen-specific T-cell isolation from PBMCs in patients with response to anti-PD-1 therapy.
a, Landscape analysis of the neoantigen-specific T cells over time in patient 3. Bottom panel shows mRNA expression and predicted HLA binding affinity of the putative neoantigens screened. Neoantigens targeted by T cells are highlighted in different colours. The same colour code is used in the top panels to show the neoantigen specificity of the isolated T cells. The top panels show the evolution over time of the neoantigen-specific T cells in PBMCs. Each box represents one isolated T cell, each cross is equivalent to ten isolated T cells, and each circle is equivalent to 100 isolated T cells. Each colour represents a different neoantigen-specific T-cell clonotype. The TCR ID is also plotted. The number of isolated T cells is normalized to 100,000 CD8+ T cells using a round up method to plot the data. The mutated gene name, the point mutation, the sequence of the neoantigen, and the HLA are indicated on top of the figure. The T cell clonotypes shown have not been validated by expression in healthy donor T cells and binding to neoantigen–HLA complexes. b, Same as a for patient 4. c, Same as a for patient 5. d, Same as a for patient 7.
Extended Data Fig. 3 |
Extended Data Fig. 3 |. Captured neoTCR specific neoantigen–HLA binding validation.
After capture of the neoantigen-specific T cells, the cognate TCR is sequenced, and the sequence used to gene edit healthy donor T cells replacing the endogenous TCR by the neoTCR. The neoTCR specificity and stability are validated by multimer staining of the gene-edited T cells. Only validated TCRs are shown. a-f. Multimer staining of the gene edited T-cell products gated on live cells from patient 1 or Live/CD45+ cells from patients 2, 6, 9, 10, 11 (n = 1 for patient 1, n = 2 for patient 6, 9 and 11, and n = 3 for patients 2 and 10). Mean ± SD and individual values are plotted. (n) indicates the number of technical replicates.
Extended Data Fig. 4 |
Extended Data Fig. 4 |. Cytotoxicity induced by neoantigen-specific TCRs from patient 1 upon co-culture with the autologous cell line.
Healthy donor T cells genetically engineered to express the captured neoTCRs from patient 1 were co-cultured with the autologous (M495) or a mismatched cell line (M202). a-b, Specific target-cell killing by neoTCR gene-edited T cells of the autologous cell line and the mismatched control (P:T ratio 5:1, n = 4)). Melanoma cell lines were pre-treated with media with IFNγ 24 h prior co-culture with T cells. The plots are divided between TCRs without killing activity (a) and TCRs with intermediate killing (b). * p < 0.05 vs Neo12, two-tailed unpaired t test with Holm-Sidak adjustment for multiple comparison (n) indicates the number of biological replicates. Exact p-values provided in Supplementary Information. Mean and individual values are shown. All T-cell products contain CD8+ and CD4+ gene-edited T cells.
Extended Data Fig. 5 |
Extended Data Fig. 5 |. Titration of cytokine secretion by neoantigen-specific TCRs from patient 1 upon binding to specific neoantigen–HLA multimer.
Healthy donor T cells genetically engineered to express the captured neoTCRs from patient 1 were incubated with increasing amounts of plate-bound neoantigen–HLA multimer specific for each TCR and, 24 h after incubation, the IFNγ, IL-2, and TNF secreted were measured. a, NeoTCRs targeting UBE2J1 mutation presented by HLA-A*24:02. b, NeoTCRs targeting NUP188 mutation presented by HLA-A*24:02. c, NeoTCRs targeting WDR1 mutation presented by HLA-A*03:01. d, NeoTCRs targeting NRP1 mutation presented by HLA-A*03:01. e, NeoTCRs targeting TRAPPC10 mutation presented by HLA-C*04:01. f, NeoTCRs targeting IFNLR1 mutation presented by HLA-A*03:01. g, NeoTCRs targeting PLA2G4A mutation presented by HLA-A*03:01. h, NeoTCRs targeting SLC6A3 mutation presented by HLA-A*03:01. i, NeoTCRs targeting GSDMB mutation presented by HLA-C*12:02. j, Summary EC50 calculated for each TCR and each cytokine. (n = 2), (n) indicates the number of biological replicates. Mean and individual values are shown. All T-cell products contain CD8+ and CD4+ gene-edited T cells.
Extended Data Fig. 6 |
Extended Data Fig. 6 |. Activation, cytotoxicity, cytokine secretion, and proliferation induced by neoantigen-specific TCRs from patient 2 upon co-culture with the autologous cell line.
Healthy donor T cells genetically engineered to express the captured neoTCRs from patient 2 were co-cultured with the autologous (M489) or a mismatched cell line (M202). a, 4-1BB, OX-40, and CD107a upregulation in the CD8+ neoTCR+ T cells after co-culture. Melanoma cell lines were pre-treated with regular media or media with IFNγ 24 h prior co-culture with T cells (n = 3). b, percentage of tumour growth inhibition in M489 autologous cell line compared to the cell growth in media alone at 24, 48, 72 and 96 h (n = 4). c, Cytokine release at 24 h after co-culture (n = 3). d, Proliferation of CD8+ neoTCR+ T cells measured by Ki67 mean fluorescence intensity upon 24, 48 and 72 h co-culture with autologous melanoma cell line (M489, top panel) or a mismatched cell line (M202, bottom panel) (n = 3). * p < 0.05, ** p < 0.005, ***p < 0.0005, ****p < 0.0001 vs Neo12, two-tailed unpaired t test with Holm-Sidak adjustment for multiple comparisons in figure a, b and c. * p < 0.05, ** p < 0.005, ***p < 0.0005, ****p < 0.0001 vs M202, two-tailed unpaired t test with Holm-Sidak adjustment for multiple comparisons in figure d. Exact p-values provided in Supplementary Information. (n) indicates the number of biological replicates. Mean ± SD and individual values are shown. All T-cell products contain CD8+ and CD4+ gene-edited T cells.
Extended Data Fig. 7 |
Extended Data Fig. 7 |. Function of the CD8-independent TCRs in gene-edited CD4+ T cells.
a,c,e,g,i. Percentage of CD8+ and CD4+ in the neoTCR+ T cell population. n = 2 for patients 6, 9 and 11, and n = 3 for patients 2 and 10). CD8-dependent TCRs, described as TCRs that require CD8 co-receptor engagement to bind to the MHC-peptide, are marked with a red arrow. b,d,f,h, Percentage of OX-40+ cells in the NeoTCR+CD4+ T cells. (n = 3) *p < 0.05, **p < 0.005, ***p < 0.0005,****p < 0.0001 vs Neo12, two-tailed unpaired t test with Holm-Sidak adjustment for multiple comparison in figures b, d, and h. The same test without adjustment for multiple comparisons was used in figure f. Exact p-values provided in Supplementary Information. (n) indicates the number of biological replicates. Mean ± SD are shown. All T-cell products contain CD8+ and CD4+ gene-edited T cells.
Extended Data Fig. 8 |
Extended Data Fig. 8 |. Activation, cytotoxicity, cytokine secretion, and proliferation induced by neoantigen-specific TCRs from patient 6 upon co-culture with the autologous cell line.
Healthy donor T cells genetically engineered to express the captured neoTCRs from patient 6 were co-cultured with the autologous (M490) or a mismatched cell line (M202). a, 4-1BB and OX-40 upregulation in the CD8+ neoTCR+ T cells after co-culture. Melanoma cell lines were pre-treated with regular media or media with IFNγ 24 h prior co-culture with T cells (n = 3). b, Specific target-cell killing in the autologous cell line (top panel) or a mismatched cell line (bottom panel), (P:T ratio 10:1, n = 4). c, Cytokine release at 24 h after co-culture (n = 3). Melanoma cell lines were pre-treated with IFNγ for 24 h before co-culture with T cells. d, Proliferation of CD8+ neoTCR+ T cells measured by Ki67 mean fluorescence intensity upon 24, 48 and 72 h co-culture with autologous melanoma cell line (M490, top panel) or a mismatched cell line (M202, bottom panel). Melanoma cell lines were pretreated with IFNγ 24 h prior co-culture with T cells (n = 3). *p < 0.05, **p < 0.005, ***p < 0.0005, ****p < 0.0001 vs Neo12, two-tailed unpaired t test with Holm-Sidak adjustment for multiple comparisons in figure a, b and c. *p < 0.05, **p < 0.005, ***p < 0.0005, ****p < 0.0001 vs M202, two-tailed unpaired t test with Holm-Sidak adjustment for multiple comparisons in figure d. (n) indicates the number of biological replicates. Exact p-values provided in Supplementary Information. Mean ± SD and individual values are shown in a, c and d. Mean and individual values are shown in b. All T-cell products contain CD8+ and CD4+ gene-edited T cells.
Extended Data Fig. 9 |
Extended Data Fig. 9 |. Neoantigen-specific T-cell isolation from PBMCs in patients without response to anti-PD-1 therapy.
a, Landscape analysis of the neoantigen-specific T cells over time in patient 8. Bottom panel shows mRNA expression and predicted HLA binding affinity of the predicted neoantigens screened. Neoantigens targeted by T cells are highlighted in different colours. The same colour code is used in the top panels to show the neoantigen specificity of the isolated T cells. The top panels show the evolution over time of the neoantigen-specific T cells in PBMCs. Each box represents one isolated T cell, each cross is equivalent to ten isolated T cells, and each circle is equivalent to 100 isolated T cells. Each colour represents a different neoantigen-specific T-cell clonotype. The number of isolated T cells is normalized to 100,000 CD8+ T cells using a round up method to plot the data. The mutated gene name, the point mutation, the sequence of the neoantigen, and the HLA are indicated on top of the figure. The T cell clonotypes shown have not been validated by expression in healthy donor T cells and binding to neoantigen–HLA complexes.
Extended Data Fig. 10 |
Extended Data Fig. 10 |. Activation, cytokine secretion, and proliferation induced by neoantigen-specific TCRs from patients without response to anti-PD-1 upon co-culture with the autologous cell lines.
Healthy donor T cells genetically engineered to express the captured neoTCRs from patient9 (a), 10 (b-d) and 11 (e-f) were co-cultured with the autologous (M488, M485 and M486 respectively) or a mismatched cell line (M202). a, 4-1BB upregulation in the CD8+ neoTCR+ T cells from patient 9 after co-culture. Melanoma cell lines were pre-treated with regular media or media with IFNγ 24 h prior co-culture with T cells (n = 3). b, 4-1BB, OX-40, and CD107a upregulation in CD8+ neoTCR+ T cells from patient 10 after co-culture. Melanoma cell lines were pre-treated with regular media or media with IFNγ 24 h prior co-culture with T cells (n = 3). c, Cytokine release at 24 h after co-culture (n = 3). d, Proliferation of CD8+ neoTCR+ T cells from patient 10 measured by Ki67 mean fluorescence intensity upon 24, 48 and 72 h co-culture with autologous melanoma cell line (M485, top panel) or a mismatched cell line (M202, bottom panel) (n = 3). e, 4-1BB and OX-40 upregulation in CD8+ neoTCR+ T cells from patient 11 after co-culture. Melanoma cell lines were pre-treated with regular media or media with IFNγ 24 h prior co-culture with T cells (n = 3). f, Cytokine release at 24 h after co-culture (n = 3). * p < 0.05, ** p < 0.005, ***p < 0.0005, ****p < 0.0001 vs Neo12, two-tailed unpaired t test with Holm-Sidak adjustment for multiple comparisons in figure a, b, c, e, and f. * p < 0.05, ** p < 0.005, ***p < 0.0005, ****p < 0.0001 vs M202, two-tailed unpaired t test with Holm-Sidak adjustment for multiple comparisons in figure d. Exact p-values provided in Supplementary Information. (n) indicates the number of biological replicates. Mean ± SD and individual values are shown. All T-cell products contain CD8+ and CD4+ gene-edited T cells.
Fig. 1 |
Fig. 1 |. Neoantigen-specific T cell screening and TCR clonotype identification.
a, Schematic of neoantigen-specific TCR isolation from patient samples. NeoAg, neoantigen. b, Representations of the number of non-synonymous mutations, mutations screened, predicted neoantigen–HLA complexes screened, mutations targeted by neoantigen-specific T cells and neoantigen-specific T cell clonotypes isolated in patients with (patients 1–7) or without (patients 8–11) a response to anti-PD-1 therapy. c, Ratio of the number of neoantigen-specific TCR clonotypes isolated per mutation targeted in each patient. Data are mean ± s.d. with individual values. n values indicate the number of different patients; n = 7 (responders) and n = 4 (non-responders). *P = 0.0434, calculated using a two-tailed unpaired t-test, using the two-stage linear step-up procedure of Benjamini, Krieger and Yekutieli, with Q = 1%.
Fig.2 |
Fig.2 |. Neoantigen-specific T cell isolation from TILs and PBMCs in patients with a response to anti-PD-1 therapy.
a, Tumour measurements over time and sample collection for patient 1. b, Magnetic resonance imaging (MRI) scans from patient 1 at the baseline (day −12, left) and on treatment (day 428, right). c, Landscape analysis of the neoantigen-specific T cells over time in patient 1. Bottom, mRNA expression, measured in absolute reads and predicted HLA-binding affinity of the putative neoantigens screened. Neoantigens targeted by T cells are highlighted in different colours, and the mutated gene name, the sequence of the neoantigen with the point mutation marked in red and the HLA are indicated at the top. The same colour code is used in the top panels to show the neoantigen specificity of the isolated T cells. The six top panels show the evolution over time of the neoantigen-specific T cells in TILs and PBMCs. Each box represents one isolated T cell, each cross is equivalent to ten isolated T cells and each circle is equivalent to 100 isolated T cells. Each colour represents a different neoantigen-specific T cell clonotype. The number of isolated T cells was normalized to 100,000 CD8+ T cells using a round-up method to plot the results. Only T cell clonotypes that demonstrated binding to neoantigen–HLA complexes once expressed in healthy donor T cells are shown, d, The same as in a, but for patient 2. e, Computed tomography (CT) scans from patient 2 at baseline (day −13, left) and on treatment (day 56, right). L, left; R, right. f, The same as in c, but for patient 2. g, The same as in a, but for patient 6. This patient had two target lesions; the average of the longest diameters is shown. h, CT scans from patient 6 at baseline (day −23, left) and on treatment (day 84, right). i, The same as in c, but for patient 6.
Fig. 3 |
Fig. 3 |. Antitumour activity of the neoantigen-specific TCRs isolated in patients with a response to anti-PD-1.
ag, Healthy donor T cells were genetically modified to replace the endogenous TCR by the isolated neoTCRs from patient 1 (ac), patient 2 (d,e) and patient 6 (f,g), and used to characterize the antitumour activity of these neoTCRs. The colour code for each TCR matches the colour of each T cell clonotype in Fig. 2. a–c, Specific target-cell killing by neoTCR gene-edited T cells from patient 1 against the autologous cell line (M495) and the mismatched control (M202) (P:T ratio 5:1; n = 4). The plots are divided between TCRs with strong killing (a), intermediate killing (b) or no killing (c). %nRFP, percentage of nRFP-positive area. d, 4-1BB upregulation in the CD8+neoTCR+ gene-edited T cells from patient 2 after co-culture with the autologous (M489) or mismatched (M202) cell lines (n = 3). e, Specific target-cell killing by neoTCR gene-edited T cells from patient 2 in the autologous cell line (M489) and the mismatched control (M202) (P:T ratio 1:1; n = 4). f, 4-1BB upregulation in CD8+ neoTCR+ gene-edited T cells from patient 6 after co-culture with the autologous (M490) or mismatched (M202) cell lines pretreated for 24 h with IFNγ (n = 3). g, Specific target-cell killing by neoTCR gene-edited T cells in the autologous cell line (M490) and the mismatched control (M202) target cells pretreated for 24 h with IFNγ (P:T ratio 10:1; n = 4). P values were calculated using two-tailed unpaired t-tests with Holm–Sidak adjustment for multiple comparisons versus Neo12; *P < 0.05, **P < 0.005, ***P < 0.0005, ****P < 0.0001. Exact P values are provided in the Supplementary Information. n values indicate the number of biological replicates. Data are mean with individual values (ac,e,g) and mean ± s.d. with individual values (d,f). All T cell products contain CD8+ and CD4+ gene-edited T cells.
Fig. 4 |
Fig. 4 |. Neoantigen-specific T cell isolation from TILs and PBMCs, and neoTCR antitumour activity in patients without a response to anti-PD-1.
ac. The landscape of the neoantigen-specific T cells for patients 9 (a), 10 (b) and 11 (c). Bottom, mRNA expression, measured in absolute reads, and predicted HLA-binding affinity of the putative neoantigens screened. Neoantigens targeted by T cells are highlighted in different colours. The predicted HLA-binding affinity for the neoantigen in patient 9 is highlighted with an arrow, as the expression is considered to be negative. The same colour code was used for the top panels to show the neoantigen specificity of the isolated T cells. Each little box represents one isolated T cell. Each colour represents a different neoantigen-specific T cell clonotype. The number of isolated T cells was normalized to 100,000 CD8+ T cells using a round-up method. Only T cell clonotypes with demonstrated binding to neoantigen–HLA complexes once expressed in healthy donor T cells are shown. df, 4-1BB upregulation in CD8+ neoTCR+ gene-edited T cells from patients 9 (d), 10 (e) and 11 (f), respectively, after co-culture with autologous (M488, M485 and M486, respectively) or mismatched (M202) cell lines (n = 3). gi, Specific target-cell killing by neoTCR gene-edited T cells from patients 9 (g), 10 (h) and 11 (i) in the autologous cell lines and the mismatched control (P:T ratio 5:1, n = 4 (patients 9 and 10); and P:T ratio 10:1, n = 3 (patient 11)). P values were calculated using two-tailed unpaired t-tests with Holm–Sidak adjustment for multiple comparisons versus Neo12 (e,f,h,i) and two-tailed unpaired t-tests versus Neo12 (d,g).*P < 0.05, **P < 0.005, ***P < 0.0005, ****P < 0.0001. Exact P values are provided in the Supplementary Information, n values indicate the number of biological replicates. Data are mean ± s.d. with individual values (df) and mean with individual values (gi). All T cell products contain CD8+ and CD4+ gene-edited T cells.

References

    1. Schumacher TN & Schreiber RD Neoantigens in cancer immunotherapy. Science 348, 69–74 (2015). - PubMed
    1. Tran E, Robbins PF & Rosenberg SA Final common pathway’ of human cancer immunotherapy: targeting random somatic mutations. Nat. Immunol 18, 255–262 (2017). - PMC - PubMed
    1. Gros A. et al. Prospective identification of neoantigen-specific lymphocytes in the peripheral blood of melanoma patients. Nat. Med 22, 433–438 (2016). - PMC - PubMed
    1. Gubin MM et al. Checkpoint blockade cancer immunotherapy targets tumour-specific mutant antigens. Nature 515, 577–581 (2014). - PMC - PubMed
    1. Linnemann C. et al. High-throughput epitope discovery reveals frequent recognition of neo-antigens by CD4+ T cells in human melanoma. Nat. Med 21, 81–85 (2015). - PubMed

Publication types

MeSH terms