. 2023 Mar;615(7953):668-677.
doi: 10.1038/s41586-023-05788-0. Epub 2023 Mar 8.

Microglia-mediated T cell infiltration drives neurodegeneration in tauopathy

Affiliations

Microglia-mediated T cell infiltration drives neurodegeneration in tauopathy

Xiaoying Chen et al. Nature. 2023 Mar.

Erratum in

Abstract

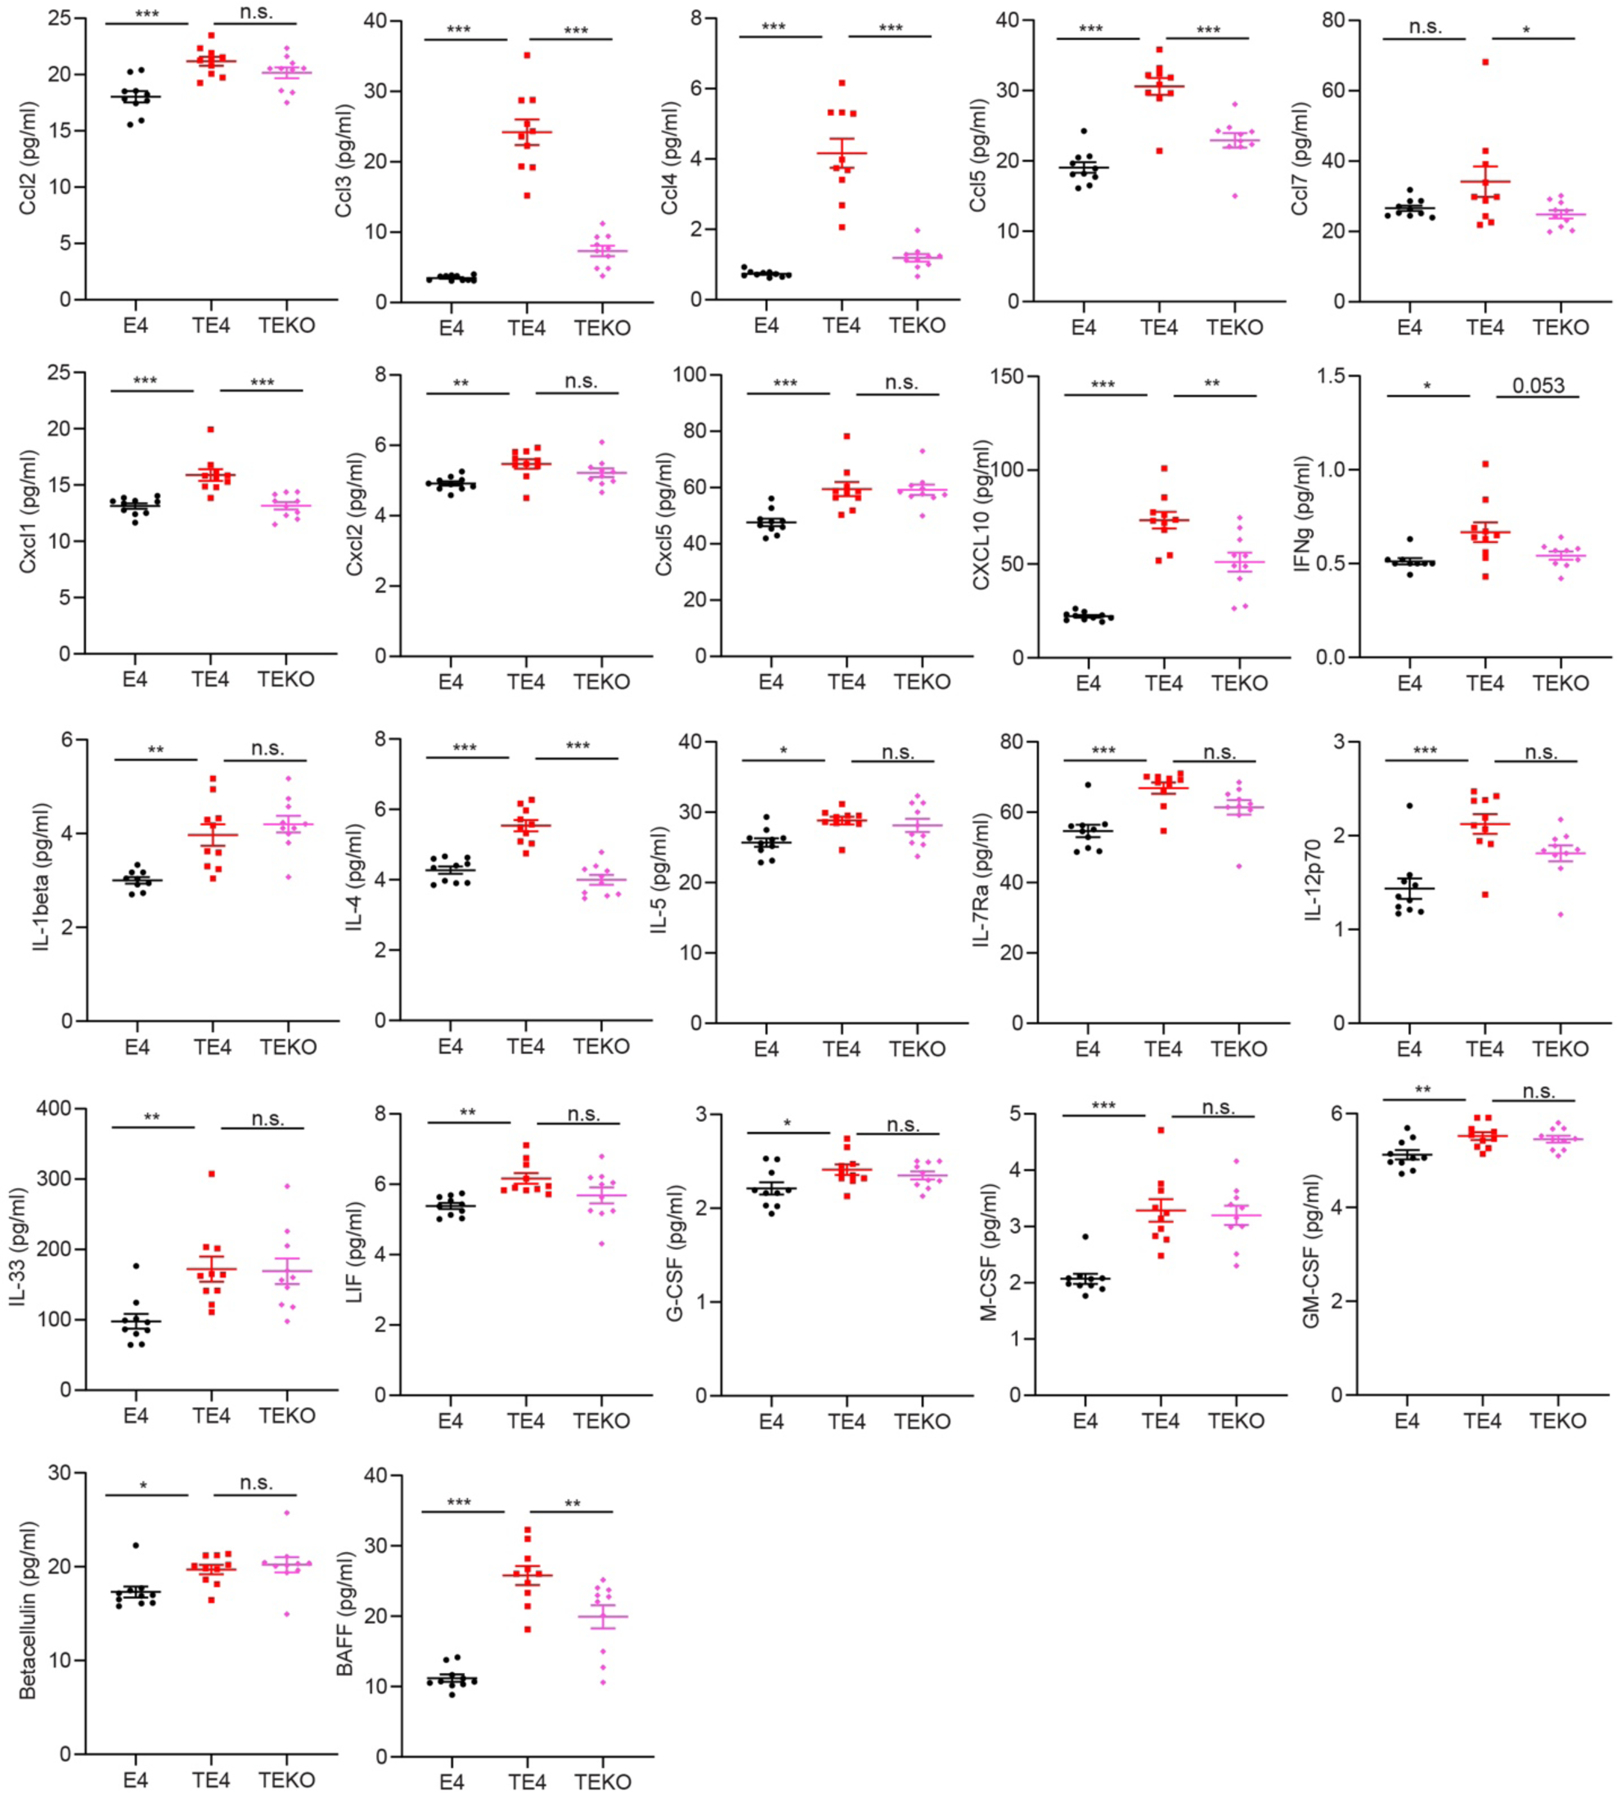
Extracellular deposition of amyloid-β as neuritic plaques and intracellular accumulation of hyperphosphorylated, aggregated tau as neurofibrillary tangles are two of the characteristic hallmarks of Alzheimer's disease1,2. The regional progression of brain atrophy in Alzheimer's disease highly correlates with tau accumulation but not amyloid deposition3-5, and the mechanisms of tau-mediated neurodegeneration remain elusive. Innate immune responses represent a common pathway for the initiation and progression of some neurodegenerative diseases. So far, little is known about the extent or role of the adaptive immune response and its interaction with the innate immune response in the presence of amyloid-β or tau pathology6. Here we systematically compared the immunological milieux in the brain of mice with amyloid deposition or tau aggregation and neurodegeneration. We found that mice with tauopathy but not those with amyloid deposition developed a unique innate and adaptive immune response and that depletion of microglia or T cells blocked tau-mediated neurodegeneration. Numbers of T cells, especially those of cytotoxic T cells, were markedly increased in areas with tau pathology in mice with tauopathy and in the Alzheimer's disease brain. T cell numbers correlated with the extent of neuronal loss, and the cells dynamically transformed their cellular characteristics from activated to exhausted states along with unique TCR clonal expansion. Inhibition of interferon-γ and PDCD1 signalling both significantly ameliorated brain atrophy. Our results thus reveal a tauopathy- and neurodegeneration-related immune hub involving activated microglia and T cell responses, which could serve as therapeutic targets for preventing neurodegeneration in Alzheimer's disease and primary tauopathies.


Conflict of interest statement

Conflicts of Interest

D.M.H. is as an inventor on a patent licensed by Washington University to C2N Diagnostics on the therapeutic use of anti-tau antibodies. D.M.H. co-founded and is on the scientific advisory board of C2N Diagnostics. D.M.H. is on the scientific advisory board of Denali and Cajal Neuroscience and consults for Genentech and Alector. J.K. is a member of a scientific advisory group for PureTech. All other authors declare no competing interests.

Figures

Extended Data Figure 1.
Extended Data Figure 1.. ApoE4 exacerbates tau-mediated neurodegeneration
(a) Representative image of 9.5-month A/PE4 mouse brain sections stained with an anti-Aβ antibody and X-34. Scale bar=500μm. (b) Representative images of 6 and 9.5-month TE4 mouse brain sections stained with AT8 antibody. Scale bar=500μm. (c) Quantification of brain regional volumes of 9.5-month mice normalized to 6-month in b. TE4–6 months: n=7, TE4–9.5months: n=13. ***p<0.0001 for hippocampus (Hip) vs. cortex dorsal to the hippocampus (Ctx); amygdala (Amyg) vs. Ctx and entorhinal/piriform cortex (Ent) vs. Ctx. One-way ANOVA with Tukey’s post hoc test. (d) Quantification of the area covered by AT8 of 9.5-month TE4 mouse brain sections in b. TE4–6 months: n=7, TE4–9.5months: n=13. ***p<0.0001 for Hip vs. Ctx; Amyg vs. Ctx and Ent vs. Ctx. One-way ANOVA with Tukey’s post hoc test. (e) Representative images of 6-month TE4, 9.5-month E4, and 9.5-month TE4 mouse brain sections stained with NeuN. Scale bar=50 μm. (f) Thickness of granule cell layer of the dentate gyrus (DG) in 9.5-month E3, TE3, E4, TE4 mice. (E3: n=5, TE3: n=6, E4: n=15 and TE4: n=13). *p=0.0130 for TE3 vs. TE4. Two-way ANOVA with Tukey’s post hoc test. (g) Correlation between DG neuronal layer thickness and hippocampal volume. n=39 biologically independent animals from f. Pearson correlation analysis. R=0.8335, p<0.0001. (h, i) Representative images of 9.5-month E4 and TE4 mouse brain sections stained with MBP. Scale bar=500μm in h. Scale bar=100μm in i. (j-l) Volumes of hippocampus, entorhinal/piriform cortex and posterior lateral ventricle in 9.5-month E3, TE3, E4, TE4 mice. (E3: n=5, TE3: n=6, E4: n=15 and TE4=13). p=0.0505 for TE3 vs. TE4 in comparing the volume of the hippocampus, *p=0.0207 for TE3 vs. TE4 in comparing the volume of the posterior lateral ventricle. Two-way ANOVA with Tukey’s post hoc test. (m-o) Volumes of hippocampus, entorhinal/ piriform cortex and posterior lateral ventricle in 9.5-month TE3, TE4, A/PE4, 5xE4 male and female mice. (TE3-M: n=6, TE3-F: n=11, TE4-M: n=13, TE4-F: n=17, A/PE4-M: n=7, A/PE4-F: n=6, 5xE4-M: n=6, 5xE4-F: n=7). **p=0.0087 for TE4 male vs. female entorhinal/piriform cortex volume. Two-way ANOVA with Tukey’s post hoc test. Data are mean ± s.e.m.
Extended Data Figure 2.
Extended Data Figure 2.. Immune cell composition in brain parenchyma and meninges
(a) FACS sorting of CD45Total and /or CD45high cells from brain parenchyma and meninges from A/PE4 mice for single cell immune RNA-seq. (b) Analysis of the CD4 and CD8 positive T cells present in the brain of E4 and TE4 mice by flow cytometry. (E4: n=8, TE4: n=14) Data are mean ± s.e.m., ***p<0.0001, Unpaired two-tailed Student’s t test. (c) Representative cell type specific makers in brain parenchyma (CD45Total) clusters. (d) CD45high immune cells from parenchyma assigned into 12 cell types as visualized by UMAP plot. (e) Representative cell type specific makers in meninges (CD45Total).
Extended Data Figure 3.
Extended Data Figure 3.. T cell infiltration in the brain parenchyma with significant tauopathy
(a) Representative flow cytometry gating plot of splenic lymphocytes. (b) Quantification of the proportion of indicated lymphocytes and their subsets among 9.5-month E4, A/PE4, and TE4 mice. (E4: n=4, A/PE4: n=4, TE4: n=8). p=0.648, 0.492, 0.992 for E4 vs. A/PE4; E4 vs. TE4; A/PE4 vs. TE4 in T cells; p=0.614, 0.518, 0.089 for E4 vs. A/PE4; E4 vs. TE4; A/PE4 vs. TE4 in CD4+ T cells; p=0.665, 0.719, 0.196 for E4 vs. A/PE4; E4 vs. TE4; A/PE4 vs. TE4 in CD8+ T cells. Two-way ANOVA with Tukey’s post hoc test. p=0.629, 0.472, 0.095 for E4 vs. A/PE4; E4 vs. TE4; A/PE4 vs. TE4 in Treg. One-way ANOVA with Tukey’s post hoc test. (c) Quantification of CD3+ T cell number per DG area with 0.3mm2 in 9.5 month E3, TE3, E4, TE4 mice. (E3: n=5, TE3: n=6, E4: n=15 and TE4: n=13). Two-way ANOVA with Tukey’s post hoc test. p=0.1342 for TE3 vs. TE4. (d) Representative images of 9.5-month old E4, TE4, A/PE4 and 5xE4 mouse brain sections stained with CD3, Iba1, Aβ and X-34. Scale bar=20μm. Images are representative of results from n=4 in E4, A/PE4 and TE4 respectively. (e) TEM image demonstrating presence of a cell with T cell like features in brain parenchyma of 9.5 month of TE4 mouse. Scale bar=2μm. Images are representative of results from n=3 in TE4 mice.
Extended Data Figure 4.
Extended Data Figure 4.. Characterization of T cell populations within the parenchyma and meninges of mice with amyloid or tau pathology
(a) Heatmap showing identified marker genes in each of the categorized cell types in Total T cells, CD4+ and CD8+ T cells. (b) Total T cells from brain parenchyma and meninges with TCR assigned into 13 cell types as visualized by UMAP plot. (c) TRAV and TRBV enrichment in CD8+ and CD4+ T cells in TE4 and A/PE4 mice. (d) Representative TCR-TRBV projection in E4, A/PE4 and TE4 mice.
Extended Data Figure 5.
Extended Data Figure 5.. Expression of cytokines, chemokines, growth factors and soluble receptors in brain lysates
Quantification of cytokines, chemokines, growth factors and soluble receptors in brain lysates in 9.5 month old E4, TE4, and TEKO mice. (E4: n=10, TE4: n=10 and TEKO: n=10). One-way ANOVA with Tukey’s post hoc test. With Q=0.1% identify outlier function, n=1 E4 and n=1 TEKO samples for IFN-γ measurements were removed; n=1 E4 sample for IL-1β measurements was removed. ***p=0.0001, ***p<0.0001, ***p<0.0001, ***p<0.0001, p=0.1261, ***p<0.0001, **p=0.0038, ***p=0.0005, ***p<0.0001, *p=0.0144, **p=0.0022, ***p<0.0001, *p=0.0126, ***p=0.0002, ***p=0.0001, **p=0.0074, **p=0.0059, *p=0.0434, ***p<0.0001, **p=0.007, *p=0.038, ***p<0.0001 for E4 vs.TE4 following the panel order. p=0.2757, ***p<0.0001, ***p<0.0001, ***p<0.0001, *p=0.489, ***p<0.0001, p=0.2539, p=0.9952, **p=0.0011, p=0.053, n=0.625, ***p<0.0001, n=0.7867, p=0.1013, p=0.087, p=0.9905, p=0.1107, p=0.7159, p=0.9193, p=0.8426, p=0.83, **p=0.0076 for TE4 vs. TEKO following the panel order. Data are mean ± s.e.m.; One-way ANOVA with Tukey’s post hoc test.
Extended Data Figure 6.
Extended Data Figure 6.. Changes in microglia and T cells with Tau-meditated neurodegeneration require ApoE
(a) MHCII, CD206, Iba1 and GFAP staining in 9.5-month TE4 mice. Scale bar=100μm. Images are representative of results from n=13 in TE4 mice. (b) Iba1, MHCII and Aβ staining in 9.5 month E4, A/PE4, TE4 and TEKO mice in Cortex dorsal to Hippocampus, Hippocampus and Ent/Piri cortex. Scale bar=50μm. (c) Quantification of the area covered by MHCII in Ctx, Hip and Ent in 9.5-month TE4 and TEKO mice. (TE4: n=13 and TEKO: n=15). ***p<0.0001 for TE4-Hip vs. TEKO-Hip. One-way ANOVA with Tukey’s post hoc test. (d) Iba1, CD11c and Aβ staining in 9.5-month E4, A/PE4, TE4 and TEKO mice in Prefrontal cortex, Hippocampus and Ent/Piri cortex. Scale bar=50μm. (e) Quantification of the area covered by CD11c in Ctx, Hip and Ent in 9.5-month TE4 and TEKO mice. (TE4: n=13 and TEKO: n=15). ***p<0.0001 for TE4-Hip vs. TEKO-Hip. One-way ANOVA with Tukey’s post hoc test. (f) Volume of hippocampus in 9.5-month TE4 and TEKO mice. (TE4: n=13 and TEKO: n=15). ***p<0.0001. Unpaired two-tailed Student’s t test. (g) Quantification of numbers of CD3+ T cells in DG per 0.3mm2. (TE4: n=13 and TEKO: n=15). ***p<0.0001. Data are mean ± s.e.m.; Unpaired two-tailed Student’s t test.
Extended Data Figure 7.
Extended Data Figure 7.. IFN-γ in the T cell population and microglia can directly present antigen to CD8+ T cells in vitro
(a) Ligand-receptor analysis in T cells and microglia. (b) IFN-γ expression in brain parenchyma (CD45Total) 12 cell types and T cells from brain parenchyma 15 clusters of T cells as visualized by UMAP plot. (c) The gating strategy for sorting naïve OT-1 CD8+ T cells, dendritic cells (DCs), and microglia. (d) Representative flow cytometry plot to assess the proliferation of OT-1 T cells by cell tracer violet (CTV) dilution after 3 days of co-culture with APCs in the presence of OVA. (e) Representative flow cytometry plot showing dose dependent OVA antigen presentation by DCs, microglia, or microglia in the presence of IFNγ assayed by OT-1 proliferation. (f) Percent of proliferating OT-1 T cells under the indicated conditions. Data are from one representative experiment. Two independent experiments were done showing similar results.
Extended Data Figure 8.
Extended Data Figure 8.. Blocking IFNγ signaling reduces tau-mediated neurodegeneration and tau pathology
(a) Representative images of 9.5-month TE3-IgG and TE3-αIFN-γ treated mouse brain sections stained with Sudan black. Scale bar=1mm. (b-d) Volumes of hippocampus, entorhinal/piriform cortex and posterior lateral ventricle in 9.5-month TE3-IgG and TE3-αIFNγ treated mice. (TE3-IgG: n=12 and TE3-αIFNγ: n=12). p=0.0479, 0.0398, 0.265 for TE3-IgG vs. TE3-αIFNγ in comparing the volumes of hippocampus, entorhinal/piriform cortex and posterior lateral ventricle, respectively. Unpaired two-tailed Student’s t test. (e) CD11c, CD8, Iba1 staining in 9.5-month TE3-IgG and TE3-αIFNγ treated mice. Scale bar=50μm. (f) Quantification of area covered by CD11c in 9.5-month TE3-IgG and TE3-αIFNγ mice. (TE3-IgG: n=12 and TE3-αIFNγ: n=12). *p=0.0344. Unpaired two-tailed Student’s t test. (g) Representative images of 9.5-month TE3-IgG and TE3-αIFNγ treated mouse brain sections stained with AT8 antibody. Scale bar=250μm. (h) p-Tau (AT8) covered area in 9.5-month TE3-IgG and TE3-αIFNγ treated mice. (TE3-IgG: n=12 and TE3-αIFNγ: n=12). *p=0.0122. Unpaired two-tailed Student’s t test. (i) Schematic representation of the timeline of PLX3397 treatment for microglia depletion. (j) Schematic representation of the timeline of anti-CD4 and anti-CD8 antibody treatment for T cell depletion.
Extended Data Figure 9.
Extended Data Figure 9.. T cell depletion in tauopathy mice
(a) Representative flow cytometry gating plot and quantification of CD4+, CD8+ T cells in brain parenchyma, meninges and blood in IgG control or α-CD4 and α-CD8 (αT) treated mice. (b) Bar plot showing the number of CD8+ T and CD4+ T cells in IgG and αT treated mice. (IgG: n=2 and αT: n=4). Data are mean ± s.e.m. (c) Microglia from brain parenchyma of TE4-IgG and TE4-αT treated mice assigned into 3 categories as visualized by UMAP plot. (d) Bar plot showing the percentage of the 3 categories of microglia in TE4-IgG and TE4-αT mice. (e) Heat map showing representative functional genes specifically expressed in active microglia clusters in TE4-IgG and TE4-αT mice. (f) Quantification of nest-building behavior at 9.5 months age. (TE4-IgG: n=15 and TE4-αT: n=21). *p=0.02 for IgG vs. αT. Fisher’s exact test. (g) Quantification of total rearing at baseline levels of general exploratory behavior in 1 h. (TE4-IgG: n=10 and TE4-αT: n=15). p=0.4363 for TE4-IgG vs. TE4-αT. Unpaired two-tailed Student’s t test. (h) Quantification of total ambulations at baseline levels of locomotor activity levels in 1 h. (TE4-IgG: n=10 and TE4-αT: n=15). p=0.0709. Two-tailed Mann-Whitney test. (i) Schematic representation of fear conditioning behavioral paradigms.
Extended Data Figure 10.
Extended Data Figure 10.. Blocking PD-1 immune checkpoint increases Foxp3+CD4+ Tregs and reduces tau-mediated neurodegeneration
(a) The gating strategy for sorting Foxp3+ CD4+ Treg, Pd1+ Foxp3+ CD4+ Treg, Klrg1+ effector CD8+ T cells, PD-1+ Tox1+ CD8+ exhausted T cells in the brain parenchyma. (b-e) Quantification of T cell populations in the brain parenchyma of mice acutely treated with IgG control and αPD-1 antibodies. (TE4-IgG: n=12 and TE4-αPD-1: n=13 for b, d, e; TE4-IgG: n=10 and TE4-αPD-1: n=11 for c). *p=0.041, **p=0.0075, p=0.52, p=0.945 for Foxp3+CD4+ Treg, Pd1+ Foxp3+ CD4+ Treg, Klrg1+ effector CD8+ T cells, PD-1+ Tox1+ CD8+ exhausted T cells. Unpaired two-tailed Student’s t test. (f) Representative images of 9.5-month TE4-IgG and TE4-αPD-1 treated mouse brain sections stained with Sudan black. Scale bar=1mm. (g-h) Volumes of hippocampus, entorhinal/piriform cortex in 9.5-month TE4-IgG and TE4-αPD-1 treated mice. (TE4-IgG: n=14 and TE4-αPD-1: n=14). *p=0.018 and 0.015 for TE4-IgG vs. TE4-αPD-1 in comparing the volumes of hippocampus, entorhinal/piriform cortex, respectively. Unpaired two-tailed Student’s t test. (i) Quantification of the area covered by AT8 in DG per slice in 9.5-month TE4-IgG vs. TE4-αPD-1 mice (TE4-IgG: n=14 and TE4-αPD: n=14). **p=0.0009. Unpaired two-tailed Student’s t test.
Figure 1.
Figure 1.. Single cell immune RNA sequencing reveals increased proportion of T cells in the context of tau-mediated neurodegeneration
(a) Representative images of 6-month E4 and TE4; 9.5-month E4, TE4, A/PE4 and 5xE4 mouse brain sections stained with Sudan black. Scale bar=1mm. (b-d) Volumes of hippocampus, entorhinal/piriform cortex and posterior lateral ventricle in 6-month E4 and TE4; 9.5-month E4, TE4, A/PE4, 5xE4 and WT mice. (E4–6m: n=3, TE4–6m: n=7, E4–9.5m: n=15, TE4–9.5m n=13, A/PE4–9.5m: n=7, 5xE4–9.5m: n=6 and WT-9.5m: n=6). Data are mean ± s.e.m.; ***p<0.0001 for 9.5m, TE4 vs. A/PE4; TE4 vs. 5xE4; TE4 vs. E4 and TE4 vs. WT. Ent: Entorhinal. Piri: Piriform. One-way ANOVA with Tukey’s post hoc test. (e) FACS sorting of CD45Total and/or CD45high cells from brain parenchyma and meninges from E4, A/PE4 and TE4 mice for single cell immune RNA-seq. (f) CD45Total immune cells from brain parenchyma assigned into 12 cell types as visualized by UMAP plot. (g) Bar plot showing the proportions of the 12 cell types of immune cells in the brain parenchyma. Data are mean ± s.e.m.; 2 biologically independent samples were utilized and samples were sequenced in n=2 batches from the E4 and TE4 groups. (h) CD45Total immune cells from meninges assigned into 12 cell types as visualized by UMAP plot. (i) Bar plot showing the proportions of the 12 cell types of immune cells in the meninges. Data are mean ± s.e.m.; 2 biologically independent samples were utilized and samples were sequenced in n=2 batches from the E4 and TE4 groups.
Figure 2.
Figure 2.. T cells are strongly elevated in the brain parenchyma of humans and mice with tauopathy and neuronal loss
(a) Iba1 and CD3 staining in 6-month E4 and TE4, 9.5-month E4, TE4, A/PE4 and 5xE4 mice in dentate gyrus (DG). Scale bar=20μm. (b) Quantification of numbers of CD3+ T cells in DG per 0.3mm2. (E4–6m: n=3, TE4–6m: n=7, E4–9.5m: n=15, TE4–9.5m: n=13, A/PE4–9.5m: n=7 and 5xE4–9.5m: n=6). ***p<0.0001 for 9.5m, TE4 vs. A/PE4; TE4 vs. 5xE4 and TE4 vs. E4. One-way ANOVA with Tukey’s post hoc test. (c) Vessel and CD3 staining in 9.5-month TE4, 19-month A/PE4 and 5xE4 mice, Scale bar=20μm. (d) Quantification of the % area covered by Iba1 in DG. (E4–6m: n=3, TE4–6m: n=7, E4–9.5m: n=15, TE4–9.5m n=13, E3–9.5m: n=5 and TE3–9.5m: n=6). ***p<0.0001 for TE4–9.5m vs. E4–9.5m; and *p=0.0276 for TE3–9.5m vs. E3–9.5m. One-way ANOVA with Tukey’s post hoc test. (e) Correlation between the area covered by Iba1 and number of CD3+ T cells. n=49 biologically independent animals from d. Pearson correlation analysis (two-sided). R2=0.902, p<0.0001. (f) Correlation between the number of CD3+ T cells with the granule cell layer thickness in DG. n=49 biologically independent animals from d. Pearson correlation analysis (two-sided). R2=0.7454. p<0.0001. (g) CD3, Aβ and AT8 staining in brain sections from AD patients (superior frontal gyrus) of low Braak stage I or II and high Braak stage VI. Scale bar=10μm. (h) Quantification of the area covered by AT8 in g. (Braak I or II: n=3; Braak VI: n=7). n refers to staining quantification from brain of individual humans. *p=0.0195. Unpaired two-tailed Student’s t test. (i) Quantification of numbers of CD3+ T cells per mm2 in h. *p=0.0277. Unpaired two-tailed Student’s t test. (j). Quantification of the area covered by Aβ in h. (Braak I or II: n=3; Braak VI: n=7). n refers to staining quantification from brain of individual humans. p=0.1522. Data are mean ± s.e.m.; Unpaired two-tailed Student’s t test.
Figure 3.
Figure 3.. T cells dynamically shift from activated to exhausted states with unique TCR clonal expansion in tauopathy
(a) Total T cells from brain parenchyma and meninges assigned into 15 categories as visualized by UMAP plot. (b) Bar plot showing the percentages of T cells subgroups in E4, A/PE4 and TE4 mice. Data are mean ± s.e.m.; 2 biologically independent samples were utilized and samples were sequenced in n=2 batches from the E4 and TE4 groups. (c) Scatter plot illustrating differential TRAV and TRBV pairing expression in CD4+ T cells in TE4 vs. E4 (x axis) and A/PE4 vs. E4 (y axis) mice. (d) CD4+ T cells from brain parenchyma assigned into 6 cell types as visualized by UMAP plot. (e) Representative TRAV-TRBV paring projection in CD4+ T cells in E4, A/PE4 and TE4 mice. (f) Scatter plot illustrating differential TRAV and TRBV pairing expression in CD8+ T cells in TE4 vs. E4 (x axis) and A/PE4 vs. E4 (y axis) mice. (g) CD8+ T cells from brain parenchyma assigned into 10 cell types as visualized by UMAP plot. (h) Percentages of activated (cell types 3 and 6) and exhausted (cell type 1) CD8+ T cells in E4, A/PE4 and TE4 mice. Data are mean ± s.e.m.; 2 biologically independent samples were utilized and samples were sequenced in n=2 batches from the E4 and TE4 groups. (i) Trajectory analysis showing naive CD8+ T cells demarcated into three paths, cell type 6, Itgax+ Klre1+; cell type 3, ISg15+ and cell type 1, Tox+ Pdcd1+. (j) Representative TRAV-TRBV pairing projection in CD8+ T cells in E4, A/PE4 and TE4 mice.
Figure 4.
Figure 4.. Microglia depletion prevents T cell infiltration in tauopathy
(a) Total microglia assigned into 3 subgroups, HOM, DAM and IFN activated microglia, as visualized by UMAP plot. (b) Heat map showing representative markers specifically expressed in 3 subgroups. (c) Bar plot showing the percentages of the 3 subgroups of microglia in E4, A/PE4 and TE4 mice. Data are mean ± s.e.m.; 2 biologically independent samples were utilized and samples were sequenced in n=2 batches from the E4 and TE4 groups. (d) DEGs in microglia subgroups. FC, fold change. (e) Iba1 and CD3 staining in 9.5-month TE4 mice. Scale bar=20μm. (f) P2ry12, MHCII and Iba1 staining in 9.5-month TE4 mice. Scale bar=50μm. (g) CD11c, CD8 and Iba1 staining in 9.5-month TE4 mice. Scale bar=50μm. (h-k) Quantification of the covered areas of Iba1, P2ry12, MHCII and CD11c in 9.5-month mice. (TE4-Ctrl: n=5 and TE4-Plx: n=11). ***p<0.0001, ***p<0.0001, **p=0.0031, ***p<0.0001 for TE4-Plx vs. TE4-Ctrl for Iba1, P2ry12, MHCII and CD11c, respectively. Unpaired two-tailed Student’s t test. (l) Representative images of 9.5-month mouse brain sections stained with Sudan black. Scale bar=1mm. (m-o) Volumes of hippocampus, entorhinal/piriform cortex and posterior lateral ventricle in 9.5-month mice. (E4-Plx: n=12; TE4-Ctl: n=5 and TE4-Plx: n=11). **p=0.0078 **p=0.0012, for TE4-Ctrl vs. TE4-Plx for volumes of hippocampus and posterior lateral ventricle, respectively. One-way ANOVA with Tukey’s post hoc test. (p) Quantification of the number of CD3+ T cells in DG per 0.3mm2 in 9.5-month mice. (E4-Plx: n=12; TE4-Ctl: n=5 and TE4-Plx: n=11). *p=0.0236 for TE4-Ctrl vs. TE4-Plx. Unpaired two-tailed Student’s t test. (q) Quantification of the number of CD8+ T cells in DG per 0.3mm2 in 9.5-month mice. (TE4-Ctrl: n=5 and TE4-Plx: n=11). **p=0.002 for TE4-Ctrl vs. TE4-Plx. (r) Quantification of the area covered by AT8 in DG per slice in 9.5-month mice. (TE4-Ctrl: n=5 and TE4-Plx: n=11). ***p=0.0008 for TE4-Ctrl vs. TE4-Plx. Unpaired two-tailed Student’s t test. Data in h-k, m-r are mean ± s.e.m.
Figure 5.
Figure 5.. Depletion of T cells ameliorates inflammation, tauopathy, brain atrophy, and improves behavior
(a) Representative images of 9.5-month brain sections. Scale bar=1mm. (b-d) Volumes of brain regions in 9.5-month mice. (E4-IgG: n=11; E4-αT: n=10; TE4-IgG: n=8 and TE4-αT: n=12). *p=0.0112, *p=0.0397, *p=0.0313 for TE4-IgG vs. TE4-αT for hippocampus, entorhinal/piriform cortex and posterior lateral ventricle, respectively. Unpaired two-tailed Student’s t test. (e) Iba1 and CD3 staining in 9.5-month mice. Scale bar=20μm. (f) P2ry12, MHCII and Iba1 staining in 9.5-month mice. Scale bar=50μm. (g) CD11c, CD8, Iba1 staining in 9.5-month mice. Scale bar=50μm. (h) Quantification of CD3+ T cells in DG per 0.3mm2 in 9.5-month mice. (E4-IgG: n=11; E4-αT: n=11; TE4-IgG: n=11 and TE4-αT: n=11). ***p=0.0004. Unpaired two-tailed Student’s t test. (i) CD8+ T cells per 0.3mm2 of DG in 9.5-month mice. (TE4-IgG: n=11 and TE4-αT: n=11). ***p=0.0002. Unpaired two-tailed Student’s t test. (j-n) Quantification of the immunostained areas in 9.5-month mice. (TE4-IgG: n=11 and TE4-αT: n=11, for j-m and TE4-IgG: n=8, TE4-αT: n=12 for n). ***p=0.0002, *p=0.0229, ***p=0.0004, ***p=0.0002, ***p=0.0002 for area of Iba1, P2ry12, MHCII, CD11c and AT8, respectively. Unpaired two-tailed Student’s t test. (o) Distinct p-Tau staining patterns. **p=0.007 for distribution between TE4-IgG and TE4-αT. Fisher’s exact test. (p) Percentage of p-Tau staining patterns in 9.5-months mice. (q) Plasma NfL concentration in 9.5-month mice. (E4-IgG: n=11; E4-αT: n=11; TE4-IgG: n=11 and TE4-αT: n=11). *p=0.0398. Unpaired two-tailed Student’s t test. (r) Y maze behavior in 8.5-month mice. (TE4-IgG: n=10 and TE4-αT: n=15). *p=0.0239. Unpaired two-tailed Student’s t test. (s) Tone/shock pairing, day 1. (TE4-IgG: n=10 and TE4-αT: n=15). p=0.2152. Two-way ANOVA, with Bonferroni post hoc comparisons test. (t) Freezing in response to contextual cue, day 2. (TE4-IgG: n=10 and TE4-αT: n=15). p=0.067. Two-way ANOVA, with Bonferroni post hoc comparisons test. (u) Freezing in response to auditory cue, day 3. (TE4-IgG: n=10 and TE4-αT: n=15). **p=0.0118. Two-way ANOVA, with Bonferroni post hoc comparisons test. Data in b-h, i-n, q-u are mean ± s.e.m.

Comment in

References

    1. Duyckaerts C, Delatour B & Potier MC Classification and basic pathology of Alzheimer disease. Acta Neuropathol 118, 5–36, doi: 10.1007/s00401-009-0532-1 (2009). - DOI - PubMed
    1. Masters CL et al. Alzheimer’s disease. Nat Rev Dis Primers 1, 15056, doi: 10.1038/nrdp.2015.56 (2015). - DOI - PubMed
    1. Jack CR Jr. & Holtzman DM Biomarker modeling of Alzheimer’s disease. Neuron 80, 1347–1358, doi: 10.1016/j.neuron.2013.12.003 (2013). - DOI - PMC - PubMed
    1. Musiek ES & Holtzman DM Three dimensions of the amyloid hypothesis: time, space and ‘wingmen’. Nat Neurosci 18, 800–806, doi: 10.1038/nn.4018 (2015). - DOI - PMC - PubMed
    1. Giannakopoulos P et al. Tangle and neuron numbers, but not amyloid load, predict cognitive status in Alzheimer’s disease. Neurology 60, 1495–1500, doi: 10.1212/01.wnl.0000063311.58879.01 (2003). - DOI - PubMed

Publication types

MeSH terms