. 2023 Mar;615(7953):660-667.
doi: 10.1038/s41586-023-05796-0. Epub 2023 Mar 8.

An airway-to-brain sensory pathway mediates influenza-induced sickness

Affiliations

An airway-to-brain sensory pathway mediates influenza-induced sickness

Na-Ryum Bin et al. Nature. 2023 Mar.

Abstract

Pathogen infection causes a stereotyped state of sickness that involves neuronally orchestrated behavioural and physiological changes1,2. On infection, immune cells release a 'storm' of cytokines and other mediators, many of which are detected by neurons3,4; yet, the responding neural circuits and neuro-immune interaction mechanisms that evoke sickness behaviour during naturalistic infections remain unclear. Over-the-counter medications such as aspirin and ibuprofen are widely used to alleviate sickness and act by blocking prostaglandin E2 (PGE2) synthesis5. A leading model is that PGE2 crosses the blood-brain barrier and directly engages hypothalamic neurons2. Here, using genetic tools that broadly cover a peripheral sensory neuron atlas, we instead identified a small population of PGE2-detecting glossopharyngeal sensory neurons (petrosal GABRA1 neurons) that are essential for influenza-induced sickness behaviour in mice. Ablating petrosal GABRA1 neurons or targeted knockout of PGE2 receptor 3 (EP3) in these neurons eliminates influenza-induced decreases in food intake, water intake and mobility during early-stage infection and improves survival. Genetically guided anatomical mapping revealed that petrosal GABRA1 neurons project to mucosal regions of the nasopharynx with increased expression of cyclooxygenase-2 after infection, and also display a specific axonal targeting pattern in the brainstem. Together, these findings reveal a primary airway-to-brain sensory pathway that detects locally produced prostaglandins and mediates systemic sickness responses to respiratory virus infection.


Conflict of interest statement

S.D.L. is a consultant for Kallyope, Inc. The other authors declare no competing interests.

Figures

Fig. 1
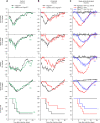
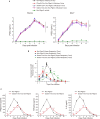
Fig. 1. Influenza infection induces multiple sickness symptoms through the EP3 receptor.
a, Mice were infected intranasally with 25 μl of influenza A virus at low (105 EID50 ml−1), medium (106 EID50 ml−1) or high (107 EID50 ml−1) dose and food intake, water intake, motility and body weight were subsequently monitored daily. EID50 is the 50% egg infective dose. Data are mean ± s.e.m.; n = 6 mice per group. One-way ANOVA with Dunnett’s multiple comparison test compared with vehicle control. Food intake: P = 0.0048 (low), P < 0.0001 (medium), P < 0.0001 (high). Water intake: P = 0.8185 (low), P < 0.0001 (medium), P < 0.0001 (high). Motility: P = 0.5231 (low), P < 0.0001 (medium), P < 0.0001 (high). Body weight: P = 0.0002 (low), P < 0.0001 (medium), P < 0.0001 (high). Survival: P = 0.3173 (low), P = 0.0185 (medium), P = 0.0007 (high). b, Mice were infected with influenza A virus (all infections are with 106 EID50 ml−1 unless otherwise indicated), given drinking water with or without 1 mg ml−1 ibuprofen, and monitored as indicated. Data are mean ± s.e.m.; n = 6 mice per group. Food intake: P< 0.0001; water intake: P = 0.0001; motility: P = 0.0001; body weight: P < 0.0001; survival: P = 0.0295. c, Mice were infected with influenza A virus, injected daily (intraperitoneal injection, 1 mg kg−1) with antagonists for EP1 (SC-51322), EP2 (PF-04418948), EP3 (DG-041) or EP4 (ONO-AE3-208), or vehicle alone, and monitored as indicated. Data are mean ± s.e.m.; n = 10 mice for vehicle groups; n = 8 mice for all others. For EP3 antagonist—food intake: P < 0.0001; water intake: P < 0.0001; motility: P < 0.0001; body weight: P = 0.0002; survival: P = 0.0094. b,c, Two-tailed unpaired t-test, with comparisons between groups treated with ibuprofen or EP3 antagonist and vehicle in c. Log-rank (Mantel–Cox) test for survival analyses; for behavioural or physiological changes, a mean daily change in behaviour (days 1–10 after infection or survival) was obtained for each mouse, and then used for comparisons across experimental groups (for more information see Extended Data Fig. 1a). *P < 0.05, **P < 0.005, ***P<0.0005; NS, not significant. Source data
Fig. 2
Fig. 2. Peripheral EP3 receptor is required for influenza-induced sickness.
a,b, Nestin-cre; Ptger3flox (a), Advillin-creER; Ptger3flox mice (b) or Ptger3flox (a,b) mice were infected with influenza A virus and monitored as indicated. Data are mean ± s.e.m.; n = 8 mice (Ptger3flox), n = 6 mice (Nestin-cre and Advillin-creER). Two-tailed unpaired t-test as detailed in Fig. 1 for behaviour or physiology analyses; log-rank (Mantel–Cox) test for survival analysis. a, Food intake: P = 0.0126; water intake: P = 0.1006; motility: P = 0.0701; body weight: P = 0.9361; survival: P = 0.7735. b, Food intake: P = 0.0004; water intake: P = 0.0004; motility: P < 0.0001; body weight: P = 0.0004; survival: P = 0.0216. c, The NJP ganglia of Ptger3flox mice were injected bilaterally with AAV-cre, exposed to influenza A virus or saline and monitored as indicated. Data are mean ± s.e.m.; n = 8 mice per group. Ptger3flox, virus—food intake: P < 0.0001; water intake: P < 0.0001; motility: P < 0.0001; body weight: P < 0.0001; survival: P < 0.0001. Ptger3flox; AAV-cre, virus—Food intake: P < 0.0001; water intake: P < 0.0001; motility: P < 0.0001; body weight: P < 0.0001; survival: P = 0.0376. One-way ANOVA with Dunnett’s multiple comparison test as detailed in Fig. 1 for behaviour or physiology analyses; log-rank (Mantel–Cox) test for survival analysis, with comparisons made between Ptger3flox, virus and Ptger3flox; AAV-cre, vehicle (red stars) or between Ptger3flox, virus and Ptger3flox; AAV-cre, virus (blue stars). Source data
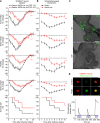
Fig. 3
Fig. 3. Rare transcriptome-defined sensory neurons mediate influenza responses.
a, A uniform manifold approximation and projection (UMAP) plot derived from published single-cell transcriptome data of vagal and glossopharyngeal sensory ganglia showing expression of indicated genes (colour shows relative expression on a natural log scale). b, Cell types, as highlighted in a, express the indicated gene as well as Ptger3. Mice were infected with influenza A virus and monitored as indicated. Data are mean ± s.e.m.; n = 8 (Piezo2-IRES-cre), n = 6–8 (Phox2b-cre; 8 control and 6 Phox2b-cre), n = 6 (Pdyn-IRES-cre), n = 6 (Oxtr-IRES-cre) and n = 10 (Gabra1-IRES-cre) mice per group. Two-tailed unpaired t-test as detailed in Fig. 1 for behaviour or physiology analyses; log-rank (Mantel–Cox) test for survival analysis. Piezo2-IRES-cre—food intake: P = 0.2631; motility: P = 0.2680; body weight: P = 0.7925; survival: P = 0.4736. Phox2b-cre—food intake: P < 0.0001; motility: P < 0.0001; body weight: P = 0.0002; survival: P = 0.0181. Pdyn-IRES-cre—food intake: P = 0.4539; motility: P = 0.4946; body weight: P = 0.2675; survival: P = 0.7937; Oxtr-IRES-cre—food intake: P = 0.4786; motility: P = 0.6333; body weight: P = 0.3297; survival: P = 0.7121; Gabra1-IRES-cre—food intake: P = 0.0001; motility: P < 0.0001; body weight: P = 0.0004; survival: P = 0.0263. Source data
Fig. 4
Fig. 4. PGE2 acts via glossopharyngeal sensory neurons.
a, Gabra1-IRES-cre; lsl-DTR mice were injected bilaterally in NJP ganglia with or without diphtheria toxin (DT) and then infected with influenza A virus and monitored as indicated. Data are mean ± s.e.m.; n = 8 mice per group. Food intake: P < 0.0001; water intake: P < 0.0001; motility: P < 0.0001; body weight: P = 0.0004; survival: P = 0.049. b, Wild-type mice with bilateral glossopharyngeal nerve transection surgery or sham surgery were infected with influenza A virus and monitored as indicated. Data are mean ± s.e.m.; n = 8 mice per group. Food intake: P < 0.0001; water intake: P < 0.0001; motility: P < 0.0001; body weight: P < 0.0001; P = 0.036. Two-tailed unpaired t-test as detailed in Fig. 1 for behaviour or physiology analysis; log-rank (Mantel–Cox) test for survival analysis. c, Immunostaining for DTR in whole-mount preparations of NJP ganglia four weeks after injection. Scale bars, 200 μm. d, Calcium transients evoked by PGE2 (1 μM) or KCl (150 mM) were imaged using Calbryte 520 AM in tdTomato-positive neurons acutely collected from NJP ganglia of Gabra1-IRES-cre; lsl-tdTomato mice. Scale bar, 10 μm. Images are representative of three technical replicates. AU, arbitrary units. Source data
Fig. 5
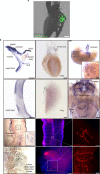
Fig. 5. GABRA1 neurons provide an airway–brain communication route.
a, NJP ganglia of Gabra1-IRES-cre mice were injected bilaterally with Cre-independent AAV-GFP and Cre-dependent AAV-flex-tdTomato, and fluorescent axons were visualized (green: all NJP sensory axons; red: GABRA1 NJP axons) by immunohistochemistry for tdTomato and GFP in fixed coronal cryosections of mouse brainstem. Scale bar, 200 μm. b, NJP ganglia of Gabra1-IRES-cre mice were injected bilaterally with AAV-flex-tdTomato, and axons were visualized by immunostaining for tdTomato in fixed coronal cryosections of nasopharynx. Scale bars, 100 μm (top), 50 μm (bottom). c, Top, immunohistochemistry of COX2 in fixed cryosections of nasopharynx in uninfected mice (control) or mice infected for five days with influenza A virus. Scale bars, 100 μm. Bottom, quantification of COX2 immunofluorescence in the nasopharynx of indicated mice. Data are mean ± s.e.m.; n = 29 sections from 5 mice per group over 3 independent experiments. Two-tailed unpaired t-test, P < 0.0001. Left panel in part a adapted with permission from ref. , Elsevier. Top panel in part b created with BioRender.com. Source data
Extended Data Fig. 1
Extended Data Fig. 1. Influenza A infection induces behavioral changes and PGE2 production.
a, Statistical analysis for behavioral experiments involved averaging daily changes in parameters indicated per mouse (days 1-10 after infection or through survival), as represented here in bar graphs. Statistical values are identical to those in Fig. 1a. b, PGE2 levels in plasma (left, middle) and BALF (right) were measured by ELISA at time points indicated after exposure to influenza A virus (red, blue) or vehicle control (black). Some virus-infected mice (blue) were additionally given ad libitum access to ibuprofen (1 mg/ml) in drinking water from 3 days prior to infection (left) or received daily aspirin administration (IP, 20 mg/kg), mean ± sem, n: 3 mice per group, ***p < 0.0005 by two-way ANOVA followed by Bonferroni’s multiple comparison test with comparisons made between red and black curves (red stars) or red and blue curves (blue stars). p values in b are <0.0001 for all indicated stars. Source data
Extended Data Fig. 2
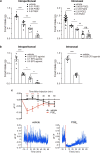
Extended Data Fig. 2. PGE2 decreases feeding and AGRP neuron activity.
a, Food intake by fasted mice administered with PGE2 (left: IP, right: intranasal) at doses indicated (mg/kg), and given ad libitum access to food (1 h), mean ± sem, n: 9 (left) mice per group, 28 (vehicle), 10 (0.0625, 0.125, 0.25), 20 (0.5) in (right), ***p < 0.0005, **p < 0.005, *p < 0.05, ns: not significant by two-way ANOVA Tukey’s multiple comparison test. b, Food intake by fasted mice administered with the EP3 receptor agonist sulprostone (left: IP, right: intranasal) at doses indicated (mg/kg), and given ad libitum access to food (1 h), mean ± sem, n: 8 mice per group, ***p < 0.0005, *p < 0.05 by two-way ANOVA Tukey’s multiple comparison test (left) or two-tailed unpaired t-test (right). c, GCaMP6s fluorescence (ΔF/F) was measured in AGRP neurons of the arcuate nucleus by fiber photometry before and after IP injection of PGE2 (0.5 mg/kg in PBS) or vehicle alone (PBS). (top) Responses are depicted as the mean of measurements made in 10-minute time intervals (for example, 10 refers to the mean of measurements made between 0 and 10 min), mean ± sem, n: 12 mice per group, **p < 0.01, ***p < 0.001 by two-way ANOVA with Bonferroni’s multiple comparison test, (bottom) representative recording traces with red bar indicating time of injection. p values left to right in a: IP: <0.0001, 0.0005, <0.0001, intranasal: <0.0001, 0.0455, 0.0008, 0.6630; b, IP: <0.0001, 0.0312, 0.0187, intranasal: <0.0001; c: <0.0001, <0.0001, 0.0045. Source data
Extended Data Fig. 3
Extended Data Fig. 3. Influenza-induced hypothermia and sickness behaviors are attenuated by cell-specific Ptger3 knockout and aspirin.
a, Core body temperature in flox-Ptger3 and Gabra1-ires-Cre; flox-Ptger3 mice was measured daily after administration of influenza virus (red, blue) or saline (black) using a rectal probe (left) or radiotelemetry (right), mean ± sem, n: 6 (left) and 3 (right) mice per group, ***p < 0.0005 by one-way ANOVA Dunnett’s multiple comparison test (left); ***p < 0.0005 by two-tailed unpaired t-test for right as detailed in Fig. 1 for behavior/physiology analysis (right), comparisons between red and black curves (red stars) or between red and blue curves (blue stars). For data on the right, two of three control flox-Ptger3 mice died on day 5, so subsequent data is represented as a dashed line and statistical analysis was performed only on data from days 1-4. b, Mice were given daily injections of aspirin (IP, 20 mg/kg), red or vehicle alone (black) throughout the paradigm. After three days, mice were infected with influenza A virus and subsequently monitored as indicated, mean ± sem, n: 6 mice per group, ***p < 0.0005 by two-tailed unpaired t-test as detailed in Fig. 1 for behavior/physiology analysis, *p < 0.05 by a log-rank (Mantel-Cox) test for survival analysis. p values in a, left: red <0.0001, blue 0.0003, right: <0.0001; b, left to right: <0.0001, <0.0001, <0.0001, <0.0001, 0.0243. Source data
Extended Data Fig. 4
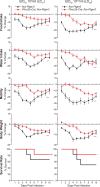
Extended Data Fig. 4. Validating approaches for cell-specific Ptger3 knockout.
a, qPCR analysis of Ptger3 expression in hypothalamus (left) or NJP ganglia (right) of flox-Ptger3 (white), Nestin-Cre; flox-Ptger3 (red), and Phox2b-Cre; flox-Ptger3 (blue) mice. Phox2b-Cre mice display Cre expression in nodose and petrosal but not jugular neurons. Ptger3 transcript levels were expressed after normalization to Gapdh expression levels, mean ± sem, n: 6 mice for flox-Ptger3 and 3 for other groups, ***p < 0.0005, ns: not significant by one-way ANOVA Dunnett’s multiple comparison test. b, flox-Ptger3 control mice were treated with (right) or without (left) tamoxifen for 5 consecutive days (IP, 70 mg/kg) as was done for Advillin-CreER; flox-Ptger3 mice. At least one week later, mice were either exposed to influenza A virus (red) or saline (black) and monitored as indicated, mean ± sem, n: 6 mice per group, ***p < 0.0005 by two-tailed unpaired t-test as detailed in Fig. 1 for behavior/physiology analysis, *p < 0.05 by a log-rank (Mantel-Cox) test for survival analysis. p values in a, left: <0.0001, 0.7506, right: 0.8680, <0.0001; b top to bottom, left: <0.0001, <0.0001, <0.0001, <0.0001, 0.0179, right: <0.0001, 0.0003, <0.0001, 0.0179. Source data
Extended Data Fig. 5
Extended Data Fig. 5. Ptger3 knockout in peripheral sensory neurons attenuates behavioral responses to sublethal influenza A doses.
a, Wild type mice were infected with influenza A virus at titers indicated and subsequent survival monitored daily, n: 10 per group. b, a dose-response curve of viral titer (log10) vs. survival rates with non-linear fit of R2 = 0.926. c, A table indicating survival rates to various influenza A virus inoculation doses, with the estimated % lethality determined by Probit regression analysis (Statistical Product and Service Solutions). d, Advillin-CreER; flox-Ptger3 mice (red, previously injected with tamoxifen) or flox-Ptger3 mice (black) indicated were infected with sublethal doses of influenza A virus (top: 105 EID50 or LD21, bottom: 105.5 EID50 or LD39) and monitored daily as indicated, mean ± sem, n: 6 mice per group, ***p < 0.0005 by two-tailed unpaired t-test as detailed in Fig. 1 for behavior/physiology analysis, *p < 0.05, ns: not significant by a log-rank (Mantel-Cox) test for survival analysis. p values left to right in d, top: <0.0001, <0.0001, 0.0002, <0.0001, 0.4788; bottom: <0.0001, <0.0001, 0.0004, 0.0004, 0.0078. Source data
Extended Data Fig. 6
Extended Data Fig. 6. Validating AAV-driven Ptger3 knockout in NJP ganglia.
a, Cartoon depicting bilateral injection of AAV-Cre into NJP ganglia of flox-Ptger3 mice. b, The NJP ganglia of flox-Ptger3 mice were injected bilaterally with AAV-Cre (bottom) or saline (control, top), and cryosections of NJP ganglia were subsequently examined by two-color RNA in situ hybridization to detect Phox2b (green) and Ptger3 (red), scale bar: 100 μm. Images are representative from three independent experiments. Part a created with BioRender.com.
Extended Data Fig. 7
Extended Data Fig. 7. Cell-specific Ptger3 knockout attenuates behavioral responses to sublethal influenza A doses.
Phox2b-Cre; flox-Ptger3 mice (red) or flox-Ptger3 mice (black) were infected with sublethal doses of influenza A virus (top: 105 EID50 or LD21, bottom: 105.5 EID50 or LD39) and monitored daily as indicated, mean ± sem, n: 6 mice per group, **p < 0.005, ***p < 0.0005 by two-tailed unpaired t-test as detailed in Fig. 1 for behavior/physiology analysis, *p < 0.05, ns: not significant by a log-rank (Mantel-Cox) test for survival analysis. p values top to bottom left: <0.0001, <0.0001, <0.0001, 0.0002, 0.4524; right: <0.0001, <0.0001, <0.0001, 0.0002, 0.0155. Source data
Extended Data Fig. 8
Extended Data Fig. 8. Measures of flu-induced behavioral changes in cell-specific Ptger3 knockouts.
a, Water intake changes after flu infection in mice of Fig. 3, mean ± sem, n: 8 (Piezo2-ires-Cre), 6-8 (Phox2b-Cre; 8 control and 6 Phox2b-Cre), 6 (Pdyn-ires-Cre), 6 (Oxtr-ires-Cre), and 10 (Gabra1-ires-Cre) mice per group, ***p < 0.0005, ns: not significant by two-tailed unpaired t-test as detailed in Fig. 1 for behavior/physiology analysis. b, A Uniform Manifold Approximation and Projection (UMAP) plot derived from published single-cell transcriptome data of vagal and glossopharyngeal sensory ganglia indicating Trpv1 expression (red shading: natural log scale). c, Trpv1-ires-Cre; flox-Ptger3 mice (blue) or flox-Ptger3 mice (black) were infected with influenza A virus and monitored daily as indicated, mean ± sem, n: 6 mice per group, ns: not significant by two-tailed unpaired t-test as detailed in Fig. 1 for behavior/physiology analysis, ns: not significant by a log-rank (Mantel-Cox) test for survival analysis. p values top to bottom in a: 0.9101, 0.0004, 0.0534, 0.9544, <0.0001 and c: 0.2485, 0.0705, 0.0888, 0.1801, 0.8412. Source data
Extended Data Fig. 9
Extended Data Fig. 9. Impact of targeted Ptger3 knockout on cytokines and viral transcript levels.
a, PGE2 levels in plasma (left) and BALF (right) were measured by ELISA in mice indicated at various time points after exposure to influenza A virus or PBS control, mean ± sem, n: 5 mice per group, ns: not significant by two-way ANOVA involving analysis of influenza virus-infected groups. b, qPCR analysis of viral nucleoprotein (NP) transcript levels in the upper and lower respiratory tract of flox-Ptger3 and Gabra1-ires-Cre; flox-Ptger3 mice after influenza virus infection, normalized to Gapdh and uninfected controls, mean ± sem, n: 5 mice per group, ***p < 0.0005 by two-way ANOVA followed by Bonferroni’s multiple comparison test with comparisons made between red and blue curves (blue stars) or black and green curves (green stars). c, Levels of IFNγ, TNFα, and IL-6 in BALF were measured by ELISA at time points indicated after exposure to influenza A virus in flox-Ptger3 (black) or Gabra1-ires-Cre; flox-Ptger3 (red), mean ± sem, n: 3 mice per group, ***p < 0.0005 by two-way ANOVA followed by Bonferroni’s multiple comparison test with comparisons made between red and black curves (red stars). p values in a: 0.1591, 0.0662, b and c: <0.0001 for all indicated stars. Source data
Extended Data Fig. 10
Extended Data Fig. 10. Sparse innervation of internal organs by GABRA1 NJP neurons.
a, Native GFP fluorescent signals in wholemount preparations of NJP ganglia from Gabra1-ires-cre; lsl-L10 GFP, scale bar: 200 μm. b, NJP ganglia of Gabra1-ires-Cre mice were injected bilaterally with Cre-dependent AAV-flex-AP or AAV-flex-tdTomato and axons were visualized in fixed wholemount tissue preparations using either a colorimetric alkaline phosphatase substrate (top two rows, left images in bottom two rows) or tdTomato immunostaining (right two images in bottom two rows). Scale bars (left to right) top row: 500, 1000, 1000 (inset: 250) μm; 2nd row: 500, 1000, 500 μm; 3rd row: 200, 50 μm; bottom row: 200, 100 μm. Images are representative of three independent experiments involving GFP and tdTomato and two independent experiments involving alkaline phosphatase.

Comment in

Similar articles

Cited by

  • Stem cells and pain.
    da Silva MDV, Piva M, Martelossi-Cebinelli G, Stinglin Rosa Ribas M, Hoffmann Salles Bianchini B, K Heintz O, Casagrande R, Verri WA Jr. da Silva MDV, et al. World J Stem Cells. 2023 Dec 26;15(12):1035-1062. doi: 10.4252/wjsc.v15.i12.1035. World J Stem Cells. 2023. PMID: 38179216 Free PMC article. Review.
  • A vagal reflex evoked by airway closure.
    Schappe MS, Brinn PA, Joshi NR, Greenberg RS, Min S, Alabi AA, Zhang C, Liberles SD. Schappe MS, et al. Nature. 2024 Mar;627(8005):830-838. doi: 10.1038/s41586-024-07144-2. Epub 2024 Mar 6. Nature. 2024. PMID: 38448588 Free PMC article.
  • Cardiovascular Brain Circuits.
    Mohanta SK, Yin C, Weber C, Godinho-Silva C, Veiga-Fernandes H, Xu QJ, Chang RB, Habenicht AJR. Mohanta SK, et al. Circ Res. 2023 May 26;132(11):1546-1565. doi: 10.1161/CIRCRESAHA.123.322791. Epub 2023 May 25. Circ Res. 2023. PMID: 37228235 Free PMC article. Review.
  • SARS-CoV-2 papain-like protease activates nociceptors to drive sneeze and pain.
    Mali SS, Silva R, Gong Z, Cronce M, Vo U, Vuong C, Moayedi Y, Cox JS, Bautista DM. Mali SS, et al. bioRxiv [Preprint]. 2024 Jan 11:2024.01.10.575114. doi: 10.1101/2024.01.10.575114. bioRxiv. 2024. PMID: 38260476 Free PMC article. Preprint.
  • The Impact of the Nervous System on Arteries and the Heart: The Neuroimmune Cardiovascular Circuit Hypothesis.
    Mohanta SK, Sun T, Lu S, Wang Z, Zhang X, Yin C, Weber C, Habenicht AJR. Mohanta SK, et al. Cells. 2023 Oct 19;12(20):2485. doi: 10.3390/cells12202485. Cells. 2023. PMID: 37887328 Free PMC article.

References

    1. Poon DC, Ho YS, Chiu K, Wong HL, Chang RC. Sickness: from the focus on cytokines, prostaglandins, and complement factors to the perspectives of neurons. Neurosci. Biobehav. Rev. 2015;57:30–45. doi: 10.1016/j.neubiorev.2015.07.015. - DOI - PubMed
    1. Saper CB, Romanovsky AA, Scammell TE. Neural circuitry engaged by prostaglandins during the sickness syndrome. Nat. Neurosci. 2012;15:1088–1095. doi: 10.1038/nn.3159. - DOI - PMC - PubMed
    1. Dennis EA, Norris PC. Eicosanoid storm in infection and inflammation. Nat. Rev. Immunol. 2015;15:511–523. doi: 10.1038/nri3859. - DOI - PMC - PubMed
    1. Pinho-Ribeiro FA, Verri WA, Jr., Chiu IM. Nociceptor sensory neuron–immune interactions in pain and inflammation. Trends Immunol. 2017;38:5–19. doi: 10.1016/j.it.2016.10.001. - DOI - PMC - PubMed
    1. Funk CD. Prostaglandins and leukotrienes: advances in eicosanoid biology. Science. 2001;294:1871–1875. doi: 10.1126/science.294.5548.1871. - DOI - PubMed

Publication types

MeSH terms