. 2023 Mar 8;6(1):250.
doi: 10.1038/s42003-023-04625-4.

Metabolic reprogramming by Acly inhibition using SB-204990 alters glucoregulation and modulates molecular mechanisms associated with aging

Affiliations

Metabolic reprogramming by Acly inhibition using SB-204990 alters glucoregulation and modulates molecular mechanisms associated with aging

Alejandro Sola-García et al. Commun Biol. .

Erratum in

Abstract

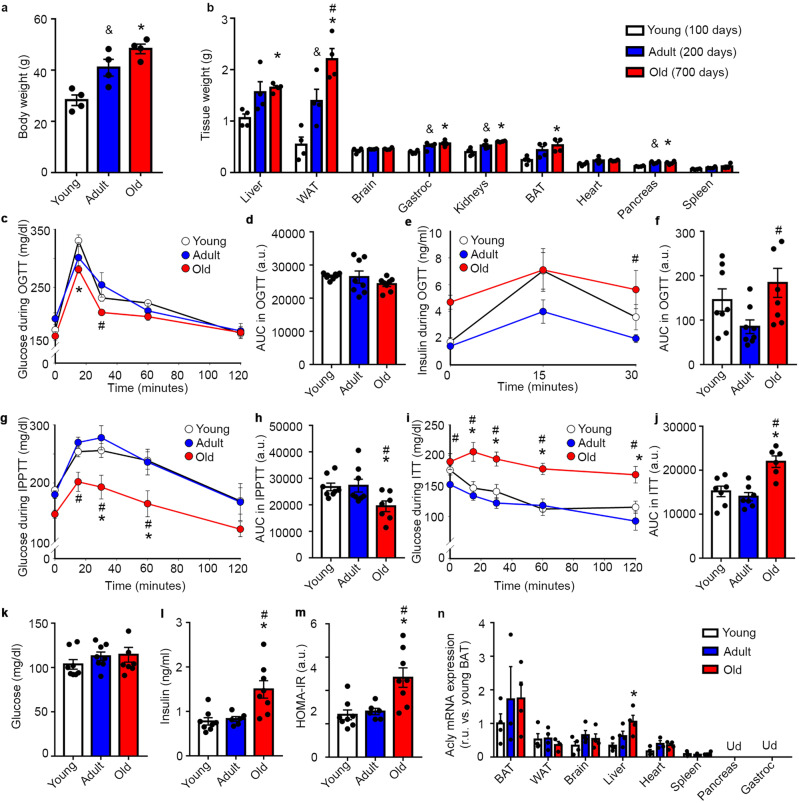
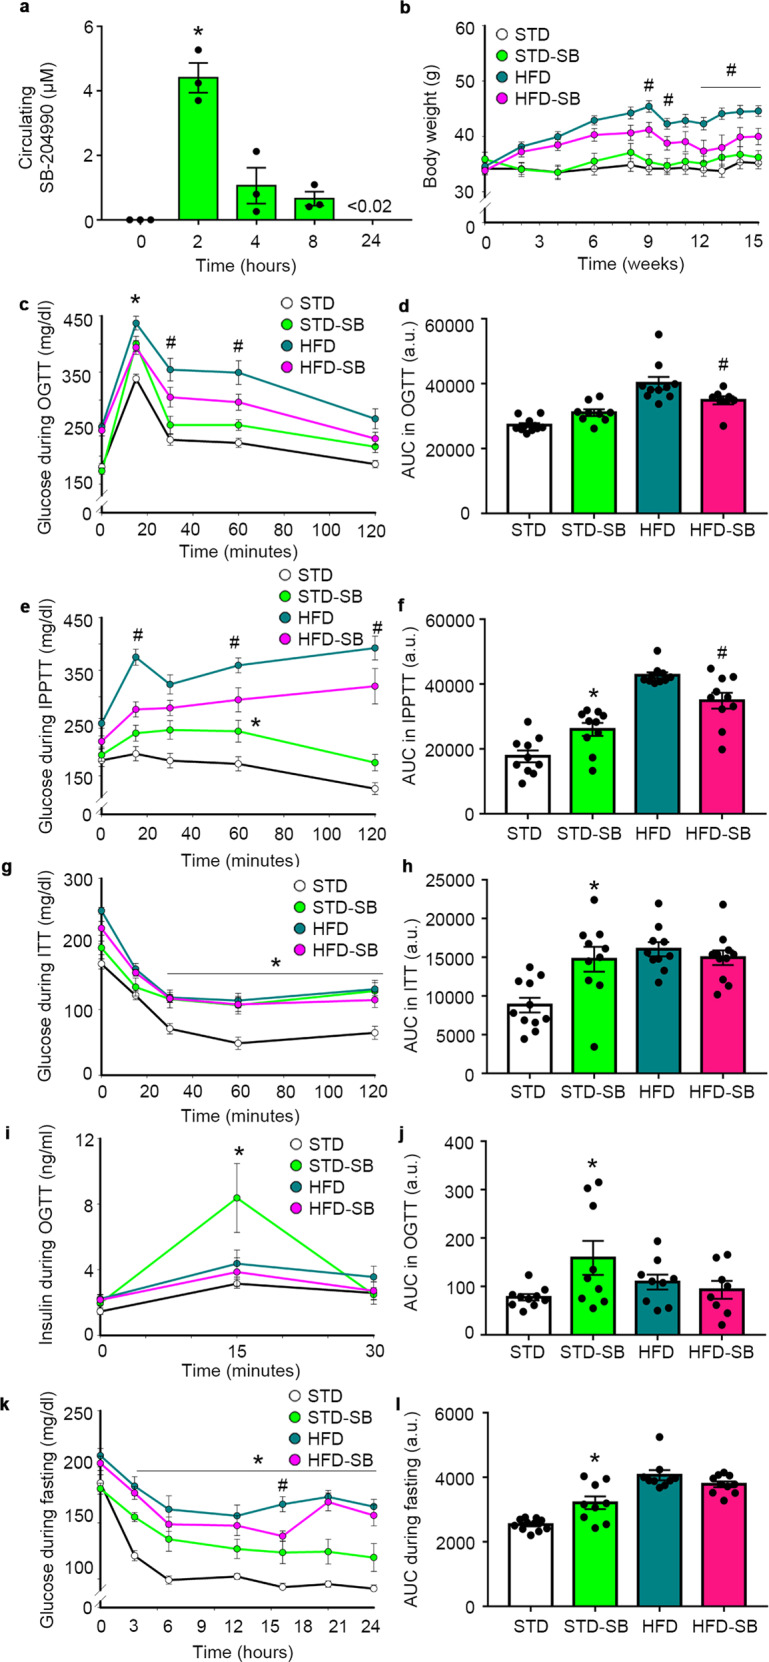
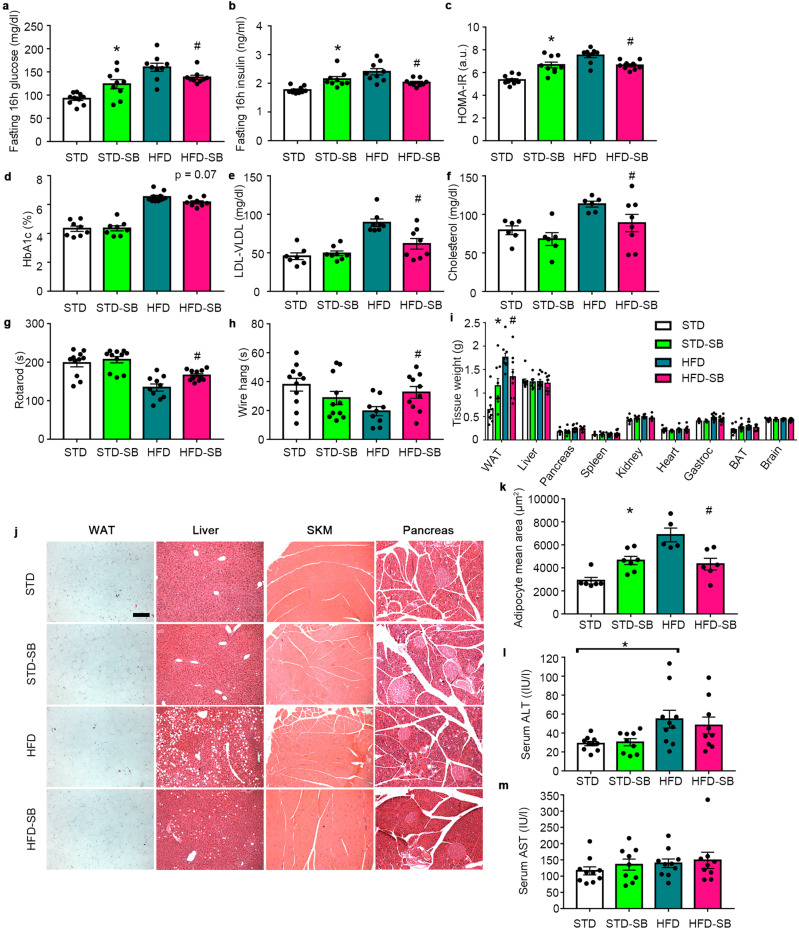
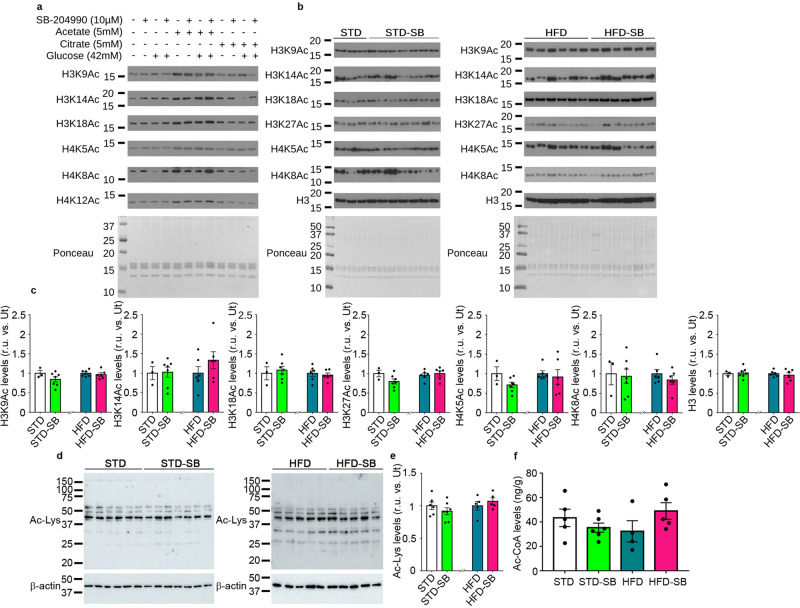
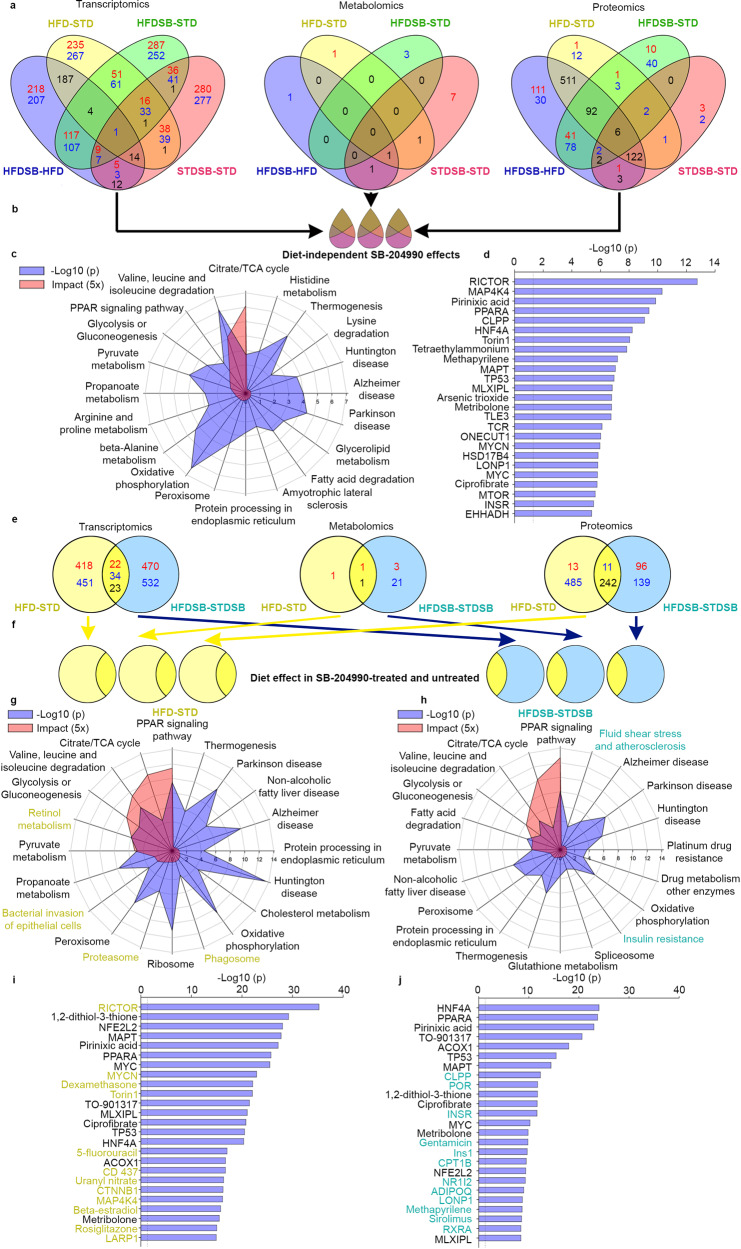
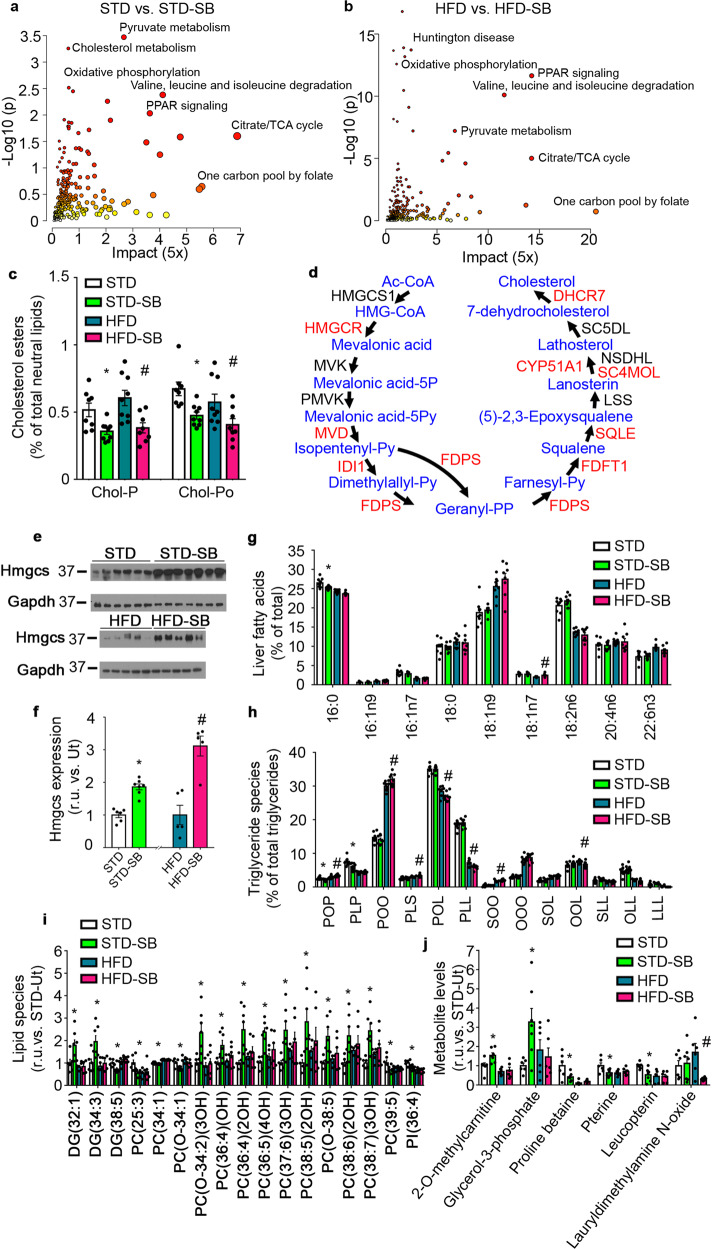
ATP-citrate lyase is a central integrator of cellular metabolism in the interface of protein, carbohydrate, and lipid metabolism. The physiological consequences as well as the molecular mechanisms orchestrating the response to long-term pharmacologically induced Acly inhibition are unknown. We report here that the Acly inhibitor SB-204990 improves metabolic health and physical strength in wild-type mice when fed with a high-fat diet, while in mice fed with healthy diet results in metabolic imbalance and moderated insulin resistance. By applying a multiomic approach using untargeted metabolomics, transcriptomics, and proteomics, we determined that, in vivo, SB-204990 plays a role in the regulation of molecular mechanisms associated with aging, such as energy metabolism, mitochondrial function, mTOR signaling, and folate cycle, while global alterations on histone acetylation are absent. Our findings indicate a mechanism for regulating molecular pathways of aging that prevents the development of metabolic abnormalities associated with unhealthy dieting. This strategy might be explored for devising therapeutic approaches to prevent metabolic diseases.


Conflict of interest statement

Patent details: Inhibidores de la ATP-citrato liasa como agentes geroprotectores, P202230801, V.C.G., A.M.M., Spain. All other authors declare no conflict of interest.

Figures

Fig. 1
Fig. 1. Hepatic Acly expression is increased in aging mice.
a Body weight. n = 4. One-way ANOVA. b Tissue weight. n = 4. One-way ANOVA. c OGTT. n = 8. Two-way ANOVA repeated measures. d Area under the curve (AUC) of the OGTT. n = 8. One-way ANOVA. e Insulin levels during an OGTT. n = 8. Two-way ANOVA repeated measures. f AUC of insulin levels during an OGTT. n = 8. One-way ANOVA. g IPPTT. n = 8 for young, n = 8 for adult, n = 7 for old. Two-way ANOVA repeated measures. h AUC of the IPPTT. n = 8 for young, n = 8 for adult, n = 7 for old. One-way ANOVA. i Insulin tolerance test (ITT). n = 7 for young, n = 7 for adult, n = 6 for old. Two-way ANOVA repeated measures. j AUC of the ITT. n = 7 for young, n = 7 for adult, n = 6 for old. One-way ANOVA. k Circulating glucose levels at 16 h of fasting. n = 8. One-way ANOVA. l Circulating insulin levels at 16 h of fasting. n = 8 for young, n = 6 for adult, n = 8 for old. One-way ANOVA. m HOMA-IR index. n = 8 for young, n = 6 for adult, n = 8 for old. One-way ANOVA. n Acly gene expression. n = 3–4. a.u.: arbitrary units. r.u.: relative units. BAT: Brown adipose tissue. Gastroc: Gastrocnemius. Ud: Under the threshold of detection. Data shown are the means ± SEM. *p < 0.05 Old vs. Young; #p < 0.05 Adult vs. Old; &p < 0.05 Young vs. Adult.
Fig. 2
Fig. 2. Long-term SB-204990 treatment improves metabolic health in mice fed with HFD and produces insulin resistance in STD-fed mice.
a Pharmacokinetic evaluation of circulating SB-204990 levels in mice exposed to oral administration (30 mg/kg of body weight) of SB-204990. n = 3. One-way ANOVA on Ranks. b Body weight over the course of the study. n = 11 for STD and STD-SB. n = 10 for HFD. n = 11 for HFD-SB weeks 0–13 and n = 9 for weeks 13–15. Two-way ANOVA. c OGTT at week 13 of treatment. n = 11 for STD. n = 9 for STD-SB. n = 10 for HFD. n = 8 for HFD-SB. Two-way ANOVA repeated measures. d AUC of the OGTT. n = 11 for STD. n = 9 for STD-SB. n = 10 for HFD. n = 8 for HFD-SB. Two-way ANOVA. e IPPTT at week 9 of treatment. n = 10. Two-way ANOVA repeated measures. f AUC of the IPPTT. n = 10. Two-way ANOVA. g ITT at week 11 of treatment. n = 11 for STD. n = 10 for STD-SB. n = 10 for HFD. n = 11 for HFD-SB. Two-way ANOVA repeated measures. h AUC of the ITT. n = 11 for STD. n = 10 for STD-SB. n = 10 for HFD. n = 11 for HFD-SB. Two-way ANOVA. i Insulin levels during an OGTT at week 10 of treatment. n = 10 for STD. n = 9 for STD-SB. n = 9 for HFD. n = 8 for HFD-SB. Two-way ANOVA repeated measures. j AUC of insulin levels during an OGTT. n = 10 for STD. n = 9 for STD-SB. n = 9 for HFD. n = 8 for HFD-SB. Two-way ANOVA. k Glucose levels during 24 h fasting at week 14 of treatment. n = 11 for STD. n = 9 for STD-SB. n = 9 for HFD. n = 9 for HFD-SB. Two-way ANOVA repeated measures. l AUC of glucose levels during 24 h fasting. n = 11 for STD. n = 9 for STD-SB. n = 9 for HFD. n = 9 for HFD-SB. Two-way ANOVA. SB: SB-204990. STD: standard diet. HFD: high-fat diet. a.u.: arbitrary units. Data shown are the means ± SEM. *p < 0.05 different times vs. time 0 or STD-SB vs. STD. #p < 0.05 HFD-SB vs. HFD.
Fig. 3
Fig. 3. SB-204990 improves physical health in mice fed with HFD.
a Circulating glucose levels in fasting conditions at week 14 of treatment. n = 10 for STD. n = 9 for STD-SB. n = 9 for HFD. n = 9 for HFD-SB. Two-way ANOVA. b Circulating insulin levels in fasting conditions at week 14 of treatment. n = 10 for STD. n = 9 for STD-SB. n = 9 for HFD. n = 9 for HFD-SB. Two-way ANOVA. c HOMA-IR index at week 14 of treatment. n = 10 for STD. n = 9 for STD-SB. n = 9 for HFD. n = 9 for HFD-SB. Two-way ANOVA. d Percentage of glycated hemoglobin (HbA1c) in blood at week 15 of treatment. n = 8 for STD. n = 8 for STD-SB. n = 10 for HFD. n = 8 for HFD-SB. Two-way ANOVA. e LDL/VLDL levels in serum at week 15 of treatment. n = 7 for STD. n = 8 for STD-SB. n = 8 for HFD. n = 8 for HFD-SB. Two-way ANOVA. f Total cholesterol levels in serum at week 15 of treatment. n = 6 for STD. n = 6 for STD-SB. n = 6 for HFD. n = 8 for HFD-SB. Two-way ANOVA. g Time to fall in an accelerating rotarod at week 8 of treatment. n = 11 for STD. n = 11 for STD-SB. n = 10 for HFD. n = 11 for HFD-SB. Two-way ANOVA. h Time to fall in wire hang test at week 10 of treatment. n = 11 for STD. n = 11 for STD-SB. n = 9 for HFD. n = 10 for HFD-SB. Two-way ANOVA. i Tissue weights. n = 10 for STD. n = 9 for STD-SB. n = 10 for HFD. n = 9 for HFD-SB. Two-way ANOVA. j Representative images of hematoxylin and eosin staining on several tissues. Scale 200 µm. n = 6 for STD. n = 7 for STD-SB. n = 5 for HFD. n = 6 for HFD-SB. k Adipocyte mean area. n = 6 for STD. n = 7 for STD-SB. n = 5 for HFD. n = 6 for HFD-SB. Two-way ANOVA. l Serum ALT levels in fasting conditions at week 14 of treatment. n = 10 for STD. n = 9 for STD-SB. n = 10 for HFD. n = 9 for HFD-SB. Two-way ANOVA. m Serum AST levels in fasting conditions at week 14 of treatment. n = 10 for STD. n = 9 for STD-SB. n = 10 for HFD. n = 9 for HFD-SB. Two-way ANOVA. SB: SB-204990. STD: standard diet. HFD: high-fat diet. BAT: Brown adipose tissue. Gastroc: gastrocnemius. SKM: skeletal muscle. a.u.: arbitrary units. Data shown are the means ± SEM. Unless otherwise highlighted, *p < 0.05 STD-SB vs. STD. #p < 0.05 HFD-SB vs. HFD.
Fig. 4
Fig. 4. Hepatic levels of histone acetylation are not altered by SB-204990.
a AML12 cells were cultured under standard conditions and were treated with indicated doses of acetate, citrate, and SB-204990 for 16 h. Glucose concentration in basal conditions is 17 mM, and supplemented is 42 mM. Acid histone isolations were performed, and histone acetylation levels were analyzed by western blot. Representative images of western blots and Ponceau staining are shown. n = 3. b Acid histone isolations were performed, and histone acetylation levels were analyzed by western blot in the livers of mice treated or not with SB-204990 for 15 weeks. Representative images of western blots and Ponceau staining are shown. n = 3 for STD. n = 7 for STD-SB. n = 6 for HFD. n = 6 for HFD-SB. c Quantification of histone acetylation levels of several residues is depicted. n = 3 for STD. n = 7 for STD-SB. n = 6 for HFD. n = 6 for HFD-SB. Student’s t-test. d Representative images of western blots of protein lysine acetylation are shown. Molecular weight markers are depicted on the left. n = 6 for STD. n = 7 for STD-SB. n = 5 for HFD. n = 5 for HFD-SB. e Densitometric quantification of hepatic protein lysine acetylation by western blot. n = 6 for STD. n = 7 for STD-SB. n = 5 for HFD. n = 5 for HFD-SB. Student’s t-test. f Total Ac-CoA levels in hepatic tissue. n = 5 for STD. n = 6 for STD-SB. n = 4 for HFD. n = 5 for HFD-SB. Two-way ANOVA. SB: SB-204990. STD: standard diet. HFD: high-fat diet. Ac-Lys: Acetylated lysine. r.u.: relative units. Ut: untreated. Data shown are the means ± SEM.*p < 0.05 STD-SB vs. STD. #p < 0.05 HFD-SB vs. HFD.
Fig. 5
Fig. 5. Multiomic analysis of the effects of SB-204990 in the liver; a major role in longevity pathways.
a Multiomics analysis in liver samples using transcriptomics, proteomics, and GC/MS-based metabolomics. Significantly altered transcripts, proteins, and metabolites are shown in Venn diagrams. Upregulation (red), downregulation (blue), and reciprocal regulation (black). b Drop shape analysis indicating diet-independent significant modulation in transcripts, proteins, and metabolites altered by SB-204990 in STD and HFD. c The JPA from MetaboAnalyst 5.0 was used to generate plots indicating the p-value and impact of the top 20 pathways with the lowest p-value according to the analytical scheme shown in Fig. 7b. d The Upstream Regulators module of IPA was used to generate plots depicting the top 25 upstream regulators with the lowest p-value according to the analytical scheme shown in Fig. 7b. e Significantly altered transcripts, proteins, and metabolites are shown in Venn diagrams depicting the effects the HFD vs. STD-responsive transcriptomic, metabolomic, and proteomic responses in the liver of mice treated or not with SB-204990. Upregulation (red), downregulation (blue), and reciprocal regulation (black). f Diagram indicating significant transcriptomic, metabolomic, and proteomic responses promoted by HFD in the liver of mice treated or not with SB-204990. g JPA plots indicating the p-value and impact of the top 20 pathways with the lowest p-value of HFD vs. STD according to the analytical scheme shown in Fig. 7f. Specific pathways are highlighted in yellow. h JPA plots indicating the p-value and impact of the top 20 pathways with the lowest p-value of HFD-SB vs. STD-SB according to the analytical scheme shown in Fig. 7f. Specific pathways are highlighted in blue. i Upstream Regulators plots depicting the top 25 upstream regulators with the lowest p-value according to the analytical scheme shown in Fig. 7f. Specific regulators are highlighted in yellow. j Upstream Regulators plots depicting the top 25 upstream regulators with the lowest p-value according to the analytical scheme shown in Fig. 7f. Specific regulators are highlighted in blue. Transcriptomic analysis; n = 4 for STD. n = 4 for STD-SB. n = 3 for HFD. n = 3 for HFD-SB. iTRAQ proteomic analysis n = 4. Metabolomic GC/MS analysis; n = 5 for STD. n = 7 for STD-SB. n = 6 for HFD. n = 6 for HFD-SB. SB: SB-204990. STD: standard diet. HFD: high-fat diet.
Fig. 6
Fig. 6. SB-204990 modulates fatty acid, cholesterol, and phospholipid metabolism.
a, b Multiomics analysis in liver samples using transcriptomics, proteomics, and GC/MS- and LC/MS-based metabolomics. The JPA from MetaboAnalyst 5.0 was used to generate plots indicating the p-value and impact of significantly modulated pathways. a STD-SB vs. STD. Transcriptomic analysis; n = 4. iTRAQ proteomic analysis n = 4. Metabolomic GC/MS analysis; n = 5 for STD. n = 7 for STD-SB. Metabolomic LC/MS analysis; n = 6 for STD. n = 7 for STD-SB. b HFD-SB vs. HFD. Transcriptomic analysis; n = 3. iTRAQ proteomic analysis n = 4. Metabolomic GC/MS n = 6. Metabolomic LC/MS analysis n = 6. c Hepatic cholesterol esters. Chol-P: Cholesteryl palmitate. Chol-Po: Cholesteryl palmitoleate n = 8 for STD. n = 9 for STD-SB. n = 9 for HFD. n = 8 for HFD-SB. Two-way ANOVA. d Integration of multiomic analysis in cholesterol biosynthetic pathway in HFD-SB mice. Red indicates upregulation. Black indicates no significant differences. e Immunoblots for Hmgcs and Gapdh from liver homogenates. f Densitometric analyses of immunoblots shown in panel E. n = 6 for STD. n = 7 for STD-SB. n = 5 for HFD. n = 5 for HFD-SB. Student’s t-test. g Hepatic fatty acids. n = 9 for STD. n = 9 for STD-SB. n = 9 for HFD. n = 8 for HFD-SB. Two-way ANOVA. h Hepatic triglyceride species. P: Palmitic acid. O: Oleic acid. L: Linoleic acid. S: Stearic acid. n = 8 for STD. n = 9 for STD-SB. n = 9 for HFD. n = 8 for HFD-SB. Two-way ANOVA. i Analysis of significantly altered hydrophobic metabolites by LC/MS. n = 6 for STD. n = 7 for STD-SB. n = 6 for HFD. n = 6 for HFD-SB. Two-way ANOVA. j Analysis of significantly altered hydrophilic metabolites by LC/MS. n = 6 for STD. n = 7 for STD-SB. n = 6 for HFD. n = 6 for HFD-SB. Two-way ANOVA. SB: SB-204990. STD: standard diet. HFD: high-fat diet. r.u.: relative units. Ut: untreated. Data shown are the means ± SEM. *p < 0.05 STD-SB vs. STD. #p < 0.05 HFD-SB vs. HFD.
Fig. 7
Fig. 7. Reduced Ampk signaling is required for SB-204990-mediated effects in mitochondrial function and lipid accumulation.
aj Primary hepatocytes were treated with SB-204990 or bempedoic acid under different experimental conditions. Unless otherwise stated, hepatocytes were treated for 16 h with 10 µM SB-204990 or 30 µM bempedoic acid. a Representative images of primary hepatocytes stained with Oil red O treated with 10 µM SB-204990. Scale bar 50 µm. n = 3. b Quantification of Oil red O staining of primary hepatocytes treated with 10 µM SB-204990. n = 3. Two-way ANOVA. cd Quantification of Oil red O staining and determination of metabolic activity by MTT test in primary hepatocytes treated with 10 µM SB-204990 in the presence of indicated doses of acetate or citrate. Glucose concentration in basal conditions (low glucose: LG) is 5 mM, and supplemented (high glucose: HG) is 25 mM. c Oil Red O staining. n = 7. Two-way ANOVA. d MTT test. n = 10. Two-way ANOVA. e, f Quantification of Oil red O staining and determination of metabolic activity by MTT test in primary hepatocytes treated with 30 µM bempedoic acid. Glucose concentration in basal conditions is 5 mM, and supplemented is 25 mM. e Oil Red O staining. n = 8. Two-way ANOVA. f MTT test. n = 9. Two-way ANOVA. g Oxygen consumption rate on primary hepatocytes. n = 4 for LG. n = 5 for LG-SB. n = 5 for HG. n = 5 for HG-SB. Two-way ANOVA. h Extracellular acidification rate on primary hepatocytes. n = 4 for LG. n = 5 for LG-SB. n = 5 for HG. n = 5 for HG-SB. Two-way ANOVA. i Extracellular acidification rate on primary hepatocytes on glycolysis stress test. n = 5 for LG. n = 6 for LG-SB. n = 5 for HG. n = 4 for HG-SB. Two-way ANOVA. j Oxygen consumption rate of freshly isolated liver mitochondria of mice gavaged with SB-204990. Liver samples were collected 3 h post-gavage. n = 3. Two-way ANOVA. k Immunoblots for hepatic proteins of mice treated with SB-204990 for 15 weeks. Densitometric quantification is shown in Supplementary Fig. S7f. n = 6 for STD. n = 7 for STD-SB. n = 5 for HFD. n = 5 for HFD-SB. l Immunoblots of primary hepatocytes treated or not with SB-204990 for 16 h. Densitometric quantification is shown in Supplementary Fig. S7i. n = 4. mo Primary hepatocytes were treated with SB-204990 or not in the presence of metformin (500 µM) for 16 h. m Representative images of primary hepatocytes stained with Oil red O. Scale bar 50 µm. n = 10. n Quantification of Oil red O staining. n = 10. Two-way ANOVA. o Quantification of metabolic activity by MTT. n = 10. Two-way ANOVA. STD: standard diet. HFD: high-fat diet. SB: SB-204990. Bemp: Bempedoic acid. Glu: glucose. Oligo: Oligomycin. FCCP: Carbonyl cyanide-p-trifluoromethoxyphenylhydrazone. Rot: Rotenone. Ant A: Antimycin A. ADP: Adenosine diphosphate. 2-DG: 2-deoxyglucose. NS: not significant. r.u.: relative units. Ut: untreated. Data shown are the means ± SEM. Unless otherwise stated *p < 0.05 SB vs. Ut or LG-SB vs. LG. #p < 0.05 HFD-SB vs. HFD. &p < 0.05 HG-acetate vs. acetate.

References

    1. Shields, M. & Martel, L. Healthy living among seniors. Health Rep.16, 7–20 (2006). - PubMed
    1. Walston, J. D. Sarcopenia in older adults. Curr. Opin. Rheumatol.24, 623–627 (2012). - PMC - PubMed
    1. Kuznetsova, T., Prange, K. H. M., Glass, C. K. & de Winther, M. P. J. Transcriptional and epigenetic regulation of macrophages in atherosclerosis. Nat. Rev. Cardiol.17, 216–228 (2020). - PMC - PubMed
    1. Gauthier, B. R. et al. Thyroid hormones in diabetes, cancer, and aging. Aging Cell19, e13260 (2020). - PMC - PubMed
    1. Pietrocola, F., Galluzzi, L., Bravo-San Pedro, J. M., Madeo, F. & Kroemer, G. Acetyl coenzyme A: a central metabolite and second messenger. Cell Metab.21, 805–821 (2015). - PubMed

Publication types

Substances