

Comment
doi: 10.1038/s41586-023-05746-w.
Reply to: Multivariate BWAS can be replicable with moderate sample sizes
Affiliations
- PMID: 36890374
- PMCID: PMC9995264
- DOI: 10.1038/s41586-023-05746-w
Item in Clipboard
Comment
Reply to: Multivariate BWAS can be replicable with moderate sample sizes
Nature.
2023 Mar.
No abstract available
Conflict of interest statement
D.A.F. and N.U.F.D. have a financial interest in Turing Medical and may financially benefit if the company is successful in marketing FIRMM motion monitoring software products. A.N.V., D.A.F. and N.U.F.D. may receive royalty income based on FIRMM technology developed at Washington University School of Medicine and Oregon Health and Sciences University and licensed to Turing Medical. D.A.F. and N.U.F.D. are co-founders of Turing Medical. These potential conflicts of interest have been reviewed and are managed by Washington University School of Medicine, Oregon Health and Sciences University and the University of Minnesota.
Figures
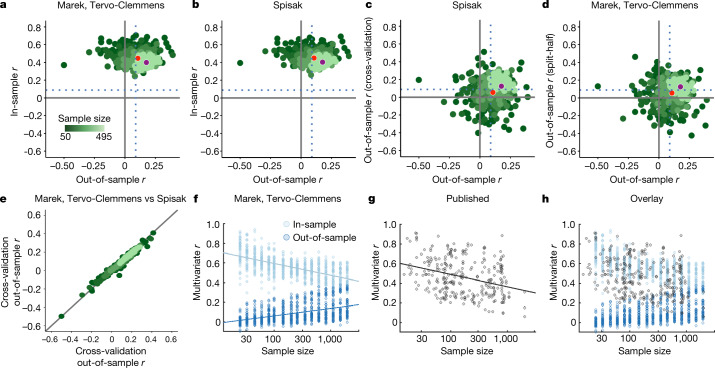
a–e, Methods comparison between our previous study (split-half) and Spisak et al. (cross-validation followed by split-half). ‘Marek, Tervo-Clemmens’ and ‘Spisak’ refer to the methodolgies described in ref. and ref. , respectively. For a–e, HCP 1200 Release (full correlation) data were used to predict age-adjusted total cognitive ability. Analysis code and visualizations (x,y scaling; colours) are the same as in Spisak et al.. The x axes in a–e always display the split-half out-of-sample effect estimates from the second (replication) half of the data (correlation between true scores and predicted scores; as in Spisak et al. and in our previous study; Supplementary Methods). a, In-sample (training correlation; y axis) as a function of out-of-sample associations (plot convention in our previous study). b, Matched comparison of the true in-sample association (training correlations, mean across folds; y axis) in the method proposed by Spisak et al.. c, The proposed correction by Spisak et al. that inserts an additional cross-validation step to evaluate the first half of data, which by definition makes this an out-of-sample association (y axis). d, Replacing the cross-validation step from Spisak et al. with a split-half validation provides a different (compared with c) out-of-sample association of the first half of the total data (that is, each of the first stage split halves is one-quarter of the total data; y axis). The appropriate and direct comparison of in-sample associations between Spisak et al. and our previous study is comparing b to a, rather than c to a. The Spisak et al. method (cross-validation followed by split-half validation) does not reduce in-sample overfitting (b) but, instead, adds an additional out-of-sample evaluation (c), which is nearly identical to split-half validation twice in a row (d), and makes it clear why the out-of-sample performance of these two methods is likewise nearly identical. e, Correspondence between out-of-sample associations (to the left-out half) from the additional cross-validation step proposed by Spisak et al. (mean across folds; y axis) and the original split-half validation from our previous study (x axis). The identity line is shown in black. f, In-sample (r; light blue) and out-of-sample (r; dark blue) associations as a function of sample size. Data are from figure 4a–d of ref. . g, Published literature review of multivariate r (y axis) as a function of sample size (data from ref. ) displayed with permission. For f and g, best fit lines are displayed in log10 space. h, Overlap of f and g.
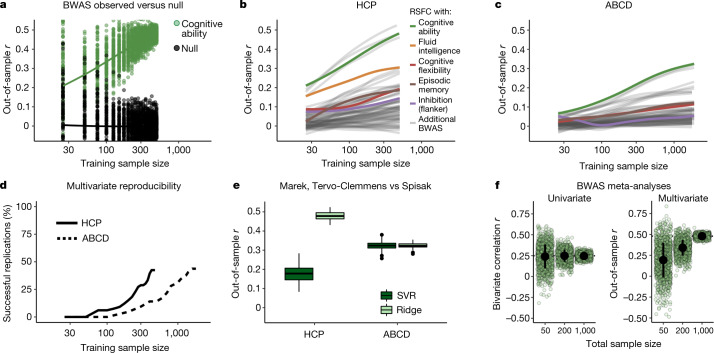
a, Example bootstrapped BWAS of total cognitive ability (green) and null distribution (black) (y axis), as a function of sample size (x axis) from the suggested method of Spisak et al. (RSFC by partial correlation; prediction by ridge regression) in the HCP dataset (n = 1,200, 1 site, 1 scanner, 60 min RSFC/participant, 76% white). Sample sizes were log10-transformed for visualization. b, Out-of-sample correlation (between true scores and predicted scores) from ridge regression (y axis; code from Spisak et al.) as a function of training sample size (x axis, log10 scaling) for 33 cognitive and mental health phenotypes (Supplementary Information) in the HCP dataset. Each line displays a smoothed fit estimate (through penalized splines in general additive models) for a brain (RSFC (partial correlations, as proposed by Spisak et al.), cortical thickness) phenotype pair (66 total) that has 100 bootstrapped iterations from sample sizes of 25 to 500 (inclusive) in increments of 25 (20 total bins). Sample sizes were log10-transformed (for visualization) before general additive model fitting. c, The same as in b, but in the ABCD dataset (n = 11,874, 21 sites, 3 scanner manufacturers, 20 min RSFC/participant, 56% white) using 32 cognitive and mental health phenotypes at sample sizes of 25, 50, 75 and from 100 to 1,900 (inclusive) in increments of 100 (22 total bins). d, The percentage of brain–phenotype pairs (BWAS) from b and c with significant replication on the basis of the method of Spisak et al. (Supplementary Information). e, Comparison of our original method in our previous study and the method proposed by Spisak et al. at the full split-half sample size of HCP (left) and ABCD (right). Out-of-sample correlations (RSFC with total cognitive ability, y axis) for the method used in our previous study (dark green; RSFC by correlation, PCA, SVR) and by Spisak et al. (light green; RSFC by partial correlation, ridge regression). Repeating the method proposed by Spisak et al. in ABCD (right) and comparing this to the method used in our previous study results in a very similar out-of-sample r. f, Simulated individual studies (light green circles; n = 1,000 per sample size) and meta-analytic estimates (black dot, ±1 s.d.) using the method of Spisak et al. (partial correlations in the HCP dataset) for the largest univariate association (left; y axis, bivariate correlation) and multivariate association (right; y axis, out-of-sample correlation) for total cognitive ability versus RSFC, as a function of total sample size (x axis; bivariate correlation for sample sizes of 50, 200 and 1,000, and multivariate sum of train and test samples, each 25, 100 and 500). For univariate approaches, studies of any sample size, when appropriately aggregated to a large total sample size, can correctly estimate the true effect size. However, for multivariate approaches, even when aggregating across 1,000 independent studies, studies with a small sample size produce prediction accuracies that are downwardly biased relative to large sample studies, highlighting the need for large samples in multivariate analyses.
Comment on
-
Reproducible brain-wide association studies require thousands of individuals.Nature. 2022 Mar;603(7902):654-660. doi: 10.1038/s41586-022-04492-9. Epub 2022 Mar 16. Nature. 2022. PMID: 35296861 Free PMC article.
-
Multivariate BWAS can be replicable with moderate sample sizes.Nature. 2023 Mar;615(7951):E4-E7. doi: 10.1038/s41586-023-05745-x. Epub 2023 Mar 8. Nature. 2023. PMID: 36890392 Free PMC article. No abstract available.
References
-
- Schönbrodt, F. D. & Perugini, M. At what sample size do correlations stabilize? J. Res. Pers.47, 609–612 (2013).
Publication types
MeSH terms
Grants and funding
- U24 DA041147/DA/NIDA NIH HHS/United States
- U01 DA041120/DA/NIDA NIH HHS/United States
- UE5 NS090978/NS/NINDS NIH HHS/United States
- U01 DA041093/DA/NIDA NIH HHS/United States
- K99 MH129616/MH/NIMH NIH HHS/United States
- K23 NS123345/NS/NINDS NIH HHS/United States
- U24 DA041123/DA/NIDA NIH HHS/United States
- T32 MH100019/MH/NIMH NIH HHS/United States
- R00 MH129616/MH/NIMH NIH HHS/United States
- U01 DA041106/DA/NIDA NIH HHS/United States
- U01 DA041117/DA/NIDA NIH HHS/United States
- U01 DA041148/DA/NIDA NIH HHS/United States
- R25 NS090978/NS/NINDS NIH HHS/United States
- K23 NS088590/NS/NINDS NIH HHS/United States
- R01 MH080243/MH/NIMH NIH HHS/United States
- U01 DA041134/DA/NIDA NIH HHS/United States
- U01 DA041022/DA/NIDA NIH HHS/United States
- RF1 MH120025/MH/NIMH NIH HHS/United States
- K99 MH121518/MH/NIMH NIH HHS/United States
- U01 DA041156/DA/NIDA NIH HHS/United States
- R01 MH067924/MH/NIMH NIH HHS/United States
- R21 DA041128/DA/NIDA NIH HHS/United States
- U01 DA041025/DA/NIDA NIH HHS/United States
- R01 MH096773/MH/NIMH NIH HHS/United States
- U54 MH091657/MH/NIMH NIH HHS/United States
- U01 DA041089/DA/NIDA NIH HHS/United States
- U01 DA041028/DA/NIDA NIH HHS/United States
- U01 DA041048/DA/NIDA NIH HHS/United States
- R44 MH121276/MH/NIMH NIH HHS/United States
- R01 MH115357/MH/NIMH NIH HHS/United States
- R37 MH080243/MH/NIMH NIH HHS/United States
- P50 HD103525/HD/NICHD NIH HHS/United States
- R44 MH122066/MH/NIMH NIH HHS/United States
- R44 MH124567/MH/NIMH NIH HHS/United States
- UL1 TR002345/TR/NCATS NIH HHS/United States
- U01 DA041174/DA/NIDA NIH HHS/United States
- R00 MH121518/MH/NIMH NIH HHS/United States
LinkOut - more resources
Full Text Sources
