. 2023 Jun;22(6):e13807.
doi: 10.1111/acel.13807. Epub 2023 Mar 8.

The gut microbiota metabolite capsiate regulate SLC2A1 expression by targeting HIF-1α to inhibit knee osteoarthritis-induced ferroptosis

Affiliations

The gut microbiota metabolite capsiate regulate SLC2A1 expression by targeting HIF-1α to inhibit knee osteoarthritis-induced ferroptosis

Zhiyuan Guan et al. Aging Cell. 2023 Jun.

Abstract

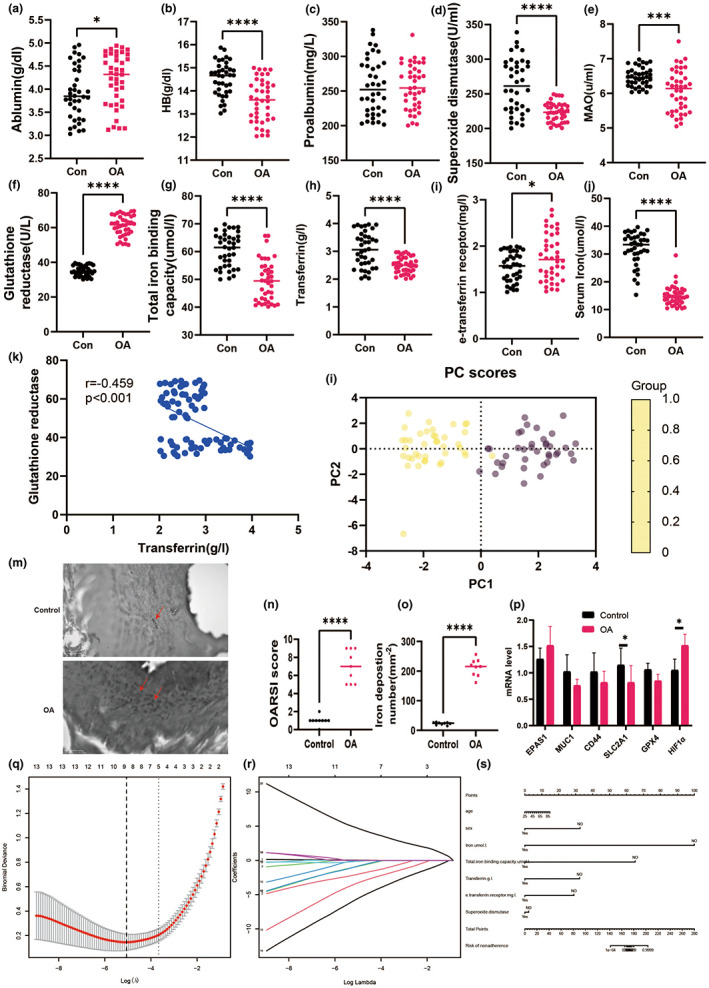
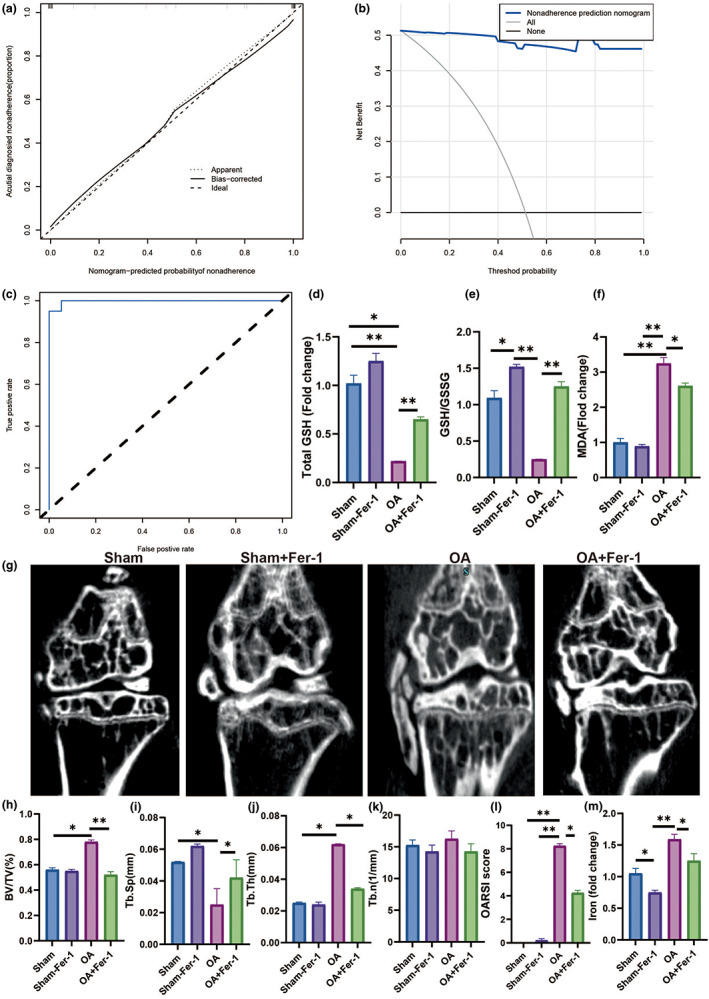
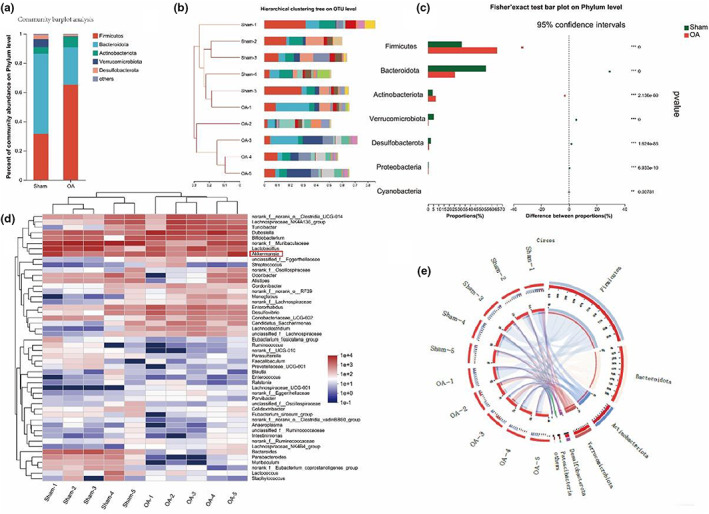
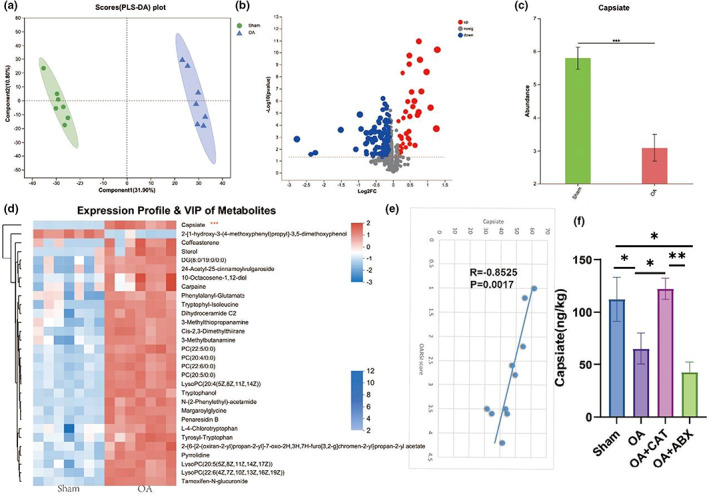
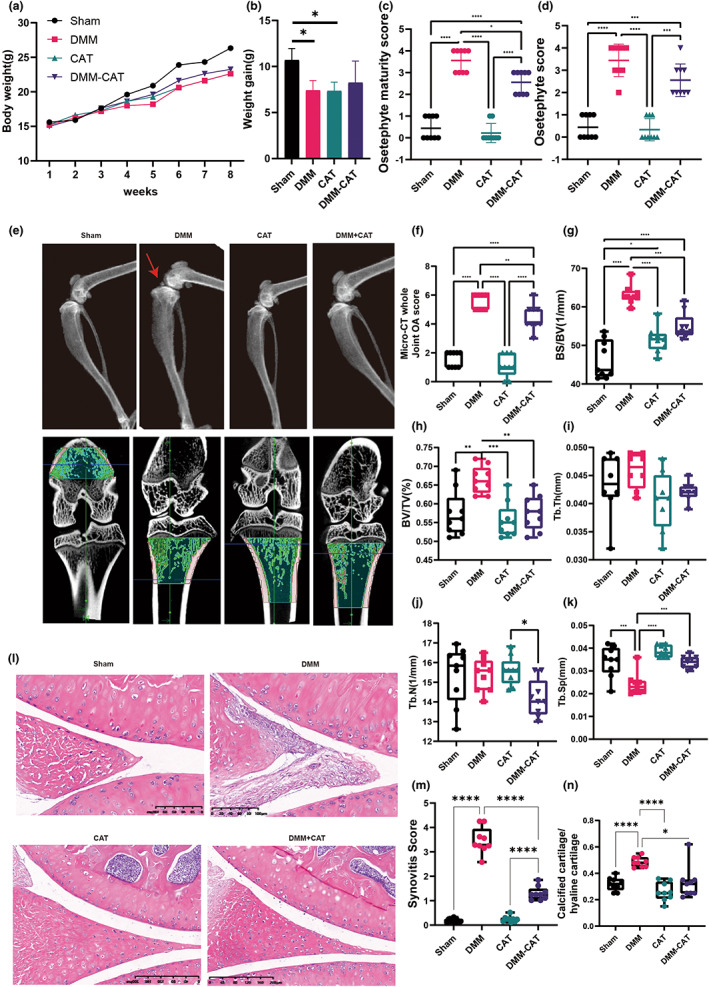
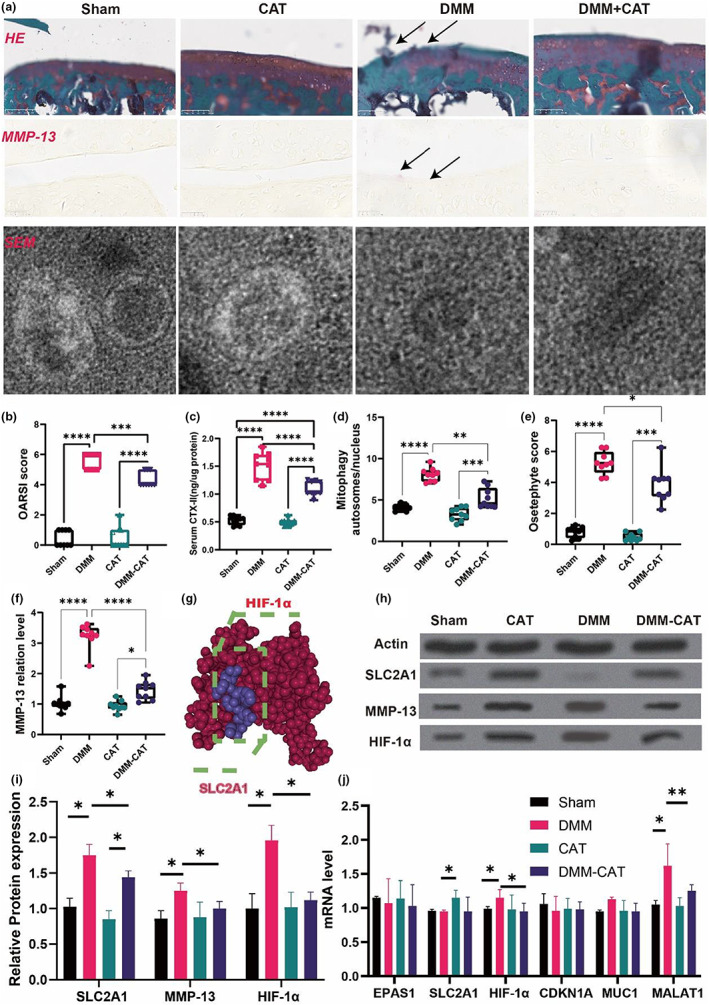
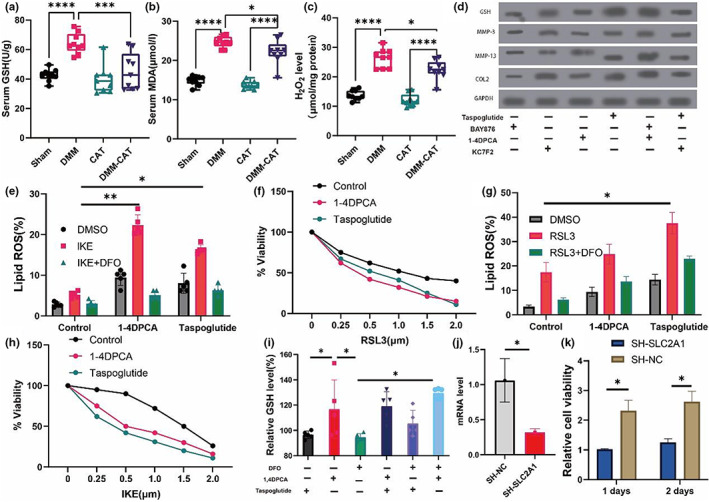
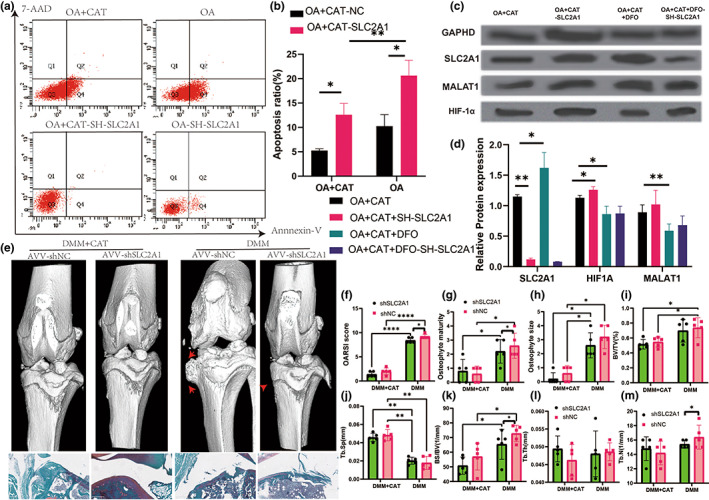
Ferroptosis is an iron-dependent cell death that has been found to aggravate the progression of osteoarthritis (OA) and gut microbiota- OA axis refers to the bidirectional information network between the gut microbiota and OA, which may provide a new way to protect the OA. However, the role of gut microbiota-derived metabolites in ferroptosis-relative osteoarthritis remains unclear. The objective of this study was to analyze the protective effect of gut microbiota and its metabolite capsiate (CAT) on ferroptosis-relative osteoarthritis in vivo and in vitro experiments. From June 2021 to February 2022, 78 patients were evaluated retrospectively and divided into two groups: The health group (n = 39) and the OA group (n = 40). Iron and oxidative stress indicators were determined in peripheral blood samples. And then in vivo and in vitro experiments, a surgically destabilized medial meniscus (DMM) mice model was established and treated with CAT or Ferric Inhibitor-1 (Fer-1). Solute Carrier Family 2 Member 1 (SLC2A1) short hairpin RNA (shRNA) was utilized to inhibit SLC2A1 expression. Serum iron was increased significantly but total iron binding capacity was decreased significantly in OA patients than healthy people (p < 0.0001). The least absolute shrinkage and selection operator clinical prediction model suggested that serum iron, total iron binding capacity, transferrin, and superoxide dismutase were all independent predictors of OA (p < 0.001). Bioinformatics results suggested that SLC2A1, Metastasis-Associated Lung Adenocarcinoma Transcript 1 (MALAT1), and HIF-1α (Hypoxia Inducible Factor 1 Alpha)-related oxidative stress signaling pathways play an important role in iron homeostasis and OA. In addition, gut microbiota 16s RNA sequencing and untargeted metabolomics were used to find that gut microbiota metabolites CAT in mice with osteoarthritis were negatively correlated with Osteoarthritis Research Society International (OARSI) scores for chondrogenic degeneration (p = 0.0017). Moreover, CAT reduced ferroptosis-dependent osteoarthritis in vivo and in vitro. However, the protective effect of CAT against ferroptosis-dependent osteoarthritis could be eliminated by silencing SLC2A1. SLC2A1 was upregulated but reduced the SLC2A1 and HIF-1α levels in the DMM group. HIF-1α, MALAT1, and apoptosis levels were increased after SLC2A1 knockout in chondrocyte cells (p = 0.0017). Finally, downregulation of SLC2A1 expression by Adeno-associated Virus (AAV) -SLC2A1 shRNA improves osteoarthritis in vivo. Our findings indicated that CAT inhibited HIF-1a expression and reduced ferroptosis-relative osteoarthritis progression by activating SLC2A1.

Keywords: Ferroptosis; HIF-1α; SLC2A1; iron homeostasis; osteoarthritis.


Conflict of interest statement

The authors declare no conflict of interest. The funders had no role in the design of the study; in the collection, analyses, or interpretation of data; in the writing of the manuscript, or in the decision to publish the results.

Figures

FIGURE 1
FIGURE 1
Iron homeostasis‐related indicators and prognostic nomogram analysis in OA patients. (a) Serum iron. (b) HB, (c) proablumin. (d) Superoxide dismutase. (e) MAO. (f) Glutathione reductase. (g) Total iron binding capacity. (h) Transferrin. (i) e‐transferrin receptor. (J) serum iron. (k) correlation analysis between glutathione reductase and transferrin. (l) PCA analysis. (m) Distribution of expression of iron regulators in synovial tissue of healthy controls and osteoarthritis. (n) OARSI score. (o) iron deposition number. (p) mRNA level in synovial tissue. (q) Optimal parameter (lambda) selection in the LASSO model uses fivefold cross‐validation using minimal criteria. (r) LASSO coefficient profiles of the 22 characteristics. A coefficient profile plot was constructed against the log(lambda) sequence. Vertical line was drawn at the value determined using fivefold cross‐validation, where optimum lambda resulted in five features with nonzero coefficients. Developed nomogram. HB, hemoglobin; MAO, monoamine oxidase; OA, osteoarthritis; AUC, area under the curve; GSH, glutathione; GSH/GSSH, glutathione/oxidized glutathione; OARSI, Osteoarthritis Research Society International. *p < 0.05; **p < 0.01; ***p < 0.001.
FIGURE 2
FIGURE 2
Ferropotisis play an important role in OA. (a) Calibration curves of the nonadherence nomogram prediction in the cohort. (b) Decision curve analysis for the nonadherence nomogram. (c) AUC curve in iron homeostasis in OA patients. (d) Total GSH. (e) GSH/GSSH. (f) MDA. (g) Representative figure of Micro‐CT. (h) BV/TV in tibia. (i) Tb.Th in tibia. (j) Tb.N in tibia. (k) Tb.Sp in tibia. (l) OARSI score in tibia. (m) Iron load in tibia. All data are from n = 3 independent experiments. OA, osteoarthritis; AUC, area under the curve; GSH, glutathione; GSH/GSSH, glutathione/oxidized glutathione; BV/TV, bone volume over total volume; Tb.Th, trabecular thickness; Tb.N, trabecular number; Tb.Sp, trabecular spacing; OARSI, Osteoarthritis Research Society International. *p < 0.05; **p < 0.01; ***p < 0.001.
FIGURE 3
FIGURE 3
OA‐induced changes in the gut microbiota. (a) Relative bacterial abundance at the phyla level in the cecum of mice.(b) Hierarchical clustering tree on OUT level. (c) Fisher's exact test bar plot on phylum level. (d,e) Heat map and circus analysis of gut microbiota. OA, osteoarthritis; AUC, area under the curve; *p < 0.05; **p < 0.01; ***p < 0.001.
FIGURE 4
FIGURE 4
OA‐induced changes in the gut microbiota‐related metabolites. (a) Scatter plots of PLS‐DA analysis of metabolomics of cecal content. (b) Volcano plot showing the differentially accumulated [log2 (fold change) on X‐axis] and significantly changed [−log10 (p) on Y‐axis] metabolites in the Sham and OA group. (c) CAT levels in OA (nontargeted). (d) Heat map of gut microbiota‐related metabolites. (e) The correlation analysis between CAT and ORASI score. (f) CAT levels after ABX treatment in OA mice. OA, osteoarthritis; CAT, Capsiate; AUC, area under the curve; *p < 0.05; **p < 0.01; ***p < 0.001.
FIGURE 5
FIGURE 5
CAT changes the body weight gain and improved the development of OA mice. (a) The change of body weight. (b) body weight gain. (c) Osteophyte score. (d) Osteophyte maturity score. (e) Representative diagram of DXA. (f) Micro‐CT whole joint OA score. (g) BS/TV in tibia. (h) BV/TV in tibia. (i) Tb.Th in tibia. (j) Tb.N in tibia. (k) Tb.Sp in tibia. (l) Representative figure of HE staining. (m) Synovitis in tibia. (n) calcified cartilage/hyaline cartilage in tibia. All data are from n = 9 independent experiments. OA, osteoarthritis; CAT, Capsiate; AUC, area under the curve; GSH, glutathione; GSH/GSSH, glutathione/oxidized glutathione; DXA, dual energy x‐ray absorptiometry; BV/TV, bone volume over total volume; Tb.Th, trabecular thickness; Tb.N, trabecular number; Tb.Sp, trabecular spacing; OARSI; Osteoarthritis Research Society International. *p < 0.05; **p < 0.01; ***p < 0.001.
FIGURE 6
FIGURE 6
CAT regulated the SLC2A1, MMP‐13, HIF‐1α expression and improved the development of OA mice. (a) Representative diagram of Safranin‐O/Fast Green staining, immunofluorescence, scanning electron microscope. (b) OARSI score. (c) serum CTX‐II. (d) Mitophagy autosomes/nucleus. (e) Osteophyte score. (f) MMP‐13 protein level. (g) 3D binding structure of HIF1 and SCL2A1 determined via molecular modeling and docking studies. (h) Western blot. (i) Relative protein expression. (j) mRNA level. All data are from n = 9 independent experiments. OA, osteoarthritis; CAT, Capsiate; AUC, Area Under The Curve; GSH, glutathione; GSH/GSSH, glutathione/oxidized glutathione; DXA, dual energy x‐ray absorptiometry; BV/TV, bone volume over total volume; Tb.Th, trabecular thickness; Tb.N, trabecular number; Tb.Sp, trabecular spacing; OARSI, Osteoarthritis Research Society International. MMP‐13, matrix metalloproteinase‐13; DMM, destabilized medial meniscus;**p < 0.01; ***p < 0.001.
FIGURE 7
FIGURE 7
CAT‐related the oxidative stress in OA mice and SLC1A3‐HIF1α‐MALAT1 axis in cell experiment. (a) Serum GSH. (b) Serum MDA. (c) Serum H2O2. (d) Western blotting analysis by treated with SLC2A1, 1‐4DPCA and KC7F2. (e) Cells were treated as indicated for 18 h (IKE, 1 μM) in the presence of the CAT (1 μM) and lipid ROS accumulation was measured by BODIPY C11 staining coupled with flow cytometry. (f) Relative viability of fibroblasts derived and primed with control, 1‐4DPCA and SLC1A3 (20 ng/mL) for 72 h, followed by treatment with different concentrations of IKE. (g) Cells were treated as indicated for 18 h (RSL3, 1 μM) in the presence of the CAT (1 μM) and lipid ROS accumulation was measured by BODIPY C11 staining coupled with flow cytometry. (h) Relative viability of fibroblasts derived and primed with control, 1‐4DPCA and SLC1A3 (20 ng/mL) for 72 h, followed by treatment with different concentrations of RSL3. (i) relative GSH level treated by CAT, IKE, and RSL3. (j) SLC2A1 mRNA level in sh‐SLC2A1 experiment. (k) The 1 days and 2 days of cell viability in sh‐SLC2A1 experiment. (f) flow cytometry in sh‐SLC2A1 experiment. All data are from n = 9 independent experiments. HB, hemoglobin; MAO, monoamine oxidase; OA, osteoarthritis; AUC, area under the curve; GSH, glutathione; GSH/GSSH, glutathione/oxidized glutathione; OARSI; Osteoarthritis Research Society International. *p < 0.05; **p < 0.01; ***p < 0.001.
FIGURE 8
FIGURE 8
Apoptosis and protein level in sh‐SLC2A1 experiment and SLC2A1 downregulation improve CAT treatment with OA progression. (a) flow cytometry in sh‐SLC2A1 experiment. (b) Apoptosis in sh‐SLC2A1 experiment. (c) Western blot in sh‐SLC2A1 experiment. (d) Relative protein expression in sh‐SLC2A1 experiment. (e) Three‐dimensional models of mice knee joints were injected intra‐articularly with AAV carrying SLC2A1‐specific shRNA and analyzed 8 weeks after surgery. (f) OARSI score. (g) Osteophyte maturity. (h) Osteophyte size. (i) BV/TV in tibia. (j) Tb.Sp in tibia. (k) BS/TV in tibia. (l) Tb.Th in tibia. (m) Tb.N in tibia. All data are from n = 9 independent experiments. OA, osteoarthritis; CAT, Capsiate; AUC, Area Under The Curve; GSH, glutathione; GSH/GSSH, glutathione/oxidized glutathione; DXA, dual‐energy x‐ray absorptiometry; BV/TV, bone volume over total volume; Tb.Th, trabecular thickness; Tb.N, trabecular number; Tb.Sp, trabecular spacing; OARSI, Osteoarthritis Research Society International. MMP‐13, matrix metalloproteinase‐13; DMM, destabilized medial meniscus;**p < 0.01; ***p < 0.001.

References

    1. Ancey, P. B. , Contat, C. , Boivin, G. , Sabatino, S. , Pascual, J. , Zangger, N. , Perentes, J. Y. , Peters, S. , Abel, E. D. , Kirsch, D. G. , Rathmell, J. C. , Vozenin, M. C. , & Meylan, E. (2021). GLUT1 expression in tumor‐associated neutrophils promotes lung cancer growth and resistance to radiotherapy. Cancer Research, 81, 2345–2357. - PMC - PubMed
    1. Andrews, M. C. , & Vasanthakumar, A. (2023). Gut microbiota – a double‐edged sword in cancer immunotherapy. Trends in Cancer, 9, 3–5. - PubMed
    1. Arunachalam, P. S. , Scott, M. K. D. , Hagan, T. , Li, C. , Feng, Y. , Wimmers, F. , Grigoryan, L. , Trisal, M. , Edara, V. V. , Lai, L. , Chang, S. E. , Feng, A. , Dhingra, S. , Shah, M. , Lee, A. S. , Chinthrajah, S. , Sindher, S. B. , Mallajosyula, V. , Gao, F. , … Pulendran, B. (2021). Systems vaccinology of the BNT162b2 mRNA vaccine in humans. Nature, 596, 410–416. - PMC - PubMed
    1. Balachandran, V. P. , Gonen, M. , Smith, J. J. , & DeMatteo, R. P. (2015). Nomograms in oncology: More than meets the eye. The Lancet Oncology, 16, e173–e180. - PMC - PubMed
    1. Barnett, R. (2018). Osteoarthritis. Lancet (London, England), 391, 1985. - PubMed

Publication types

LinkOut - more resources