. 2023 Feb 20:13:1105648.
doi: 10.3389/fonc.2023.1105648. eCollection 2023.

Flavin fluorescence lifetime and autofluorescence optical redox ratio for improved visualization and classification of brain tumors

Affiliations

Flavin fluorescence lifetime and autofluorescence optical redox ratio for improved visualization and classification of brain tumors

David Reichert et al. Front Oncol. .

Abstract

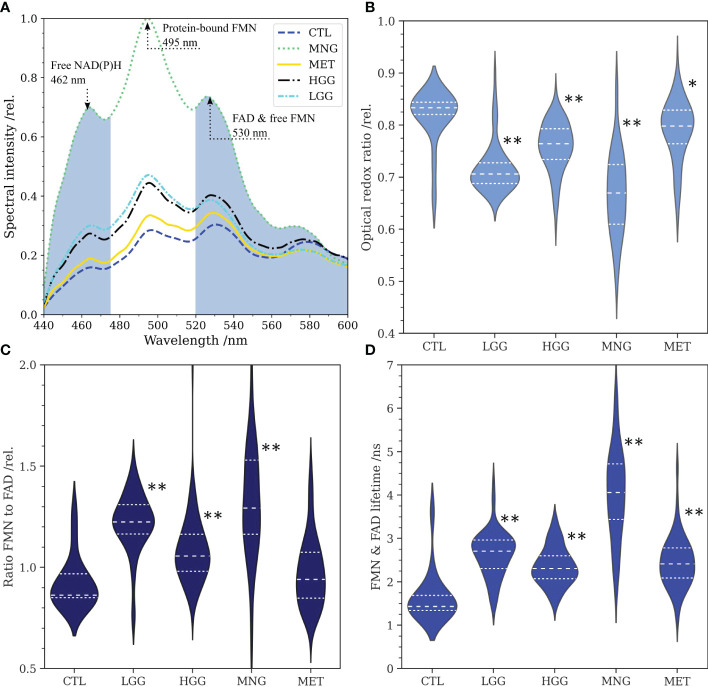
Purpose: Modern techniques for improved tumor visualization have the aim to maximize the extent of resection during brain tumor surgery and thus improve patient prognosis. Optical imaging of autofluorescence is a powerful and non-invasive tool to monitor metabolic changes and transformation in brain tumors. Cellular redox ratios can be retrieved from fluorescence emitted by the coenzymes reduced nicotinamide adenine dinucleotide (phosphate) (NAD(P)H) and flavin adenine dinucleotide (FAD). Recent studies point out that the influence of flavin mononucleotide (FMN) has been underestimated.

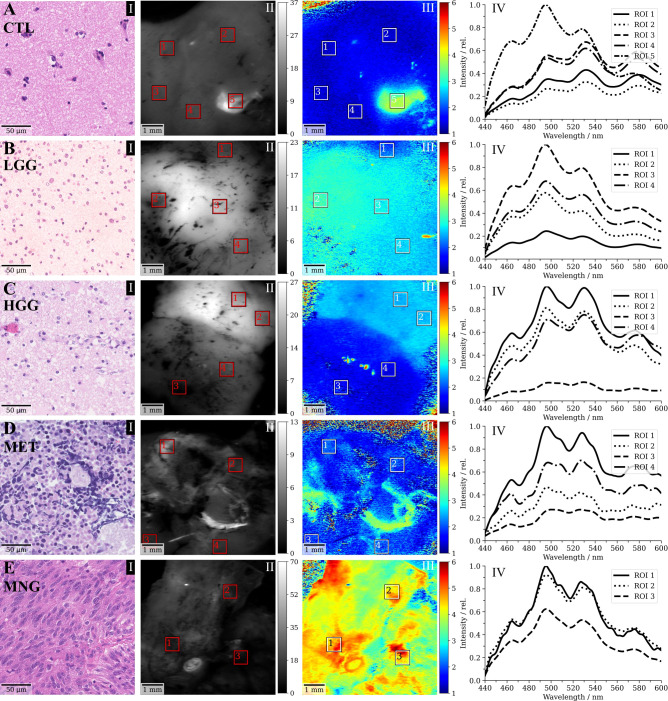
Experimental design: Fluorescence lifetime imaging and fluorescence spectroscopy were performed through a modified surgical microscope. We acquired 361 flavin fluorescence lifetime (500-580 nm) and fluorescence spectra (430-740 nm) data points on freshly excised different brain tumors: low-grade gliomas (N=17), high-grade gliomas (N=42), meningiomas (N=23), metastases (N=26) and specimens from the non-tumorous brain (N=3).

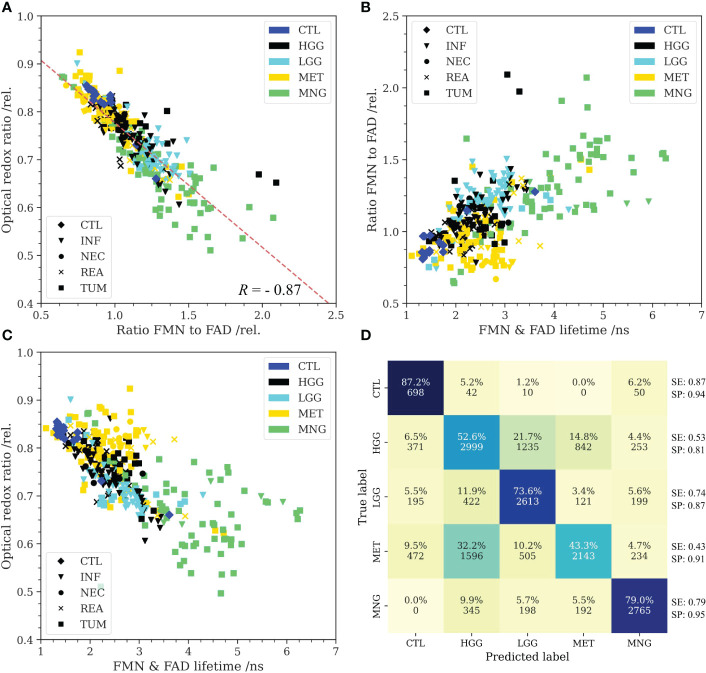
Results: Protein-bound FMN fluorescence in brain tumors did increase with a shift toward a more glycolytic metabolism (R=-0.87). This increased the average flavin fluorescence lifetime in tumor entities with respect to the non-tumorous brain. Further, these metrics were characteristic for the different tumor entities and showed promise for machine learning based brain tumor classification.

Conclusions: Our results shed light on FMN fluorescence in metabolic imaging and outline the potential for supporting the neurosurgeon in visualizing and classifying brain tumor tissue during surgery.

Keywords: flavin mononucleotide; fluorescence guided surgery; fluorescence lifetime imaging; fluorescence spectroscopy; optical redox ratio.


Conflict of interest statement

MW and CH are employees of Carl Zeiss Meditec AG, Oberkochen, Germany. GW received restricted travel grants from NX Development Corp. The remaining authors declare that the research was conducted in the absence of any commercial or financial relationships that could be construed as a potential conflict of interest.

Figures

Figure 1
Figure 1
(A):Average fluorescence spectra of low- and high grade gliomas (LGG, n=71, HGG, n=117), meningiomas (MNG, n=64), brain metastases (MET, n=93) and non-tumorous brain (CTL, n=16) for excitation at 405 nm. The spectral bands for integration of NAD(P)H and FAD fluorescence are colored in grey. Note the peaks at about 462 nm (free NAD(P)H), 495 nm (FMN) and 530 nm (FAD, side peak of FMN). (B): Optical redox ratios obtained from the integration of NAD(P)H and FAD fluorescence in spectra according to equation 1. (C): Ratio of the peaks at 495 nm and 530 nm reflecting the ratio of protein-bound FMN to FAD. (D): Flavin fluorescence lifetime for the spectral range from 500 nm to 580 nm. For (B–D), statistical significant differences of the tumor entities to the control group are indicated through asterisks (* p<0.005, ** p<1e-5).
Figure 2
Figure 2
(A): Higher protein-bound FMN fluorescence with respect to FAD was found to correlate with a reduced optical redox ratio (R = -0.87). All tumor entities predominantly showed reduced redox ratios and higher FMN fluorescence than non-tumorous brain (control, CTL). Only metastases (MET) were found to be heterogeneous and partly overlapped with the non-tumorous brain cluster. (B): The amount of FMN fluorescence plotted as a function of the flavin lifetime (500-580 nm) showed characteristic clusters for the different groups. While MET weren’t easily distinguishable from the CTL group in the redox ratio, flavin lifetime was predominantly increased beyond the lifetimes in non-tumorous brain. (C): Redox ratio plotted as a function of the flavin lifetime implied that the predominant metabolic strategy was characteristic for the different tumor entities. Note the high flavin lifetimes of MNG. Markers further indicate the predominant histopathological tissue classification for (A-C) (INF: tumor infiltrated brain, NEC: necrosis, REA: reactive tissue, TUM: core tumor). (D): Confusion matrix for classification of the different groups with a support vector machine. Input to the model were the optical redox ratio, the FMN/FAD ratio and the flavin lifetime. Autofluorescence was highly characteristic for CTL and meningiomas (MNG). MET were partly misclassified as high-grade gliomas (HGG) implying similarities with respect to the predominant metabolic strategy. Further, classification uncertainty existed between low-grade gliomas (LGG) and HGG. Multi-class sensitivity (SE) and specificity (SP) are given at the end of each row.
Figure 3
Figure 3
Selected clinical cases of (A) non-tumorous control (CTL) tissue, (B) a WHO grade II diffuse astrocytoma (low-grade, LGG), (C) a glioblasatoma (high-grade, HGG), (D) a bronchial carcinoma metastasized to the cerebellum and (E) a meningothelial meningioma (MNG). (I) shows a representative haematoxylin and eosin (H&E) stain of the respective sample, (II) the demodulated fluorescence intensity in mVRMS, (III) the flavin fluorescence lifetime in ns (500-580 nm) and (IV) the spectroscopic measurements corresponding to the regions indicated in III.

References

    1. Xia L, Fang C, Chen G, Sun C. Relationship between the extent of resection and the survival of patients with low-grade gliomas: a systematic review and meta-analysis. BMC Cancer (2018) 18. doi: 10.1186/s12885-017-3909-x - DOI - PMC - PubMed
    1. Hervey-Jumper SL, Berger MS. Role of surgical resection in low- and high-grade gliomas. Curr Treat Opt Neurol (2014) 16(4):284. doi: 10.1007/s11940-014-0284-7 - DOI - PubMed
    1. Albuquerque LAF, Almeida JP, de Macêdo Filho LJM, Joaquim AF, Duffau H. Extent of resection in diffuse low-grade gliomas and the role of tumor molecular signature-a systematic review of the literature. Neurosurg Rev (2020) 7. doi: 10.1007/s10143-020-01362-8 - DOI - PubMed
    1. Coburger J, Wirtz CR, König RW. Impact of extent of resection and recurrent surgery on clinical outcome and overall survival in a consecutive series of 170 patients for glioblastoma in intraoperative high field magnetic resonance imaging. J Neurosurg Sci (2017) 61(3):233–44. doi: 10.23736/S0390-5616.16.03284-7 - DOI - PubMed
    1. Aizer AA, Bi WL, Kandola MS, Lee EQ, Nayak L, Rinne ML. Extent of resection and overall survival for patients with atypical and malignant meningioma. Cancer (2015) 121(24):4376–81. doi: 10.1002/cncr.29639 - DOI - PubMed

LinkOut - more resources