. 2023 Mar 6;3(3):383-394.
doi: 10.1158/2767-9764.CRC-22-0422. eCollection 2023 Mar.

Analysis of N-linked Glycan Alterations in Tissue and Serum Reveals Promising Biomarkers for Intrahepatic Cholangiocarcinoma

Affiliations

Analysis of N-linked Glycan Alterations in Tissue and Serum Reveals Promising Biomarkers for Intrahepatic Cholangiocarcinoma

Shaaron Ochoa-Rios et al. Cancer Res Commun. .

Abstract

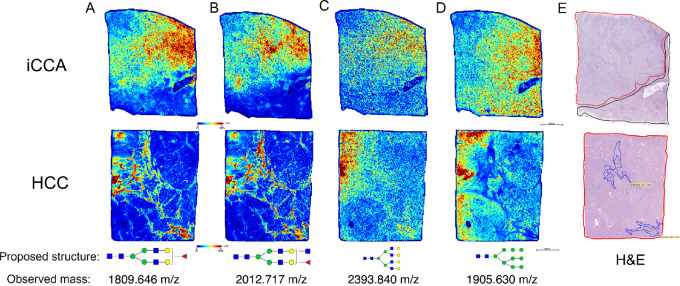
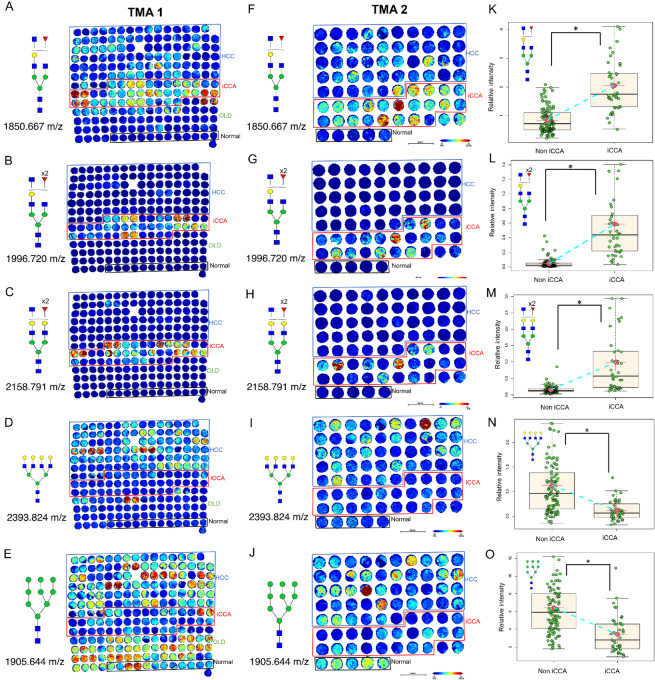
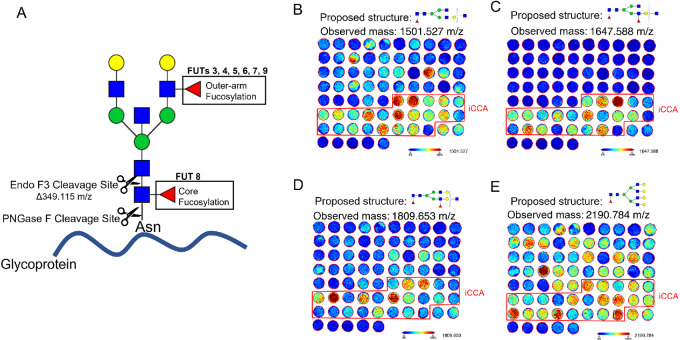
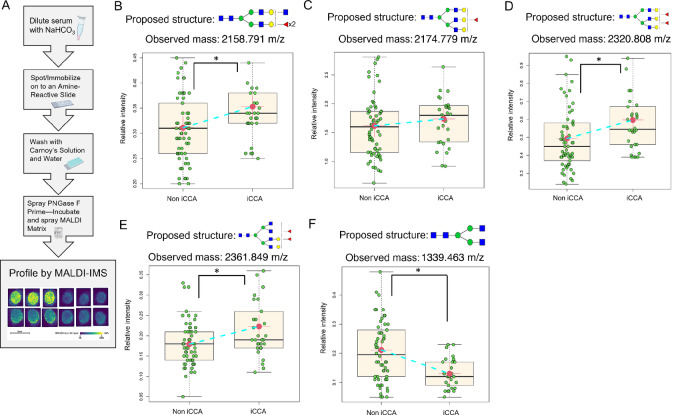
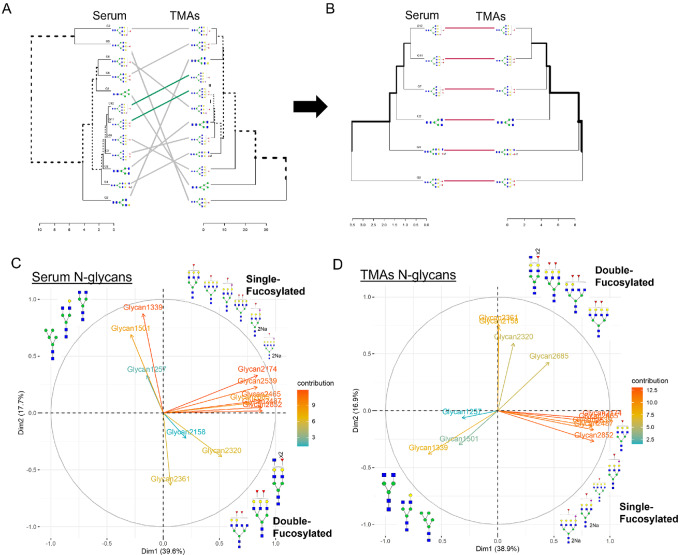
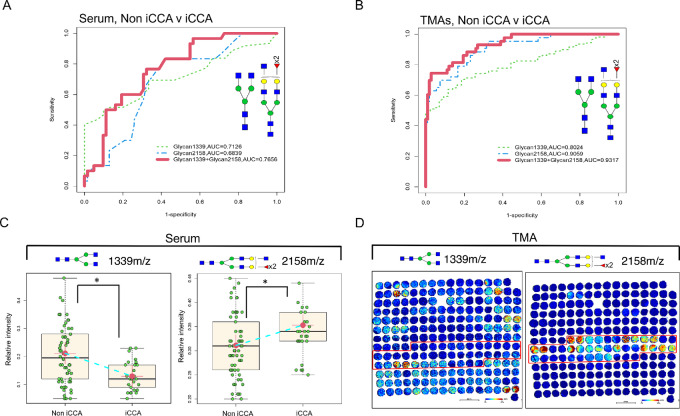
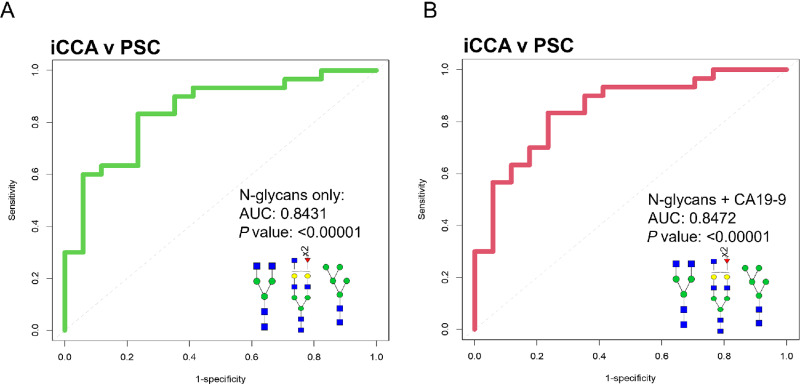
There is an urgent need for the identification of reliable prognostic biomarkers for patients with intrahepatic cholangiocarcinoma (iCCA) and alterations in N-glycosylation have demonstrated an immense potential to be used as diagnostic strategies for many cancers, including hepatocellular carcinoma (HCC). N-glycosylation is one of the most common post-translational modifications known to be altered based on the status of the cell. N-glycan structures on glycoproteins can be modified based on the addition or removal of specific N-glycan residues, some of which have been linked to liver diseases. However, little is known concerning the N-glycan alterations that are associated with iCCA. We characterized the N-glycan modifications quantitatively and qualitatively in three cohorts, consisting of two tissue cohorts: a discovery cohort (n = 104 cases) and a validation cohort (n = 75), and one independent serum cohort consisting of patients with iCCA, HCC, or benign chronic liver disease (n = 67). N-glycan analysis in situ was correlated to tumor regions annotated on histopathology and revealed that bisected fucosylated N-glycan structures were specific to iCCA tumor regions. These same N-glycan modifications were significantly upregulated in iCCA tissue and serum relative to HCC and bile duct disease, including primary sclerosing cholangitis (PSC) (P < 0.0001). N-glycan modifications identified in iCCA tissue and serum were used to generate an algorithm that could be used as a biomarker of iCCA. We demonstrate that this biomarker algorithm quadrupled the sensitivity (at 90% specificity) of iCCA detection as compared with carbohydrate antigen 19-9, the current "gold standard" biomarker of CCA.

Significance: This work elucidates the N-glycan alterations that occur directly in iCCA tissue and utilizes this information to discover serum biomarkers that can be used for the noninvasive detection of iCCA.


Figures

FIGURE 1
FIGURE 1
Bisected and biantennary fucosylated structures are highly expressed in iCCA tumor. Representative images of the relative intensity of biantennary fucosylated N-glycan (1809.646 m/z); (A) bisected fucosylated N-glycan (2012.717 m/z); (B) tetraantennary branched N-glycan (2393.840 m/z); (C) high mannose N-glycan (1905.630 m/z); (D) proposed N-glycan structures at the bottom correspond to the respective m/z value (observed mass). (E) H&E staining. Tumor regions are outlined in red, normal areas are outlined in black, and fibrotic regions are outlined in blue. Intrahepatic Cholangiocarcinoma (iCCA), and Hepatocellular Carcinoma (HCC). For N-glycans, red triangle, fucose; blue square, N-acetylglucosamine; green circles, mannose; yellow circles, galactose.
FIGURE 2
FIGURE 2
Bisected fucosylated N-glycan alterations are specific to patients with iCCA in tissue—analysis in a discovery and validation tissue cohort. Representative images of the relative intensity of bisected/triantennary single fucosylated N-glycan (1850.667 m/z); (A) double fucosylated N-glycan (1996.720 m/z); (B) double fucosylated with a galactose N-glycan (2158.791 m/z); (C) tetraantennary branched N-glycan (2393.824 m/z) N-glycan (D) and high mannose N-glycan (1905.644 m/z) in TMA 1 (E). This TMA includes two cores per patient: 50 HCC, 20 iCCA, and 6 normal hepatic tissue. OLD: other liver diseases. (F–J) same N-glycans as in AE but analyzed in a second independent validation tissue cohort (TMA 2). This TMA includes one core per patient: 45 HCC, 23 iCCA, and 5 normal hepatic tissue. (K–O) relative intensity quantification of both TMAs comparing iCCA (n = 43) v non iCCA (n = 108). Each point in box plots represents a patient. The mass defect used for each m/z value is based on TMA 1 run. The asterisk indicates statistical difference (Mann–Whitney, P < 0.001) and error bars represent the SD. Darker red colors represent a higher intensity for the specific glycan while more blue tones represent less intensity. For N-glycans, red triangle, fucose; blue square, N-acetylglucosamine; green circles, mannose; yellow circles, galactose.
FIGURE 3
FIGURE 3
Bisected core fucosylated N-glycan alterations are specific to patients with iCCA in tissue. (A) Cartoon description of Endo F3 (including mass shift) and PNGase F cleavage sites, and the respective FUTs that catalyze the addition of the fucose residue. Representative images of core fucosylated N-glycans after Endo F3 treatment on TMA2, bisected core fucosylated N-glycan (B) bisected core, and outer-arm fucosylation N-glycan (C) bisected core, and outer-arm fucosylation with two galactose residues N-glycan (D) and tetraantennary core fucosylated N-glycan (E). For N-glycans, red triangle, fucose; blue square, N-acetylglucosamine; green circles, mannose; yellow circles, galactose.
FIGURE 4
FIGURE 4
Fucosylated N-glycans are significantly altered in iCCA serum. (A) Serum N-glycan imaging workflow. Relative intensity quantification of bisected double fucosylated N-glycan (2158.791 m/z); (B) triantennary fucosylated N-glycan (2174.779 m/z); (C) triantennary double fucosylated N-glycan (2320.808 m/z); (D) and tetraantennary double fucosylated N-glycan (2361.849 m/z); (E) biantennary N-glycan (1339.463 m/z); (F) Each point in box plots represents a patient. The asterisk indicates statistical difference (Mann–Whitney, P < 0.001) and error bars represent the SD. Non iCCA n = 62 and iCCA n = 30. The mass defect used for each m/z value is based on TMA 1 run. For N-glycans, red triangle, fucose; blue square, N-acetylglucosamine; green circles, mannose; yellow circles, galactose.
FIGURE 5
FIGURE 5
Profile data clustering reveals N-glycan grouping based on the number of fucose residues in iCCA serum and tissue. Dendrograms representing clustering for 12 N-glycans (A) and 6 N-glycans (B) in serum and TMAs. Glycan (G), G1: 1217, G2: 1339, G3:1501, G4:2158, G5:2174, G6:2320, G7:2631, G8:2465, G9:2487, G10:2539, G11:2685, G12:2852. PCA and their dimension (Dim) of serum (C) and TMAs (D) showing N-glycan clustering based on the number of fucose residues. 2Na (doubly sodiated N-glycan). For N-glycans, red triangle, fucose; blue square, N-acetylglucosamine; green circles, mannose; yellow circles, galactose.
FIGURE 6
FIGURE 6
N-glycans from serum and TMA as promising biomarkers to differentiate iCCA from other liver diseases. (A) ROC curve for serum. Non iCCA n = 62 and iCCA n = 30. (B) ROC curve for TMA, non iCCA n = 108 and iCCA n = 43. For ROC curve labeling: N-glycan 1339 m/z (green-dashed line), N-glycan 2158 m/z (blue-dashed line), and a combination of N-glycans 1339 m/z and 2158 m/z (red-solid line). (C) Relative intensity quantification boxplots of N-glycan 1339 m/z and 2158 m/z in serum, non iCCA n = 62, and iCCA n = 30. (D) Representative images of TMA 1 showing the N-glycan intensity for 1339 m/z and 2158 m/z. The asterisk indicates statistical difference (Mann–Whitney, P < 0.001) and error bars represent the SD. For N-glycans, red triangle, fucose; blue square, N-acetylglucosamine; green circles, mannose; yellow circles, galactose.
FIGURE 7
FIGURE 7
N-glycan combinations as promising biomarkers to differentiate iCCA from PSC. (A) ROC curve classification of a combination of 1339 m/z, 2158 m/z, and 1257 m/z. (B) ROC curve of combination of 1339 m/z, 2158 m/z, 1257 m/z, and CA19-9. For ROC curves: iCCA (n = 30) and PSC (n = 17). For N-glycans, red triangle, fucose; blue square, N-acetylglucosamine; green circles, mannose; yellow circles, galactose.

References

    1. Sandhu DS, Roberts LR. Diagnosis and management of cholangiocarcinoma. Curr Gastroenterol Rep 2008;10:43–52. - PubMed
    1. Sarcognato S, Sacchi D, Fassan M, Fabris L, Cadamuro M, Zanus G, et al. . Cholangiocarcinoma. Pathologica 2021;113:158–69. - PMC - PubMed
    1. Brindley PJ, Bachini M, Ilyas SI, Khan SA, Loukas A, Sirica AE, et al. . Cholangiocarcinoma. Nat Rev Dis Primers 2021;7:65. - PMC - PubMed
    1. Basturk O, Farris AB, Adsay NV. Immunohistology of the pancreas, biliary tract, and liver. In: Dabbs DJ, editor. Diagnostic immunohistochem [Internet]. Elsevier; 2011. page 541–92.
    1. Alsaleh M, Leftley Z, Barbera TA, Sithithaworn P, Khuntikeo N, Loilome W, et al. . Cholangiocarcinoma: a guide for the nonspecialist. Int J Gen Med 2019;12:13–23. - PMC - PubMed

Publication types

MeSH terms