. 2023 Mar 5;12(3):e1440.
doi: 10.1002/cti2.1440. eCollection 2023.

Human EGFRvIII chimeric antigen receptor T cells demonstrate favorable safety profile and curative responses in orthotopic glioblastoma

Affiliations

Human EGFRvIII chimeric antigen receptor T cells demonstrate favorable safety profile and curative responses in orthotopic glioblastoma

Rebecca C Abbott et al. Clin Transl Immunology. .

Abstract

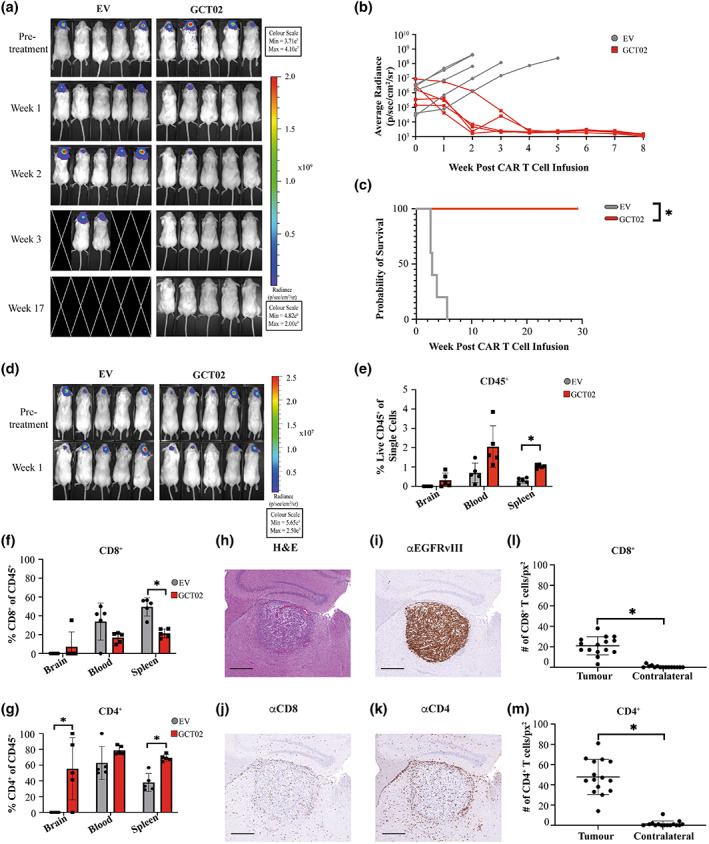
Objectives: Glioblastoma is a highly aggressive and fatal brain malignancy, and effective targeted therapies are required. The combination of standard treatments including surgery, chemotherapy and radiotherapy is not curative. Chimeric antigen receptor (CAR) T cells are known to cross the blood-brain barrier, mediating antitumor responses. A tumor-expressed deletion mutant of the epidermal growth factor receptor (EGFRvIII) is a robust CAR T cell target in glioblastoma. Here, we show our de novo generated, high-affinity EGFRvIII-specific CAR; GCT02, demonstrating curative efficacy in human orthotopic glioblastoma models.

Methods: The GCT02 binding epitope was predicted using Deep Mutational Scanning (DMS). GCT02 CAR T cell cytotoxicity was investigated in three glioblastoma models in vitro using the IncuCyte platform, and cytokine secretion with a cytometric bead array. GCT02 in vivo functionality was demonstrated in two NSG orthotopic glioblastoma models. The specificity profile was generated by measuring T cell degranulation in response to coculture with primary human healthy cells.

Results: The GCT02 binding location was predicted to be located at a shared region of EGFR and EGFRvIII; however, the in vitro functionality remained exquisitely EGFRvIII specific. A single CAR T cell infusion generated curative responses in two orthotopic models of human glioblastoma in NSG mice. The safety analysis further validated the specificity of GCT02 for mutant-expressing cells.

Conclusion: This study demonstrates the preclinical functionality of a highly specific CAR targeting EGFRvIII on human cells. This CAR could be an effective treatment for glioblastoma and warrants future clinical investigation.

Keywords: CAR T cells; EGFRvIII; chimeric antigen receptor; glioblastoma; immunotherapy.


Conflict of interest statement

RCA, RSC and MRJ are listed as inventors on a patent filed with the GCT02 CAR presented here.

Figures

Figure 1
Figure 1
Predicted binding site of GCT02 as determined by Deep Mutational Scanning (DMS). The BW5147 cell line was transduced with the epitope mapping library, labelled with either Cetuximab or GCT02 and sorted for binding or non‐binding. (a) Sequence‐Function Maps of unsorted cells compared by Plasmid DNA, Cetuximab stained cells (nonbinding versus binding) and GCT02 stained (non‐binding versus binding) cells. Variant frequency in each cell population was used to calculate Log‐Ratio scores that are used to colour the sequence‐function maps. A score of 1 indicates an approximate 10‐fold enrichment of that variant in the nonbinding population. Positive enrichment scores are coloured red (nonbinding variants), while negative enrichment scores are coloured blue (binding variants). A subset of the 150 positions targeted by DMS are shown here. The full sequence‐function maps can be found in Supplementary figure 2. Lines within each square represent standard error bars, with smaller bars indicating higher confidence. Squares containing a circle show the wild‐type sequence. Grey squares denote no data. Alphafold model of EGFRvIII protein coloured by binding scores of (b) Cetuximab and (c) GCT02. The Log Ratio enrichment scores of Alanine, Serine, Threonine, Asparagine, Glutamine, Aspartic Acid, Glutamic Acid, Lysine, Arginine and Histidine variants were aggregated by position. The sum of Log Ratio scores was then used to replace the Cα B‐factor of each position in an AlphaFold model of EGFRvIII. Residues that were not targeted in the DMS screen were set to 0. The surface was coloured by B‐factor on a blue‐white‐red spectrum and scaled such that blue and red extended equally into the negative and positive scale and set to maximise the contrast of each dataset: Cetuximab ± 12.69 and GCT02 ± 22.81. Red indicates variants that are enriched in the non‐binding population. Blue indicates variants that are enriched in the binding population. The experiment was performed with three independent BW5147 libraries, each in triplicate.
Figure 2
Figure 2
GCT02 binding domain can detect EGFRvIII expression, and the CAR successfully expressed on primary human T cells. The GCT02 monoclonal IgG antibody was used to label three human glioma cell lines (a) U87, (b) U118 and (c) U251 to determine non‐specific binding by flow cytometry. The reagent successfully detected EGFRvIII on (d) U87‐EGFRvIII, (e) U118‐EGFRvIII and (f) U251‐EGFRvIII. Representative of at least three experiments. (g) Schematic representation of the second generation GCT02 and 2173 CAR constructs. Detection of the GCT02 (αMYC‐tag) and 2173 (αFLAG‐tag) CAR 6 day post‐transduction on the surface of (h) CD8+ (i) CD4+ primary human T cells by flow cytometry. A representative plot from one human donor is shown. Average transduction efficiencies of the GCT02 and 2173 CARs into human (j) CD8+ (k) CD4+ T cells as determined by MYC/FLAG tag labelling. Each symbol represents one individual transduction of one of four individual human donors. Shown is mean ± SD.
Figure 3
Figure 3
GCT02 CAR T cells demonstrate cytotoxic and cytokine‐secreting equivalence to the 2173 CAR. EGFRvIII‐specific CAR T cells were cocultured with three human glioblastoma parental cell lines (a) U87, (b) U118 and (c) U251 and the three EGFRvIII‐expressing variants (d) U87‐EGFRvIII, (e) U118‐EGFRvIII and (f) U251‐EGFRvIII. Cytotoxicity was measured kinetically using the IncuCyte platform over 24 h, and cell death indicated by uptake of propidium iodide. Shown is mean ± SD of triplicate measures, from one representative donor from three independent human donors. Statistical analysis by the unpaired t‐test, * P‐value < 0.05. CD8+ T cell secretion of (g) IFN‐γ, (h) IL‐2 and (i) TNF‐α. CD4+ T cell secretion of (j) IFN‐γ, (k) IL‐2 and (l) TNF‐α. (m) CD8+ and (n) CD4+ T cell secretion of IL‐6. All cytokine secretion was measured by cytokine bead array after an 18‐h coculture and T cell stimulation provided through αCD3/CD28 coated Dynabeads®. (g–l) The mean ± SEM from three independent human donors. (m,n) The mean ± SD from one human donor measured in triplicate. The dashed line in IL‐2 secretion indicates approximate background level of IL‐2 from cell culture medium. Statistical analysis by two‐way ANOVA, * P‐value < 0.05.
Figure 4
Figure 4
GCT02 CAR T cells mediate clearance and engraft in tumor‐bearing mice. (a) Schematic representation of in vivo intracranial experiments. EGFRvIII‐positive tumor cells were implanted into mice and after 1 week, tumor size was determined by bioluminescence imaging and mice were allocated to treatment groups. Mice received one infusion of CAR T cells via the tail vein and tumor size was monitored weekly. Pre‐infusion the (b) CD8+ and (c) CD4+ CAR T cells were phenotypically profiled by flow cytometry. (d) Bioluminescence images of mice bearing U251‐EGFRvIII tumors pre and up to 7‐week post‐CAR T cell treatment. The experiment was performed once with N = 5 mice in EV group, eight mice in GCT02 group. (e) Quantification of the tumors in mice shown in d. Each line represents a single mouse. At the experimental endpoint, the spleens of the mice were harvested and analysed by flow cytometry to determine the percentage of (f) CD45+ cells, (g) CD8+ and (h) CD4+ T cells. Shown is mean ± SD, each symbol is representative of one mouse. Statistical analysis by the unpaired t‐test, * P‐value < 0.05. Phenotypic analysis was performed on (i) CD8+ and (j) CD4+ T cells from the spleen 7‐week post‐infusion in the 5 EV‐treated mice and 8 GCT02‐treated mice. Shown is mean ± SD.
Figure 5
Figure 5
GCT02 CAR T cells infiltrate and clear U87‐EGFRvIII intracranial tumors. (a) Bioluminescence images of mice bearing U87‐EGFRvIII tumors pre and post CAR T cell treatment. This experiment was performed once, with the same human donor used in the experiment shown in Figure 4. N = 5 mice per group. (b) Quantification of the tumors in mice shown in a, where each line represents a single mouse. (c) Kaplan–Meier survival curve of the mice is shown in a and b. * P‐value < 0.05. (d) Bioluminescence images of mice bearing U87‐EGFRvIII tumors pre‐ and 1 week post‐CAR T cell treatment, using an independent human donor. This timed cull experiment was performed once with N = 5 mice per group. Flow cytometric analysis of brain, blood and spleen of T cell treated U87‐EGFRvIII treated mice identifying (e) CD45+ (f) CD8+ and (g) CD4+ human T cells. Each symbol represents a single mouse, shown as mean ± SD. Statistical analysis by the unpaired t‐test, * P‐value < 0.05. Brain sections from a cohort of U87‐EGFRvIII tumor bearing mice were stained 1 week post‐CAR T cell treatment with (h) Haematoxylin and Eosin, and antibodies specific for (i) EGFRvIII, (j) CD8 and (k) CD4. Images in h–k are also shown in Supplementary figure 7a . Scale bar is 500 μm and applies to all images. The infiltration of (l) CD8+ and (m) CD4+ human T cells was quantified in the tumor‐bearing and contralateral hemispheres. Shown is total mean ± SD, each symbol represents the numbers of T cell per square pixel, from five selected regions from three independent mice. Regions as demonstrated in Supplementary figure 8. Statistical analysis by the unpaired t‐test, *P‐value < 0.05.
Figure 6
Figure 6
GCT02 CAR T cells are unreactive to primary EGFR‐expressing cells. The expression of EGFR was determined by flow cytometry via labelling with Cetuximab on (a) the human glioma cell line U118 and U118‐EGFRvIII (b) three donors of primary human keratinocytes and (c) primary human astrocytes. Values on the right of the plot denote the geometric mean fluorescence intensity. This experiment was performed once. (d) The degranulation of human T cells was measured by the exposure of CD107a after 4‐h coculture with different stimuli. Shown is mean ± SEM, each symbol represents the mean of the triplicate measures from one of three human donors. Statistical analysis by two‐way ANOVA, * P‐value < 0.05.

References

    1. Miller KD, Ostrom QT, Kruchko C et al. Brain and other central nervous system tumor statistics, 2021. CA Cancer J Clin 2021; 71: 381–406. - PubMed
    1. Brain and Other Central Nervous System Cancers. Canberra: Australian Institute of Health and Welfare; 2017:80.
    1. Stupp R, Mason WP, van den Bent MJ et al. Radiotherapy plus concomitant and adjuvant temozolomide for glioblastoma. N Engl J Med 2005; 352: 987–996. - PubMed
    1. Daneman R, Prat A. The blood‐brain barrier. Cold Spring Harb Perspect Biol 2015; 7: a020412. - PMC - PubMed
    1. van Tellingen O, Yetkin‐Arik B, de Gooijer MC, Wesseling P, Wurdinger T, de Vries HE. Overcoming the blood–brain tumor barrier for effective glioblastoma treatment. Drug Resist Updat 2015; 19: 1–12. - PubMed