. 2023 Feb 20:14:1118751.
doi: 10.3389/fendo.2023.1118751. eCollection 2023.

Vitamin A regulates tissue-specific organ remodeling in diet-induced obesity independent of mitochondrial function

Affiliations

Vitamin A regulates tissue-specific organ remodeling in diet-induced obesity independent of mitochondrial function

Ivanna Shymotiuk et al. Front Endocrinol (Lausanne). .

Abstract

Background: Perturbed mitochondrial energetics and vitamin A (VitA) metabolism are associated with the pathogenesis of diet-induced obesity (DIO) and type 2 diabetes (T2D).

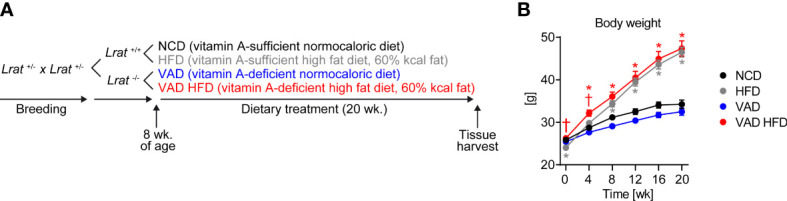
Methods: To test the hypothesis that VitA regulates tissue-specific mitochondrial energetics and adverse organ remodeling in DIO, we utilized a murine model of impaired VitA availability and high fat diet (HFD) feeding. Mitochondrial respiratory capacity and organ remodeling were assessed in liver, skeletal muscle, and kidney tissue, which are organs affected by T2D-associated complications and are critical for the pathogenesis of T2D.

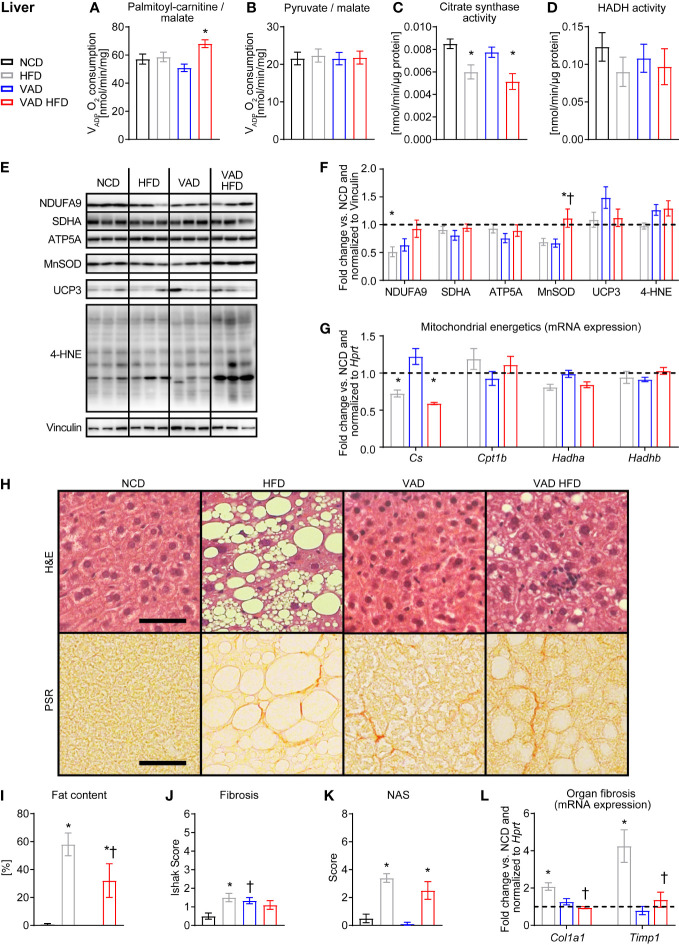
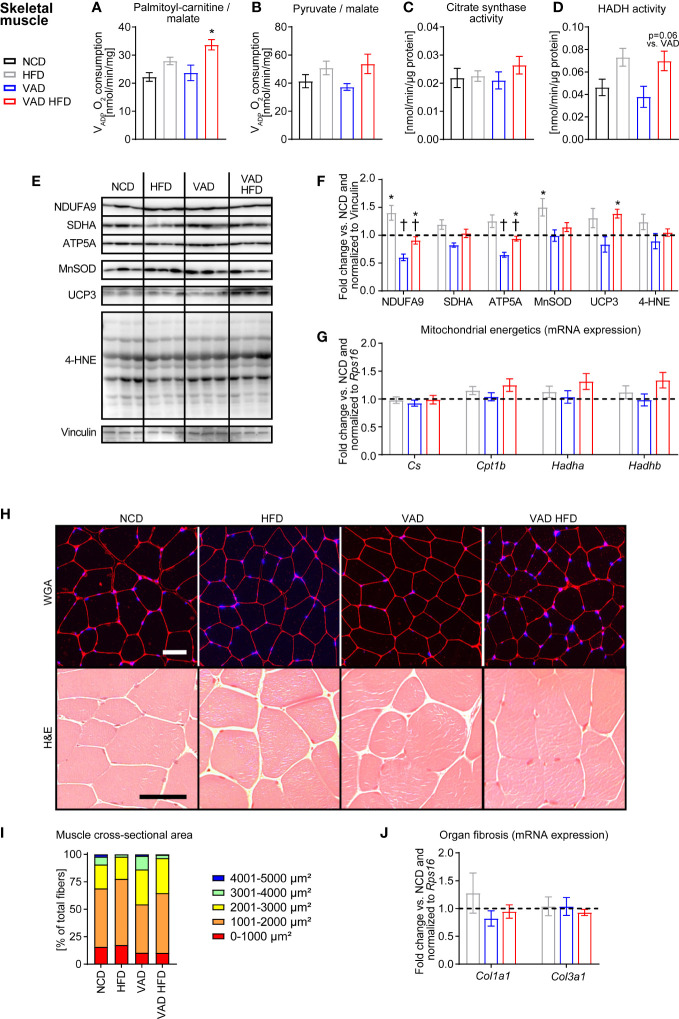
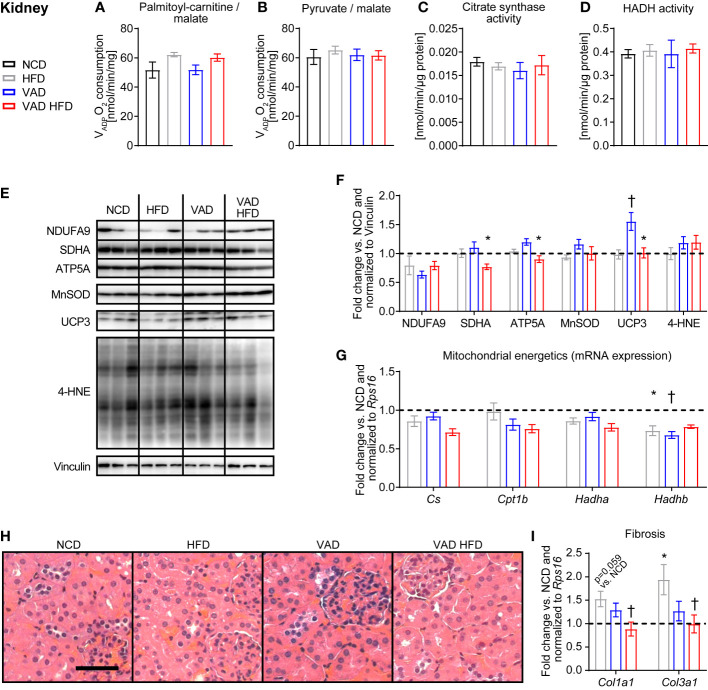
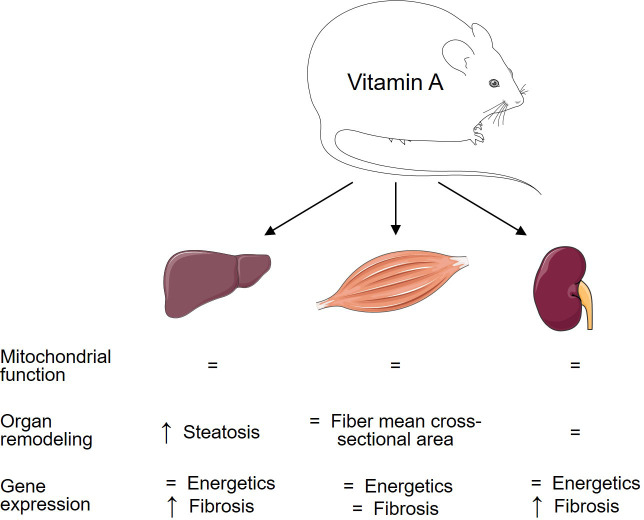
Results: In liver, VitA had no impact on maximal ADP-stimulated mitochondrial respiratory capacity (VADP) following HFD feeding with palmitoyl-carnitine and pyruvate each combined with malate as substrates. Interestingly, histopathological and gene expression analyses revealed that VitA mediates steatosis and adverse remodeling in DIO. In skeletal muscle, VitA did not affect VADP following HFD feeding. No morphological differences were detected between groups. In kidney, VADP was not different between groups with both combinations of substrates and VitA transduced the pro-fibrotic transcriptional response following HFD feeding.

Conclusion: The present study identifies an unexpected and tissue-specific role for VitA in DIO that regulates the pro-fibrotic transcriptional response and that results in organ damage independent of changes in mitochondrial energetics.

Keywords: diet-induced obesity; kidney; liver; mitochondria; skeletal muscle; type 2 diabetes; vitamin A.


Conflict of interest statement

The authors declare that the research was conducted in the absence of any commercial or financial relationships that could be construed as a potential conflict of interest.

Figures

Figure 1
Figure 1
Experimental paradigm and increase in body weight independent of VitA following HFD feeding. (A) Mice with homozygous Lrat germline deletion (Lrat -/-) and wildtype controls (Lrat +/+) were obtained by breeding mice with heterozygous Lrat germline deletion (Lrat +/-). Dietary treatment started at 8 weeks of age for a duration of 20 weeks total. (B) Body weight data are reported as mean values ± SE and represent a subgroup of a previously published animal cohort (14). Two-way ANOVA was performed to analyze differences by HFD feeding and VitA. Results of post-hoc analyses for each comparison are summarized by symbols as defined: # p<0.05 for HFD feeding, $ p<0.05 for VitA, and & p<0.05 for the interaction between HFD feeding and VitA. Body weight following 0 ($, &), 4 (#, &), 8 (#, &), 12 (#), 16 (#), and 20 (#) weeks of dietary feeding (n=17-18/group). *p < 0.05 vs. normocaloric diet same VitA availability, † p<0.05 vs. VitA sufficiency same caloric diet.
Figure 2
Figure 2
VitA modulates steatosis and fibrosis in liver tissue in DIO independent of mitochondrial function. Data are reported as mean values ± SE. Two-way ANOVA was performed to analyze differences by HFD feeding and VitA. Results of post-hoc analyses for each comparison are summarized by symbols as defined: # p<0.05 for HFD feeding, $ p<0.05 for VitA, and & p<0.05 for the interaction between HFD feeding and VitA. VADP of isolated liver mitochondria with (A) palmitoyl-carnitine (#, &) and (B) pyruvate each combined with malate as substrates (n=7-8). (C) Citrate synthase (#) and (D) HADH activity in liver tissue (n=6-8). (E) Representative immunoblots and (F) densitometric analysis of NDUFA9 (&), SDHA, ATP5A, MnSOD (&),UCP3, and 4-HNE ($) normalized to Vinculin. Data are presented as fold change relative to NCD (assigned as 1.0; dashed line), n=6. (G) mRNA expression of transcripts involved in mitochondrial energetics (Cs: #, &; Hadha: #). Data are presented as fold change relative to NCD and normalized to Hprt (assigned as 1.0; dashed line), n=7-8. (H) Representative H&E and PSR stains of liver sections (scale bars: 50 μm each). Quantification of (I) fat content (#), (J) fibrosis (&), and (K) NAFLD activity scores (NAS, #), n=9-10. (L) mRNA expression of transcripts involved in organ fibrosis (Col1a1: #, $, &; Timp1: #, $, &). Data are presented as fold change relative to NCD and normalized to Hprt (assigned as 1.0; dashed line), n=7-8. *p < 0.05 vs. normocaloric diet same VitA availability, † p<0.05 vs. VitA sufficiency same caloric diet.
Figure 3
Figure 3
VitA does not impair skeletal muscle mitochondrial function and morphological structure in DIO. Data are reported as mean values ± SE. Two-way ANOVA was performed to analyze differences by HFD feeding and VitA. Results of post-hoc analyses for each comparison are summarized by symbols as defined: # p<0.05 for HFD feeding and $ p<0.05 for VitA. No significant effect for the interaction between HFD feeding and VitA was determined. VADP of isolated skeletal muscle mitochondria with (A) palmitoyl-carnitine (#) and (B) pyruvate (#) each combined with malate as substrates (n=6-8). (C) Citrate synthase and (D) HADH (#) activity in skeletal muscle (n=7-8). (E) Representative immunoblots and (F) densitometric analysis of NDUFA9 (#, $), SDHA (#, $), ATP5A (#, $), MnSOD (#),UCP3 (#), and 4-HNE normalized to Vinculin. Data are presented as fold change relative to NCD (assigned as 1.0; dashed line), n=6. (G) mRNA expression of transcripts involved in mitochondrial energetics presented as fold change relative to NCD and normalized to Rps16 (assigned as 1.0; dashed line), n=8. (H) Representative WGA and H&E stains of skeletal muscle sections (scale bars: 50 μm each). (I) Mean cross-sectional area of skeletal muscle fibers presented as percentage of total fibers (# for 4001-5000 µm², n=5-6). (J) mRNA expression of transcripts involved in organ fibrosis presented as fold change relative to NCD and normalized to Rps16 (assigned as 1.0; dashed line), n=8. *p < 0.05 vs. normocaloric diet same VitA availability, † p<0.05 vs. VitA sufficiency same caloric diet.
Figure 4
Figure 4
VitA mediates the pro-fibrotic transcriptional response in kidney tissue following HFD feeding independent of mitochondrial energetics. Data are reported as mean values ± SE. Two-way ANOVA was performed to analyze differences by HFD feeding and VitA. Results of post-hoc analyses for each comparison are summarized by symbols as defined: # p<0.05 for HFD feeding, $ p<0.05 for VitA, and & p<0.05 for the interaction between HFD feeding and VitA. VADP of isolated kidney mitochondria with (A) palmitoyl-carnitine (#) and (B) pyruvate each combined with malate as substrates (n=6-8). (C) Citrate synthase and (D) HADH activity in kidney tissue (n=7-8). (E) Representative immunoblots and (F) densitometric analysis of NDUFA, SDHA (&), ATP5A (&), MnSOD, UCP3 (#, $, &), and 4-HNE normalized to Vinculin. Data are presented as fold change relative to NCD (assigned as 1.0; dashed line), n=6. (G) mRNA expression of transcripts involved in mitochondrial energetics (Cs: #; Cpt1b: $; Hadha: #; Hadhb: $, &). Data are presented as fold change relative to NCD and normalized to Rps16 (assigned as 1.0; dashed line), n=8. (H) Representative H&E stains of kidney sections (scale bar: 50 μm). (I) mRNA expression of transcripts involved in organ fibrosis (Col1a1: &; Col3a1: &). Data are presented as fold change relative to NCD and normalized to Rps16 (assigned as 1.0; dashed line), n=8. *p < 0.05 vs. normocaloric diet same VitA availability, † p<0.05 vs. VitA sufficiency same caloric diet.
Figure 5
Figure 5
Tissue-specific impact of VitA on mitochondrial energetics and tissue remodeling in DIO. Changes in the HFD relative to VAD HFD group are summarized to visualize the relationship between VitA content and tissue responses to HFD feeding.

References

    1. Sivitz WI, Yorek MA. Mitochondrial dysfunction in diabetes: From molecular mechanisms to functional significance and therapeutic opportunities. Antioxid Redox Signal (2010) 12(4):537–77. doi: 10.1089/ars.2009.2531 - DOI - PMC - PubMed
    1. Sangwung P, Petersen KF, Shulman GI, Knowles JW. Mitochondrial dysfunction, insulin resistance, and potential genetic implications. Endocrinology (2020) 161(4):1–10 doi: 10.1210/endocr/bqaa017 - DOI - PMC - PubMed
    1. Petersen KF, Befroy D, Dufour S, Dziura J, Ariyan C, Rothman DL, et al. . Mitochondrial dysfunction in the elderly: Possible role in insulin resistance. Science (2003) 300(5622):1140–2. doi: 10.1126/science.1082889 - DOI - PMC - PubMed
    1. Kelley DE, He J, Menshikova EV, Ritov VB. Dysfunction of mitochondria in human skeletal muscle in type 2 diabetes. Diabetes (2002) 51(10):2944–50. doi: 10.2337/diabetes.51.10.2944 - DOI - PubMed
    1. Kim JA, Wei Y, Sowers JR. Role of mitochondrial dysfunction in insulin resistance. Circ Res (2008) 102(4):401–14. doi: 10.1161/CIRCRESAHA.107.165472 - DOI - PMC - PubMed

Publication types