. 2023 Feb 20:14:1083333.
doi: 10.3389/fimmu.2023.1083333. eCollection 2023.

A novel oral formulation of the melanocortin-1 receptor agonist PL8177 resolves inflammation in preclinical studies of inflammatory bowel disease and is gut restricted in rats, dogs, and humans

Affiliations

A novel oral formulation of the melanocortin-1 receptor agonist PL8177 resolves inflammation in preclinical studies of inflammatory bowel disease and is gut restricted in rats, dogs, and humans

John Dodd et al. Front Immunol. .

Abstract

Introduction: PL8177 is a potent and selective agonist of the melanocortin 1 receptor (MC1R). PL8177 has shown efficacy in reversing intestinal inflammation in a cannulated rat ulcerative colitis model. To facilitate oral delivery, a novel, polymer-encapsulated formulation of PL8177 was developed. This formulation was tested in 2 rat ulcerative colitis models and evaluated for distribution, in vivo, in rats, dogs, and humans.

Methods: The rat models of colitis were induced by treatment with 2,4-dinitrobenzenesulfonic acid or dextran sulfate sodium. Single nuclei RNA sequencing of colon tissues was performed to characterize the mechanism of action. The distribution and concentration of PL8177 and the main metabolite within the GI tract after a single oral dose of PL8177 was investigated in rats and dogs. A phase 0 clinical study using a single microdose (70 µg) of [14C]-labeled PL8177 investigated the release of PL8177 in the colon of healthy men after oral administration.

Results: Rats treated with 50 µg oral PL8177 demonstrated significantly lower macroscopic colon damage scores and improvement in colon weight, stool consistency, and fecal occult blood vs the vehicle without active drug. Histopathology analysis resulted in the maintenance of intact colon structure and barrier, reduced immune cell infiltration, and increased enterocytes with PL8177 treatment. Transcriptome data show that oral PL8177 50 µg treatment causes relative cell populations and key gene expressions levels to move closer to healthy controls. Compared with vehicle, treated colon samples show negative enrichment of immune marker genes and diverse immune-related pathways. In rats and dogs, orally administered PL8177 was detected at higher amounts in the colon vs upper GI tract. [14C]-PL8177 and the main metabolite were detected in the feces but not in the plasma and urine in humans. This suggests that the parent drug [14C]-PL8177 was released from the polymer formulation and metabolized within the GI tract, where it would be expected to exert its effect.

Conclusion: Collectively, these findings support further research into the oral formulation of PL8177 as a possible therapeutic for GI inflammatory diseases in humans.

Keywords: PL8177; alpha-melanocyte–stimulating hormone; inflammation; inflammatory bowel disease; melanocortin; melanocortin 1 receptor; pharmacokinetics.


Conflict of interest statement

JD, RJ, CS, AO, PD, and PK are employees of and own stock in Palatin Technologies, Inc. MM and KB were employees of Palatin Technologies during the studies. AR is an employee of ICON plc (formerly PRA Health Sciences), which was the clinical research organization that ran the human clinical trial described in the paper for Palatin Technologies, Inc. The authors declare that this study received funding from Palatin Technologies, Inc. Palatin Technologies, Inc. participated in the study design, data collection, data analysis and interpretation, decision to publish, preparation, and final approval of the manuscript.

Figures

Figure 1
Figure 1
Design of the DSS-induced rat colitis study. BID, twice daily; DSS, dextran sulfate sodium, LC/MS DIA, data-independent acquisition tandem mass spectrometry QC, quality control; QD, once daily; RNA-seq, RNA sequencing; TA, test agent.
Figure 2
Figure 2
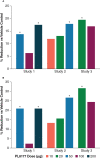
Percentage differences from vehicle across PL8177 doses in DNBS colitis–induced rats: (A) macroscopic damage score and (B) ulcer/inflammatory score. *P<0.05, treated vs vehicle control; 1-way ANOVA followed by Dunnett’s test. ANOVA, analysis of variance; DNBS, 2,4-dinitrobenzene sulfonic acid.
Figure 3
Figure 3
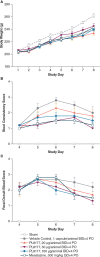
Changes in (A) body weight, (B) stool consistency, and (C) fecal occult blood in DSS colitis–induced rats. Note: all animals, except those in sham group, received 5% DSS in the drinking water for 3 days, from day 1 to day 3, and then changed to normal drinking water for the following 5 days. Tissue harvest occurred on day 8. Data are mean (SEM). BID, twice daily; DSS, dextran sulfate sodium; PO, by mouth; QD, once daily.
Figure 4
Figure 4
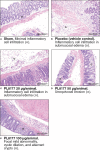
Representative colon histologic sections of DSS colitis–induced rats. Sham (A) is no challenge and no treatment. Placebo/vehicle control (B) is no treatment but DSS challenge. (C-E) are DSS challenge and treatment with PL8177. DSS, dextran sulfate sodium.
Figure 5
Figure 5
Total colitis index for DSS colitis–induced rat model. Data shown are mean ( ± SEM) and individual data points. *P<0.05. **P<0.01 one-way ANOVA followed by Dunnett’s test. ANOVA, analysis of variance, DSS, dextran sulfate sodium.
Figure 6
Figure 6
Representative colon immunohistochemistry for K18 sections of DSS colitis-induced rats. Sham (A) is no challenge and no treatment. Placebo/vehicle control (B) is no treatment but DSS challenge. (C) is DSS challenge and treatment with PL8177 (100 µg). (D) is DSS challenge and treatment with mesalazine. (E) Quantification of positive K18 cells in colon crypts versus total crypt cells. Notes: material was limited for sham staining resulting in 2 colon tissues. Bar chart shows mean, SEM, and data points. DSS, dextran sulfate sodium; K18, cytokeratin 18.
Figure 7
Figure 7
Single nuclei RNA-seq analysis reveals cellular composition of DSS colitis–induced rat colon tissue in sham, placebo, and PL8177 50 µg samples. (A) UMAP plots display cell-type clusters derived from all the treatment groups. Each dot represents a cell. Cells in PL8177 50 µg samples are shown in violet, placebo in red, and sham in green. (B) UMAP visualization of cells after annotating cell clusters. Expression of cell-type marker genes was used to annotate each cluster. Colors of the dots represent the cluster to which the cells belong. DSS, dextran sulfate sodium; EE; enteroendocrine; EEP, enteroendocrine progenitor; SM, smooth muscle; UMAP, Uniform Manifold Approximation and Projection.
Figure 8
Figure 8
Relative cell type percentage in different treatment groups of DSS colitis–induced rats. PL8177 50 µg treated samples show a relative increase in the number of enterocytes and decrease in T cells compared to placebo. DSS, dextran sulfate sodium; EE, enteroendocrine; EEP, enteroendocrine progenitor; SM, smooth muscle.
Figure 9
Figure 9
Genes differentially expressed in T cells and enterocyte cells of sham and PL8177 50 µg DSS colitis–induced rats as compared to placebo group. (A) Differentially expressed genes in T cells. Shown in red are genes with log2FC >1.5 and P<0.00001. Gene names in red are the top common differentially expressed genes in sham and PL8177 50 µg T cells. (B) Differentially expressed genes in enterocytes. Shown in red are genes with log2FC >0.5 and P<0.001. The gene name in red is the top common differentially expressed gene in sham and PL8177 50 µg enterocyte cells.
Figure 10
Figure 10
Enrichment analysis for differentially expressed T cell cluster genes. Dot plot shows the top 10 significant pathways enriched in T cells of sham (A) and PL8177 50 µg (B) DSS colitis–induced rats. Differentially expressed genes in sham and PL8177 50 µg as compared to placebo were used for enrichment analysis. Dot size indicates the gene ratio (enriched genes/total number of genes). Dot color indicates the adjusted P value for enrichment analysis. Count indicates number of enriched genes in each pathway. DSS, dextran sulfate sodium; NF-κB, nuclear factor kappa B; TNF-α, tumor necrosis factor alpha.
Figure 11
Figure 11
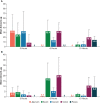
Mean amount of PL8177 (A) and its main active metabolite (B) in the GI tract of rats at 3, 6, and 10 hours postdose after a single oral 550-µg dose. GI, gastrointestinal.
Figure 12
Figure 12
Mean concentration of PL8177 and the main metabolite in the GI tract of dogs at 6 hours after a single oral 20-mg dose. Levels of main metabolite in stomach were below the limit of quantification in all samples. GI, gastrointestinal.
Figure 13
Figure 13
Total radioactivity in feces excreted by healthy humans across cohorts from the phase 0 clinical study. Cohort 1 = [14C]-PL8177 + laxative 5 h postdose; Cohort 2 = [14C]-PL8177 + laxative 8 h postdose; Cohort 3 = [14C]-PL8177 + laxative 11 h postdose; Cohort 4 = [14C]-PL8177 + laxative 14 h postdose; Cohort 5 = [14C]-PL8177 + laxative 17 h postdose; and Cohort 6 = [14C]-PL8177 without laxative.

References

    1. Ahmed TJ, Montero-Melendez T, Perretti M, Pitzalis C. Curbing inflammation through endogenous pathways: Focus on melanocortin peptides. Int J Inflam (2013) 2013:985815. doi: 10.1155/2013/985815 - DOI - PMC - PubMed
    1. Wang W, Guo DY, Lin YJ, Tao YX. Melanocortin regulation of inflammation. Front Endocrinol (Lausanne) (2019) 10:683. doi: 10.3389/fendo.2019.00683 - DOI - PMC - PubMed
    1. Catania A, Lonati C, Sordi A, Carlin A, Leonardi P, Gatti S. The melanocortin system in control of inflammation. ScientificWorldJournal (2010) 10:1840–53. doi: 10.1100/tsw.2010.173 - DOI - PMC - PubMed
    1. Manna SK, Aggarwal BB. Alpha-melanocyte-stimulating hormone inhibits the nuclear transcription factor NF-kappa b activation induced by various inflammatory agents. J Immunol (1998) 161(6):2873–80. - PubMed
    1. Ichiyama T, Sakai T, Catania A, Barsh GS, Furukawa S, Lipton JM. Inhibition of peripheral NF-kappaB activation by central action of alpha-melanocyte-stimulating hormone. J Neuroimmunol (1999) 99(2):211–7. doi: 10.1016/s0165-5728(99)00122-8 - DOI - PubMed