. 2023 Mar 21;12(6):e028234.
doi: 10.1161/JAHA.122.028234. Epub 2023 Mar 9.

Serum Pro-N-Cadherin Is a Marker of Subclinical Heart Failure in the General Population

Affiliations

Serum Pro-N-Cadherin Is a Marker of Subclinical Heart Failure in the General Population

Paul Durham Ferrell et al. J Am Heart Assoc. .

Abstract

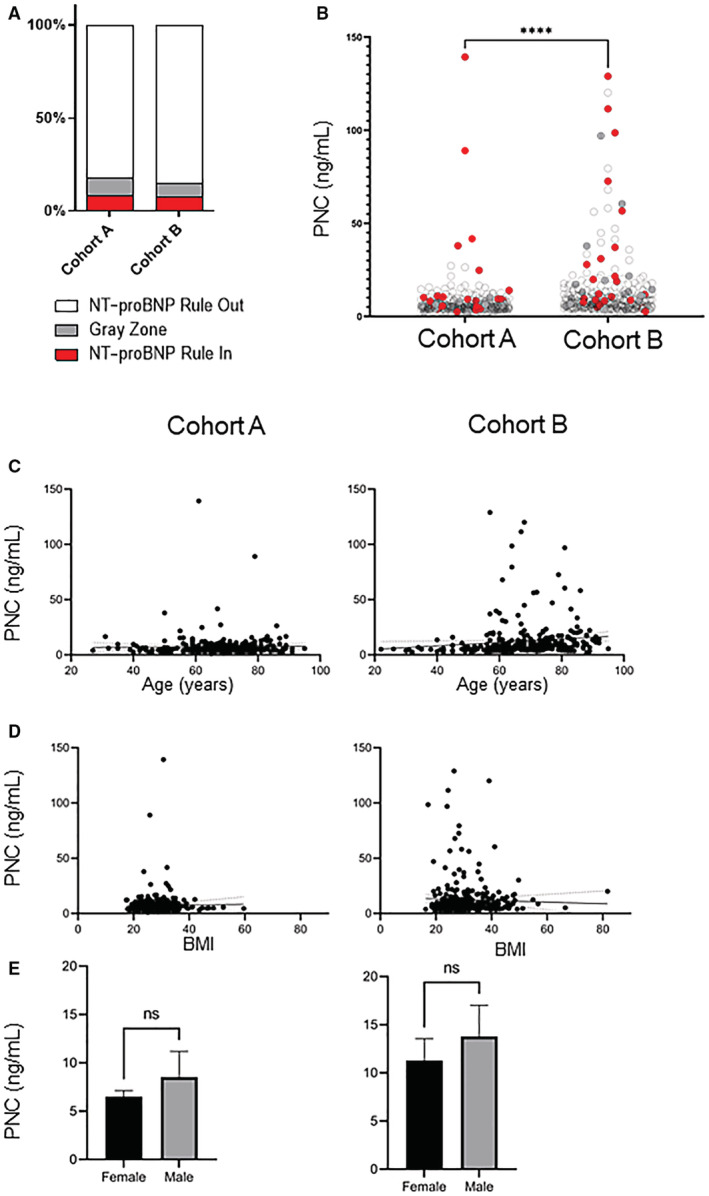
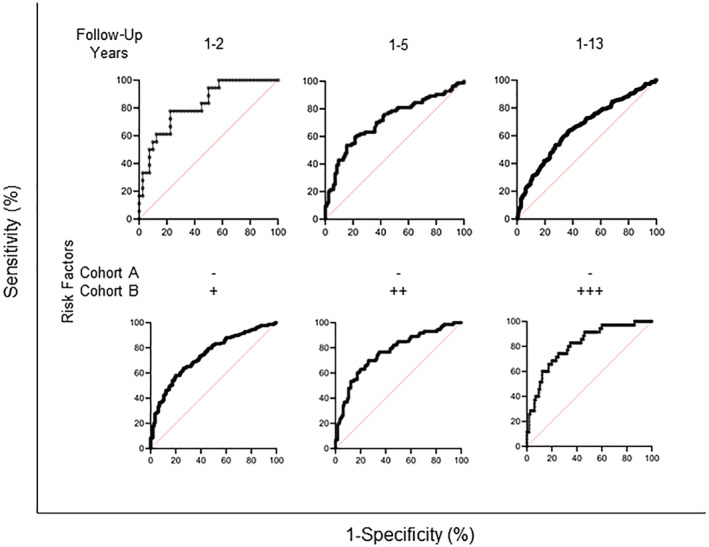
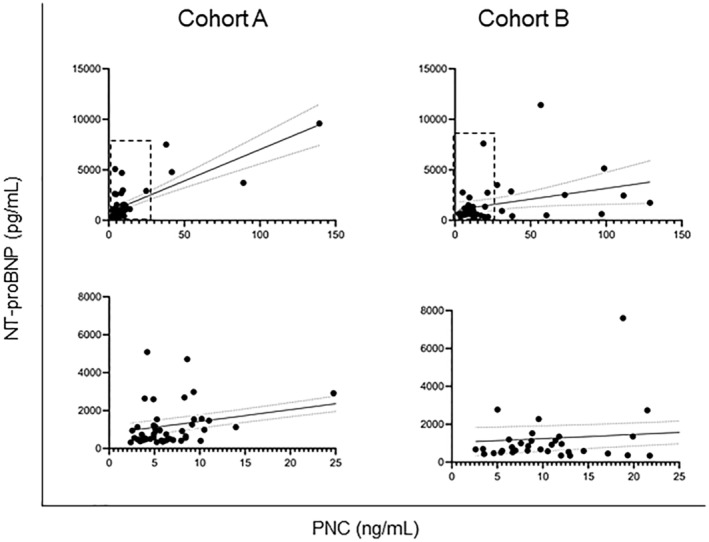
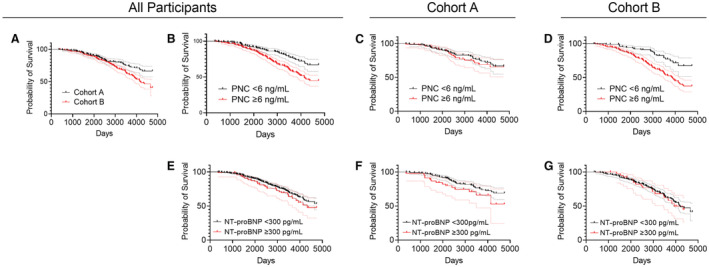
Background We recently reported aberrant processing and localization of the precursor PNC (pro-N-cadherin) protein in failing heart tissues and detected elevated PNC products in the plasma of patients with heart failure. We hypothesize that PNC mislocalization and subsequent circulation is an early event in the pathogenesis of heart failure, and therefore circulating PNC is an early biomarker of heart failure. Methods and Results In collaboration with the Duke University Clinical and Translational Science Institute's MURDOCK (Measurement to Understand Reclassification of Disease of Cabarrus and Kannapolis) study, we queried enrolled individuals and sampled 2 matched cohorts: a cohort of individuals with no known heart failure at the time of serum collection and no heart failure development in the following 13 years (n=289, cohort A) and a matching cohort of enrolled individuals who had no known heart failure at the time of serum collection but subsequently developed heart failure within the following 13 years (n=307, cohort B). Serum PNC and NT-proBNP (N-terminal pro B-type natriuretic peptide) concentrations in each population were quantified by ELISA. We detected no significant difference in NT-proBNP rule-in or rule-out statistics between the 2 cohorts at baseline. In participants who developed heart failure, serum PNC is significantly elevated relative to those who did not report development of heart failure (P<0.0001). Receiver operating characteristic analyses of PNC demonstrate diagnostic value for subclinical heart failure. Additionally, PNC has diagnostic potential when comparing participants with no reported heart failure risk factors from cohort A to at-risk participants from cohort B over the 13-year follow-up. Participants whose PNC levels measure >6 ng/mL have a 41% increased risk of all-cause mortality independent of age, body mass index, sex, NT-proBNP, blood pressure, previous heart attack, and coronary artery disease (P=0.044, n=596). Conclusions These data suggest that PNC is an early marker of heart failure and has the potential to identify patients who would benefit from early therapeutic intervention.

Keywords: BNP; NT‐proBNP; biomarkers; cardiovascular disease; heart failure; pro‐N‐cadherin.


Figures

Figure 1
Figure 1. Relationship of PNC to NT‐proBNP and potential confounding variables.
A, Graphical representation of the percent distribution of NT‐proBNP rule‐in, rule‐out, and “gray zone.” B, PNC values were analyzed between cohort A and cohort B by unpaired t‐test with Welch's corrections. Cohort B has significantly higher PNC levels with a mean value of 12.38 ng/mL relative to cohort A mean value of 7.37 ng/mL (n=596; P<0.0001). Red dots represent participants who meet the NT‐proBNP heart failure rule‐in criteria, white/transparent dots fall within the NT‐proBNP rule‐out criteria, and gray dots represent participants whose NT‐proBNP falls within the gray zone. C, Simple linear regression analysis of age versus PNC values for cohort A and cohort B. No correlation to age and PNC levels is observed in cohort A (n=289; slope, 0.0132; r 2=0.0002; slope, non‐0; P=0.79), but a slight correlation is found in cohort B (n=307; slope, 0.1551; r 2=0.0148; slope, non‐0; P=0.03). D, Simple linear regression analysis of BMI versus PNC values. The slope of either cohort A (n=289; slope, 0.0298; r 2=0.0003; slope, non‐0; P=0.78) nor cohort B (n=307; slope, −0.0722; r 2=0.0013; slope, non‐0; P=0.54) deviated significantly from 0 for BMI versus PNC values. E, Correlation between PNC values and sex was analyzed using an unpaired t‐test with Welch's correction. Neither cohort A (n=289; mean female, 6.50 ng/mL; mean male, 8.53 ng/mL; P=0.14) nor cohort B (n=307; mean female, 11.29 ng/mL; mean male, 13.79 ng/mL; P=0.21) differed in PNC values between women versus men. BMI indicates body mass index; NT‐proBNP, N‐terminal pro‐B‐type natriuretic peptide; and PNC, precursor pro‐N‐cadherin.
Figure 2
Figure 2. Pro‐N‐cadherin is a biomarker of subclinical heart failure.
(Top) ROC analysis using Wilson/Brown method was performed comparing cohort A versus cohort B for participants who followed up within 1 to 2 years, 1 to 5 years, and 1 to 13 years. The AUC is greatest for participants who follow up within 1 to 2 years (total n=58; AUC, 0.82 [95% CI, 0.71–0.93]; P=0.0001), followed by 1 to 5 years (total n=168; AUC, 0.72 [95% CI, 0.64–0.79]; P<0.0001) and 1 to 13 years (total n=596; AUC, 0.66 [95% CI, 0.62–0.70]; P<0.001). (Bottom) ROC analysis using the Wilson/Brown method of participants within cohort A excluding participants who meet the criteria for NT‐proBNP heart failure rule‐in and participants who report coronary artery disease, heart attack, high blood pressure, or atrial fibrillation at the time of blood draw versus cohort B participants who report at least 1, 2, or 3 heart failure risk factors. The AUC is greatest for participants with at least 3 heart failure risk factors (total n=150; AUC, 0.81 [95% CI, 0.73–0.89]; P<0.0001), followed by at least 2 risk factors (total n=188; AUC, 0.76 [95% CI, 0.69–0.84]; P<0.0001) and at least 1 risk factor (total n=342; AUC, 0.74 [95% CI, 0.69–0.80]; P<0.0001). AUC indicates area under the curve; NT‐proBNP, N‐terminal pro‐B‐type natriuretic peptide; and ROC, receiver operating characteristic.
Figure 3
Figure 3. PNC values correlate to NT‐proBNP values.
(Top) Simple linear regression was used to determine a correlation between PNC levels and NT‐proBNP levels in each cohort. A modest correlation is observed in cohort A (n=51; slope, 62.16; r 2=0.56; slope, non‐0; P<0.0001), and a slight correlation is found in cohort B (n=44; slope, 21.41; r 2=0.10; slope, non‐0; P=0.0326). (Bottom) Inset of hashed area of top graphs. NT‐proBNP indicates N‐terminal pro‐B‐type natriuretic peptide; and PNC, precursor pro‐N‐cadherin.
Figure 4
Figure 4. Prognostic value of PNC levels demonstrated by survival curves.
Comparison of survival curves was analyzed using the log‐rank test. A, Cohort B has a significantly lower 13‐year survival rate than cohort A (total n=596; log‐rank HR, 1.64 [95% CI, 1.22–2.20]; P=0.0016). B, Participants from combined cohorts measuring PNC levels ≥6 ng/mL have significantly lower 13‐year survival than participants measuring PNC levels <6 ng/mL (total n=596; log‐rank HR, 1.99 [95% CI, 1.48–2.67]; P<0.0001). C, There is no significant difference between survival curves of cohort A between participants whose PNC levels measure ≥6 ng/mL and participants measuring <6 ng/mL (total n=289; log‐rank HR, 1.17 [95% CI, 0.69–1.98]; P=0.5465). D, Participants from cohort B measuring PNC levels ≥6 ng/mL have significantly lower 13‐year survival than participants measuring PNC levels <6 ng/mL (total n=307; log‐rank HR, 2.53 [95% CI, 1.74–3.69]; P<0.0001). E, No significant difference was found in 13‐year survival between participants from combined cohorts measuring NT‐proBNP levels ≥300 pg/mL relative to participants measuring NT‐proBNP levels <300 pg/mL (total n=590; log‐rank HR, 1.27 [95% CI, 0.84–1.92]; P=0.2098). F, No significant difference was found in 13‐year survival between participants from cohort A measuring NT‐proBNP levels ≥300 pg/mL relative to participants measuring NT‐proBNP levels <300 pg/mL (total n=289; log‐rank HR, 1.66 [95% CI, 0.82–3.33]; P=0.0931). G, No significant difference was found in 13‐year survival between participants from cohort B measuring NT‐proBNP levels ≥300 pg/mL relative to participants measuring NT‐proBNP levels <300 pg/mL (total n=301; log‐rank HR, 1.05 [95% CI, 0.63–1.75]; P=0.8507). Each curve is depicted as the probability of survival and the 95% CI. HR indicates hazard ratio; NT‐proBNP, N‐terminal pro‐B‐type natriuretic peptide; and PNC, precursor pro‐N‐cadherin.

References

    1. Heidenreich PA, Bozkurt B, Aguilar D, Allen LA, Byun JJ, Colvin MM, Deswal A, Drazner MH, Dunlay SM, Evers LR, et al. 2022 AHA/ACC/HFSA guideline for the management of heart failure: a report of the American College of Cardiology/American Heart Association joint committee on clinical practice guidelines. Circulation. 2022;145:e895–e1032. doi: 10.1161/CIR.0000000000001063 - DOI - PubMed
    1. Bozkurt B, Coats AJS, Tsutsui H, Abdelhamid CM, Adamopoulos S, Albert N, Anker SD, Atherton J, Bohm M, Butler J, et al. Universal definition and classification of heart failure: a report of the Heart Failure Society of America, Heart Failure Association of the European Society of Cardiology, Japanese Heart Failure Society and writing committee of the universal definition of heart failure: endorsed by the Canadian Heart Failure Society, Heart Failure Association of India, Cardiac Society of Australia and New Zealand, and Chinese Heart Failure Association. Eur J Heart Fail. 2021;23:352–380. doi: 10.1002/ejhf.2115 - DOI - PubMed
    1. Ammar KA, Jacobsen SJ, Mahoney DW, Kors JA, Redfield MM, Burnett JC, Rodeheffer RJ. Prevalence and prognostic significance of heart failure stages. Circulation. 2007;115:1563–1570. doi: 10.1161/CIRCULATIONAHA.106.666818 - DOI - PubMed
    1. Chen HH, Redfield MM, Nordstrom LJ, Horton DP, Burnett JC. Subcutaneous administration of the cardiac hormone BNP in symptomatic human heart failure. J Card Fail. 2004;10:115–119. doi: 10.1016/j.cardfail.2003.08.011 - DOI - PubMed
    1. McMurray JJ, Adamopoulos S, Anker SD, Auricchio A, Böhm M, Dickstein K, Falk V, Filippatos G, Fonseca C, Gomez‐Sanchez MA, et al. ESC guidelines for the diagnosis and treatment of acute and chronic heart failure 2012: the task force for the diagnosis and treatment of acute and chronic heart failure 2012 of the European Society of Cardiology. Developed in collaboration with the Heart Failure Association (HFA) of the ESC. Eur Heart J. 2012;33:1787–1847. doi: 10.1093/eurheartj/ehs104 - DOI - PubMed

Publication types