. 2023 Apr 17;133(8):e164348.
doi: 10.1172/JCI164348.

Intercellular hif1α reprograms mammary progenitors and myeloid immune evasion to drive high-risk breast lesions

Affiliations

Intercellular hif1α reprograms mammary progenitors and myeloid immune evasion to drive high-risk breast lesions

Irene Bertolini et al. J Clin Invest. .

Abstract

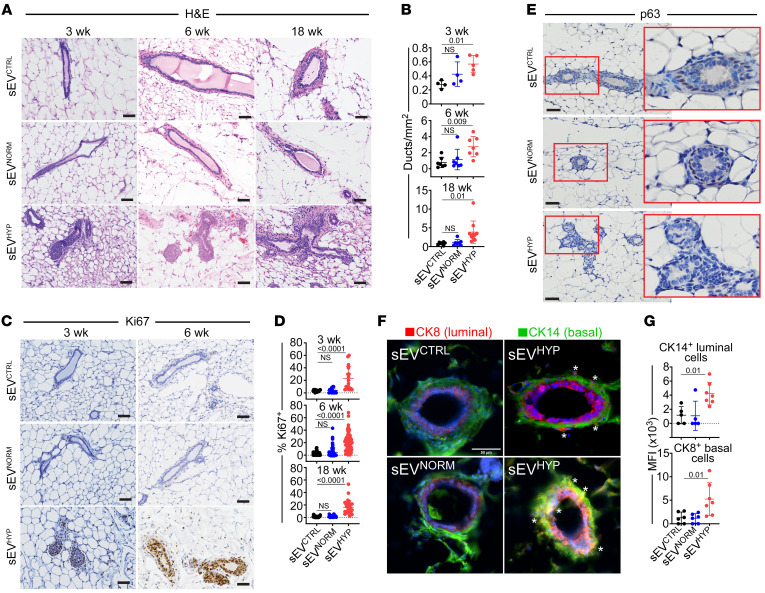
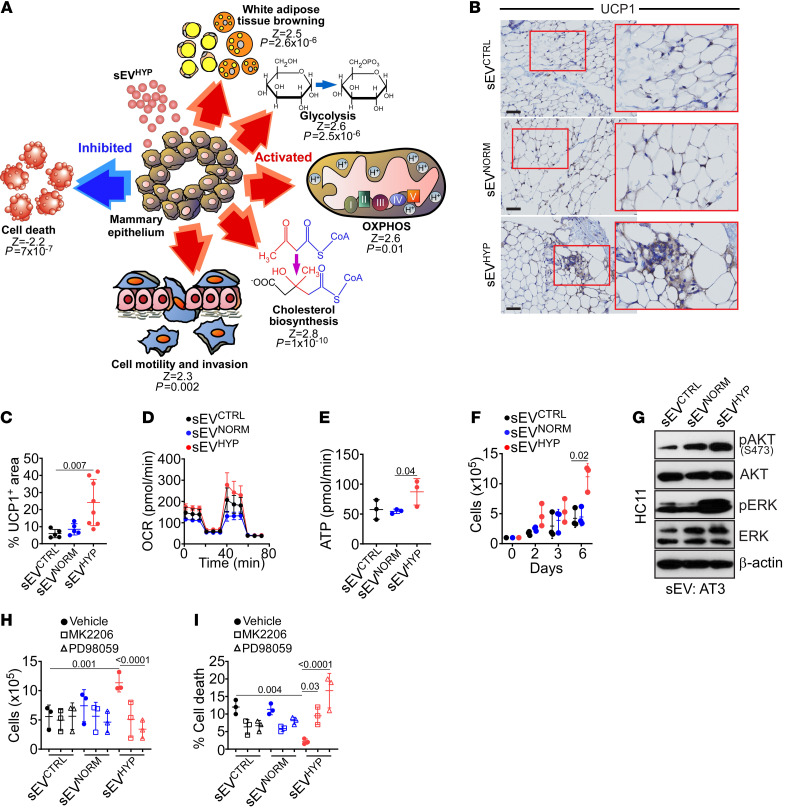
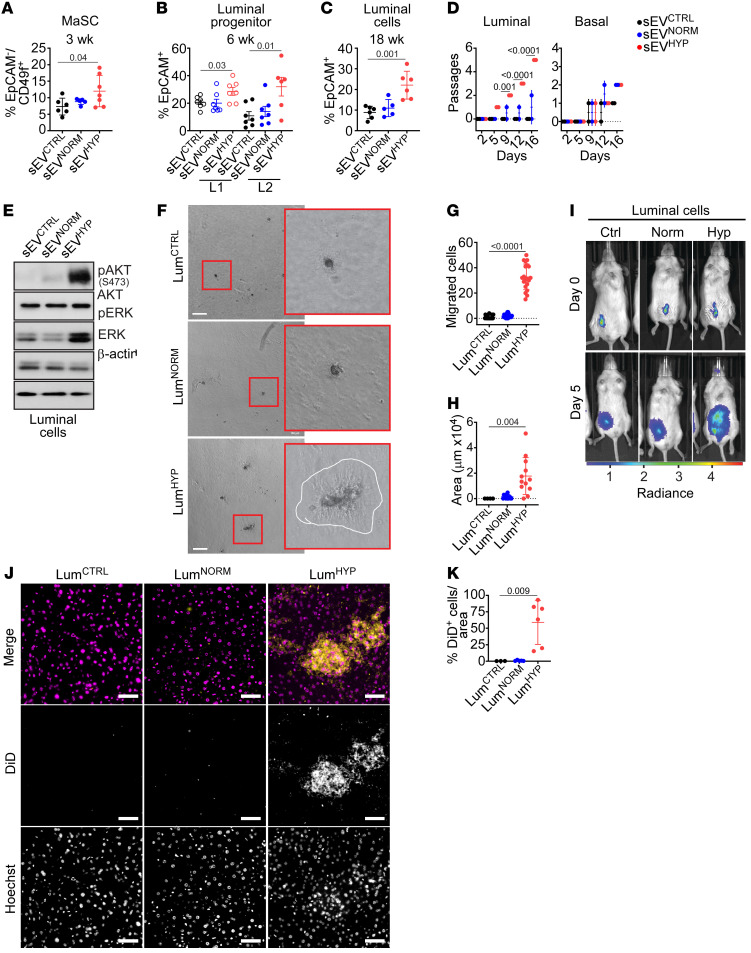
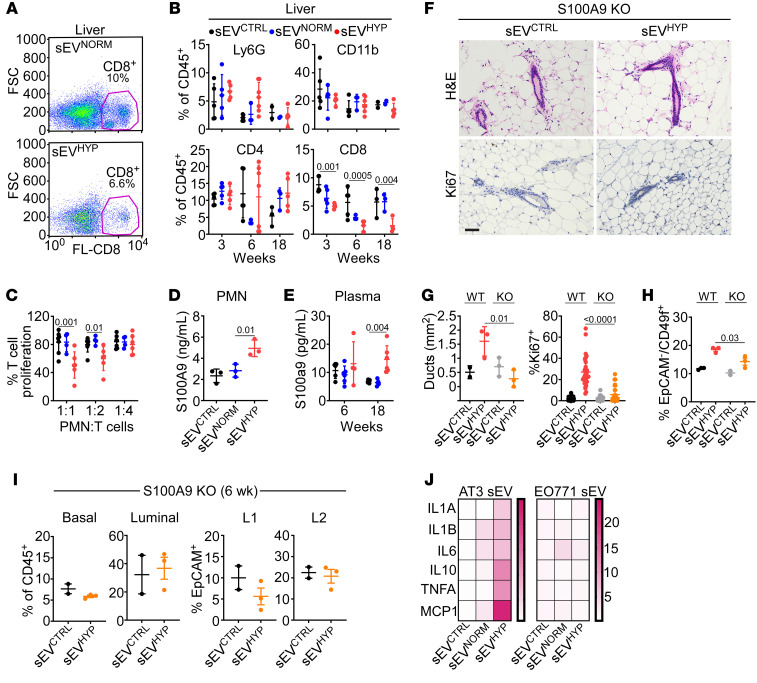
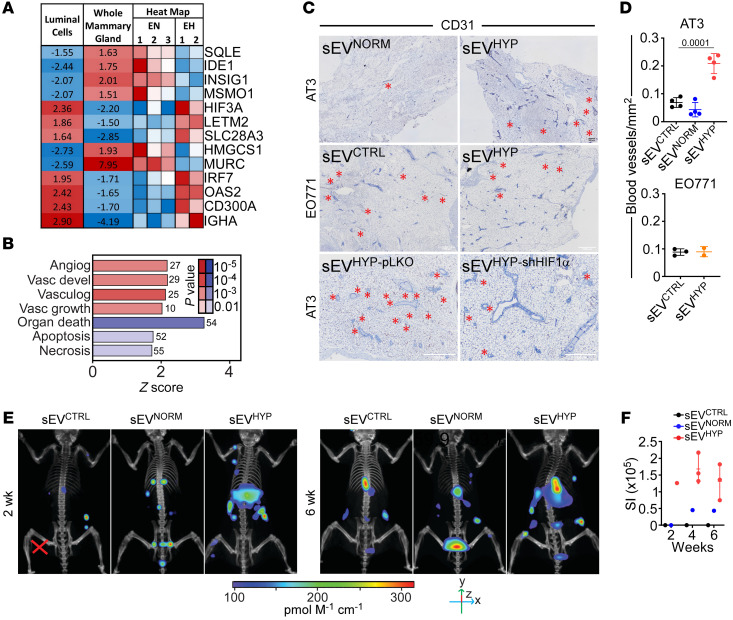
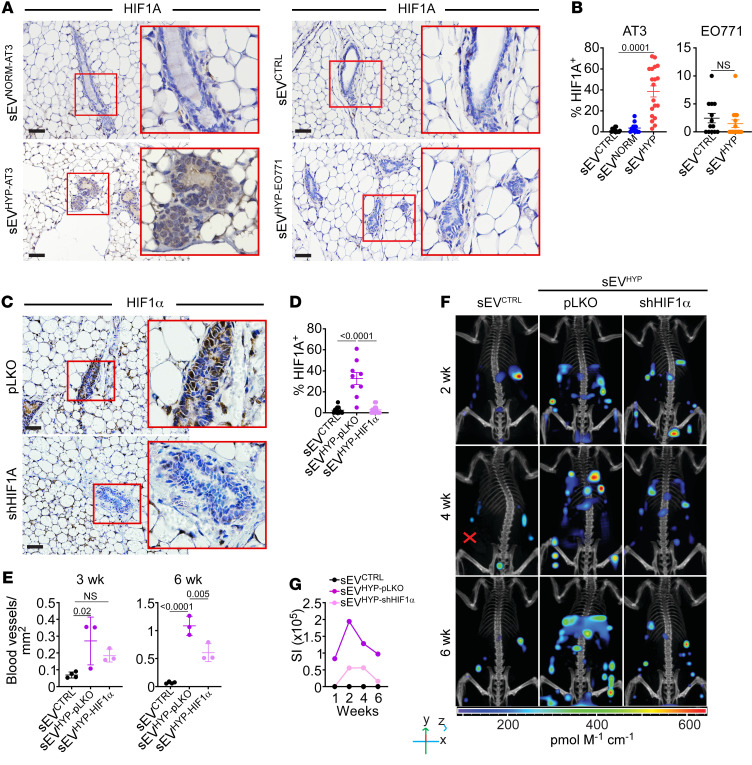
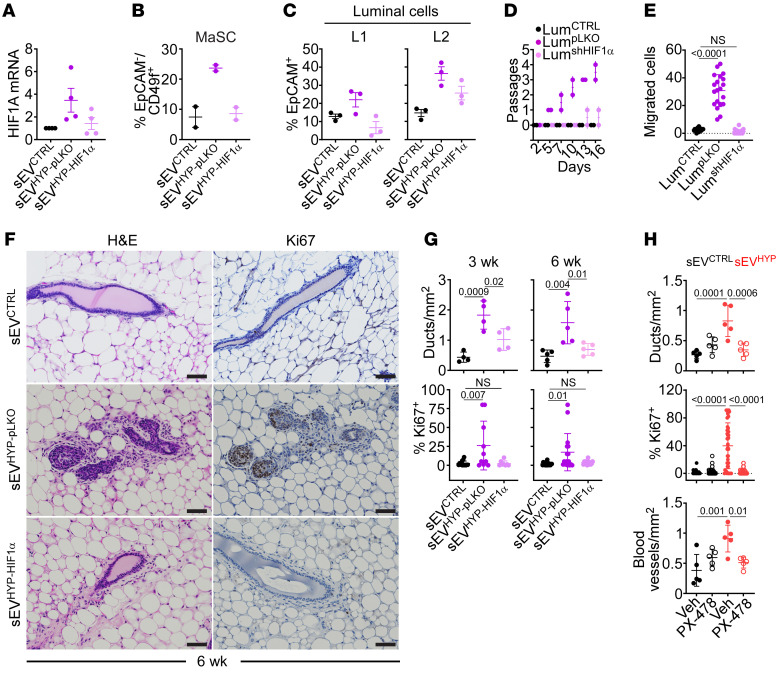
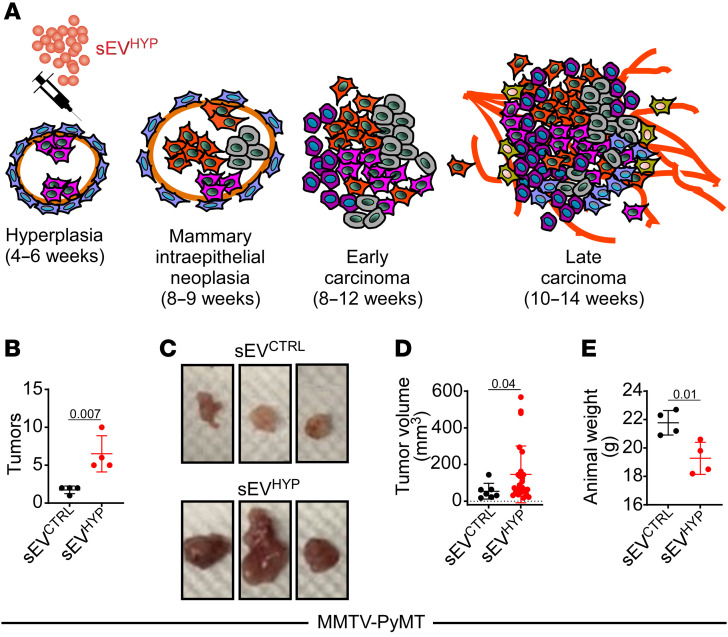
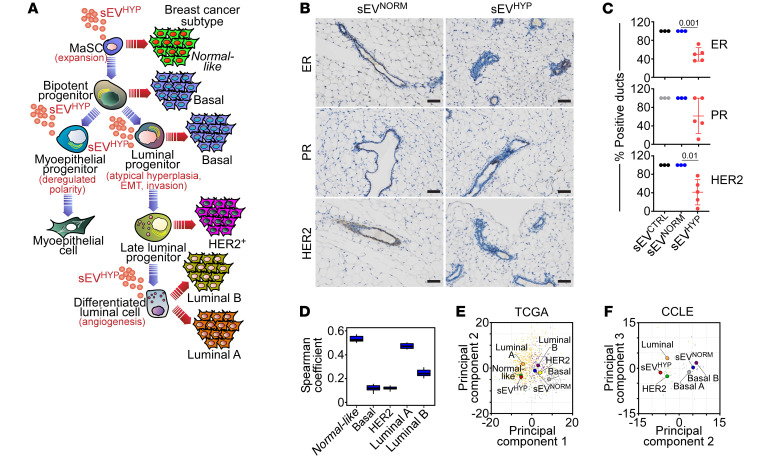
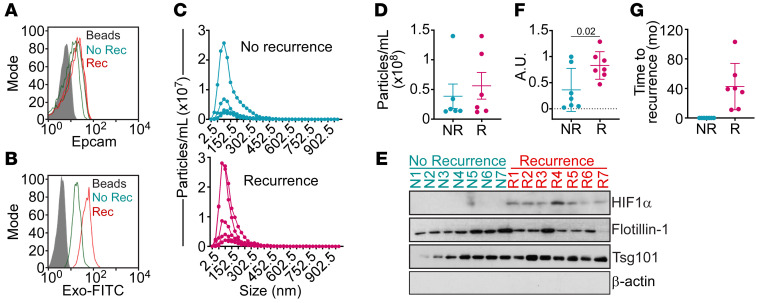
The origin of breast cancer, whether primary or recurrent, is unknown. Here, we show that invasive breast cancer cells exposed to hypoxia release small extracellular vesicles (sEVs) that disrupt the differentiation of normal mammary epithelia, expand stem and luminal progenitor cells, and induce atypical ductal hyperplasia and intraepithelial neoplasia. This was accompanied by systemic immunosuppression with increased myeloid cell release of the alarmin S100A9 and oncogenic traits of epithelial-mesenchymal transition, angiogenesis, and local and disseminated luminal cell invasion in vivo. In the presence of a mammary gland driver oncogene (MMTV-PyMT), hypoxic sEVs accelerated bilateral breast cancer onset and progression. Mechanistically, genetic or pharmacologic targeting of hypoxia-inducible factor-1α (HIF1α) packaged in hypoxic sEVs or homozygous deletion of S100A9 normalized mammary gland differentiation, restored T cell function, and prevented atypical hyperplasia. The transcriptome of sEV-induced mammary gland lesions resembled luminal breast cancer, and detection of HIF1α in plasma circulating sEVs from luminal breast cancer patients correlated with disease recurrence. Therefore, sEV-HIF1α signaling drives both local and systemic mechanisms of mammary gland transformation at high risk for evolution to multifocal breast cancer. This pathway may provide a readily accessible biomarker of luminal breast cancer progression.

Keywords: Breast cancer; Cell Biology; Hypoxia; Neutrophils; Oncology.


Figures

Figure 1
Figure 1. Hypoxic sEVs (sEVHYP) induce mammary gland hyperplasia in vivo.
(A and B) AT3 cell–derived sEVs were injected in the abdominal mammary gland of immunocompetent C57BL/6 female mice, and tissue samples were analyzed after 3, 6, and 18 weeks by H&E staining and immunohistochemistry (IHC) (A, representative images) with quantification of the number of mammary gland ducts (B). Scale bars: 100 μm. Mean ± SD (n = 4). (C and D) Mammary gland tissues as in A were stained with an antibody against Ki67 by IHC (C, representative images), and the percentage of positive cells was quantified (D). Scale bars: 100 μm. Mean ± SD (n = 4). (E) Mammary gland tissues were analyzed for p63 reactivity after 6 weeks by IHC. Representative images (n = 4). Scale bars: 100 μm. Red boxes, magnification of indicated areas. (F) Mammary gland tissues were analyzed after 6 weeks for expression of luminal marker cytokeratin 8 (CK8, red) and basal marker cytokeratin 14 (CK14, green) by immunofluorescence microscopy. Asterisks, mislocalized apical-basal markers in sEVHYP-treated mammary gland. Representative images (n = 5). Scale bar: 50 μm. (G) Conditions were as in F, and mammary glands injected with the various sEVs were quantified for apical-basal mislocalization of CK8+ or CK14+ cells. MFI, mean fluorescence intensity. Mean ± SD. For all panels, numbers correspond to P values by 1-way ANOVA with Tukey’s multiple-comparison test.
Figure 2
Figure 2. sEVHYP regulation of mammary epithelium bioenergetics.
(A) Schematic diagram of gene pathways upregulated (red) or downregulated (blue) in mammary glands of C57BL/6 female mice injected with sEVHYP by RNA-Seq and Ingenuity Pathway Analysis. Z scores and P values for each modulated gene pathway are indicated. OXPHOS, oxidative phosphorylation. (B and C) Mammary glands harvested 6 weeks after sEV injection were analyzed for UCP-1 expression by IHC (B, representative images) and quantified (C). Red boxes, magnification of indicated areas. Scale bars: 100 μm. Mean ± SD (n = 5). (D) Primary mammary epithelial HC11 cells were incubated with AT3 cell–derived sEVs and analyzed for oxygen consumption rates (OCR) on an Agilent Seahorse flux analyzer. Mean ± SD (n = 3). (E) The conditions were as in D, and the rate of ATP production was quantified. Mean ± SD (n = 3). (F) HC11 cells were incubated with AT3 cell–derived sEVs and analyzed for cell proliferation by direct cell counting. Mean ± SD (n = 3). (G) HC11 cells as in F were analyzed after 3 days by Western blotting. p, phosphorylated. (n = 3.) (H and I) sEV-treated HC11 cells were incubated with vehicle (closed circles), Akt inhibitor MK2206 (1 μM, open squares), or ERK inhibitor PD98059 (10 μM, open triangles) and analyzed for cell proliferation (H) or cell death (I) after 7 days by direct cell counting. Mean ± SD (n = 3). For all panels, numbers correspond to P values by 1-way ANOVA with Tukey’s multiple-comparison test.
Figure 3
Figure 3. Modulation of mammary gland developmental hierarchy by sEVHYP.
(A) Abdominal mammary glands of C57BL/6 mice injected with AT3 sEVs were harvested after 3 weeks, and mammary stem cells (MaSCs) were quantified by flow cytometry (n = 7). (B) Mammary gland tissues as in A were analyzed for expression of luminal progenitor L1 and L2 cells after 6 weeks by flow cytometry (n = 7). (C) The conditions were as in A, and the percentage of differentiated luminal cells was quantified after 18 weeks by flow cytometry. For panels AC, mean ± SD (n = 6). (D) Luminal and basal cells isolated from abdominal mammary glands 6 weeks after sEV injection were analyzed for number of passages in culture. Mean ± SD (n = 3). (E) Sorted luminal cells as in D were analyzed by Western blotting (n = 3). (F) Sorted luminal cells as in D were treated with sEVs and analyzed for colony formation in Matrigel after 14 days. White line, border of Matrigel invasion area. Representative images (n = 3). Scale bars: 100 μm. (G) Sorted luminal cells as in D were analyzed for migration on PET inserts during 24 hours. Mean ± SD (n = 3). (H) The conditions were as in F, and the area of Matrigel invasion was quantified. Mean ± SD (n = 3). (I) Sorted luminal cells as in D were stained with Vybrant-DiD dye, injected in the mammary gland of immunocompromised NOD/SCID IL2Rγnull mice, and tracked using an IVIS SpectrumCT In Vivo Imaging System at the time of injection and after 5 days. Representative images. (J and K) The conditions were as in I, and livers were analyzed after 8 weeks for DiD+ luminal cells by fluorescence microscopy (J, representative images) and quantified (K). Scale bars: 50 μm. Yellow, DiD+ cells; magenta, nuclei. Mean ± SD (n = 6). For all panels, numbers correspond to P values by 1-way ANOVA with Tukey’s multiple-comparison test.
Figure 4
Figure 4. sEVHYP promote myeloid cell immunosuppression and S100A9 release.
(A) Liver samples from sEVCTRL- or sEVHYP-injected mice were analyzed for CD8+ T cell expression by flow cytometry. Representative experiment (n = 6). (B) Liver samples as in A were analyzed for myeloid (Ly6G+, CD11b+) or lymphoid (CD4+, CD8+) cell populations by flow cytometry. (C) T cells cocultured with naive mouse PMNs treated with AT3 cell–derived sEVs at the indicated ratios were analyzed for cell proliferation. Mean ± SD (n = 3). (D) Naive mouse PMNs were incubated with sEVs, and culture supernatants were analyzed for released S100A9 by ELISA (n = 3). (E) Plasma samples from sEV-injected mice were analyzed for S100A9 levels by ELISA (n = 5). (F and G) Wild-type (WT) or S100A9-knockout (KO) mice were injected in the mammary gland with sEVCTRL or sEVHYP and analyzed by IHC (F, representative images) with quantification of mammary duct expansion (G, left) and Ki67+ cell proliferation (G, right). Scale bar: 100 μm. Mean ± SD (n = 3). (H) The conditions were as in F and G, and mammary gland samples from WT or S100A9-KO mice were analyzed for MaSCs. Mean ± SD (n = 3). (I) Mammary gland tissues from S100A9-KO mice were analyzed for basal or luminal progenitor cells (left) or L1 and L2 differentiated luminal cells (right) 6 weeks after sEV injection. (J) PMNs incubated with sEVs isolated from AT3 (left) or EO771 (right) cells were analyzed for expression of the indicated cytokines by quantitative RT-PCR. Data are presented as heatmaps. Representative experiment (n = 3). For all panels, numbers correspond to P values by 1-way ANOVA with Tukey’s multiple-comparison test.
Figure 5
Figure 5. sEVHYP regulation of mammary gland angiogenesis.
(A) Whole mammary glands or isolated luminal cells treated with sEVNORM (EN) or sEVHYP (EH) were analyzed for changes in gene expression by RNA-Seq. Data are expressed as a heatmap. Mean expression changes in EH/EN comparisons as well as individual replicates of luminal cell expression levels versus mean are indicated. Blue, downregulated; red, upregulated. (B) The conditions were as in A, and pathways activated (red) or inhibited (blue) in isolated luminal cells treated with sEVHYP were quantified. The number of genes and P values are indicated. FDR < 10%; z score ≥ 1.5. (C) AT3 or EO771 cell–derived sEVs were injected in the abdominal mammary gland of C57BL/6 mice, and tissue samples were analyzed for expression of CD31 after 6 weeks by IHC (representative images). Black scale bar: 500 μm; white scale bars: 1,000 μm. Red asterisks, blood vessels. Top: AT3 cell–derived sEVNORM or sEVHYP. Middle: EO771 cell–derived sEVNORM or sEVHYP. Bottom: AT3 cell–derived sEVpLKO or sEVshHIF1α. (D) The conditions were as in C, and microvessel density was quantified from CD31 reactivity by IHC. Mean ± SD (n = 4). Numbers correspond to P values by 1-way ANOVA with Tukey’s multiple-comparison test. (E) AT3 cell–derived sEVs were injected in the abdominal mammary gland of C57BL/6 mice followed by i.v. administration of IVISense Vascular 750 Fluorescent Probe IV after 2 (left) and 6 (right) weeks (n = 3). (F) The conditions were as in E, and the IVISense fluorescence signal was quantified after 24 hours by CT scan. SI, source intensity.
Figure 6
Figure 6. sEVHYP-HIF1α signaling controls mammary gland angiogenesis.
(A and B) AT3 or EO771 cell–derived sEVs were injected in the abdominal mammary gland of C57BL/6 mice, and tissue samples were analyzed for nuclear expression of HIF1α after 6 weeks by IHC (A, representative images) and quantified (B). Scale bars: 100 μm. Mean ± SD (n = 4). (C and D) sEVHYP isolated from AT3 cells transduced with pLKO or shHIF1α were injected in the abdominal mammary gland of C57BL/6 mice, and tissue samples were analyzed for HIF1α expression after 6 weeks by IHC (C, representative images) and quantified (D). Red boxes, magnification of indicated areas. Scale bars: 100 μm. Mean ± SD (n = 3). (E) Mammary glands injected with AT3 cell–derived sEVpLKO or sEVshHIF1α were analyzed for microvessel density by CD31 staining and IHC. Mean ± SD (n = 3). (F and G) The conditions were as in C and D, and mice injected i.v. with IVISense Vascular 750 Fluorescent Probe after 2, 4, and 6 weeks were analyzed after an additional 24 hours by CT scan on an IVIS Spectrum (F, representative 3D reconstructed images) with quantification of fluorescence intensity (G) (n = 3). For all panels, numbers correspond to P values by 1-way ANOVA with Tukey’s multiple-comparison test.
Figure 7
Figure 7. sEVHYP-HIF1α modulation of mammary gland developmental hierarchy.
(A) sEVHYP from AT3 cells transduced with pLKO (sEVpLKO) or shHIF1α (sEVshHIF1α) were injected in the abdominal mammary gland of C57BL/6 mice, and luminal cells isolated after 6 weeks were quantified for HIF1α mRNA expression by quantitative RT-PCR. Mean ± SD (n = 4). (B and C) The conditions were as in A, and the percentage of mammary stem cells (MaSC, n = 2) (B) or luminal L1 and L2 progenitor cells (C, n = 3) was quantified after 3 (B) or 6 (C) weeks by flow cytometry. (D) Luminal cells were sorted from the mammary gland of C57BL/6 mice as in A and analyzed for the number of passages in culture (n = 3). (E) The conditions were as in D, and migration of sorted luminal cells on PET inserts was quantified. Mean ± SD (n = 3). (F and G) Mammary glands as in A were analyzed after 3 and 6 weeks from sEV injection (F, representative images at 6 weeks, n = 5) with quantification of mammary ducts and percentage of Ki67+ cells (G) by IHC. Scale bars: 100 μm. Mean ± SD. (H) C57BL/6 mice injected with sEVCTRL or sEVHYP in the abdominal mammary gland were given the small-molecule HIF1α inhibitor PX-478 on days 1 and 3 and analyzed after 21 days for mammary ducts (top), percentage of Ki67+ cells (middle), or blood vessel density (bottom) by IHC. Mean ± SD (n = 5). For all panels, numbers correspond to P values by 1-way ANOVA with Tukey’s multiple-comparison test.
Figure 8
Figure 8. sEVHYP-HIF1α signaling accelerates breast tumorigenesis in vivo.
(A) Schematic diagram of timeline of mammary gland tumorigenesis and disease progression in MMTV-PyMT–transgenic mice. (B) MMTV-PyMT mice (6 weeks old) were injected in the abdominal mammary gland with sEVCTRL or AT3 cell–derived sEVHYP and examined for differential tumor formation after 3 weeks. (C and D) Representative macroscopic images of tumors formed in MMTV-PyMT–transgenic mice after sEV injection (C) and quantification of tumor volume (D). (E) Weight of sEV-injected MMTV-PyMT–transgenic mice. For all panels, data are the mean ± SD (n = 4). Numbers correspond to P values by 1-way ANOVA with Tukey’s multiple-comparison test.
Figure 9
Figure 9. sEVHYP modulation of luminal breast cancer development.
(A) Schematic diagram of hierarchy of mammary epithelial cell differentiation and proposed origin of breast cancer subtypes. The multiple differentiation stages affected by sEVHYP and resulting cellular responses are indicated in red. (B and C) sEV-injected mammary glands from C57BL/6 mice were analyzed for hormone receptor ER or PR status and HER2 expression by IHC (B, representative images) and quantified (C). Scale bars: 100 μm. Mean ± SD. Numbers correspond to P values by 1-way ANOVA with Tukey’s multiple-comparison test. (D) RNA-Seq data of luminal cells exposed to sEVHYP in vivo were correlated with a breast cancer TCGA data set using a 50-gene PAM50 signature for breast cancer subtyping. The correlation with the individual intrinsic breast cancer subtypes is indicated. (E and F) Relationship between expression levels of genes modulated by sEVHYP versus sEVNORM and breast cancer subtypes in the TCGA (E) and CCLE (F) databases.
Figure 10
Figure 10. sEV-packaged HIF1α as a plasma biomarker of recurrent luminal breast cancer.
(A) Circulating sEVs isolated from plasma of patients with recurrent (Rec) or non-recurrent (No Rec) breast cancer were analyzed for EpCAM expression using CD63+ beads by flow cytometry. Representative experiment. (B) The conditions were as in A, and plasma circulating sEVs were further enriched using EpCAM+ beads. sEV binding to beads was confirmed by Exo-FITC staining and flow cytometry. Representative experiment. (C) Circulating sEVs from patients with luminal breast cancer with or without recurrence (n = 14) were analyzed using a ZetaView analyzer with quantification of sEV number and size distribution. (D) Yield of circulating sEVs isolated from patients with luminal breast cancer with (R) or without (NR) recurrence. Each symbol corresponds to an individual patient. (E and F) sEVs isolated from plasma of patients with recurrent (n = 7) or non-recurrent (n = 7) breast cancer were analyzed by Western blotting (E), and protein bands were quantified by densitometry (F). Each symbol corresponds to an individual patient. AU, arbitrary units. Mean ± SD. Numbers correspond to P values by 1-way ANOVA with Tukey’s multiple-comparison test. (G) Time to recurrence (mo) of patients (n = 14) with diagnosis of recurrent or non-recurrent luminal breast cancer. Each symbol corresponds to an individual patient.

References

    1. DeSantis CE, et al. Breast cancer statistics, 2019. CA Cancer J Clin. 2019;69(6):438–451. doi: 10.3322/caac.21583. - DOI - PubMed
    1. Zardavas D, et al. Clinical management of breast cancer heterogeneity. Nat Rev Clin Oncol. 2015;12(7):381–394. doi: 10.1038/nrclinonc.2015.73. - DOI - PubMed
    1. Polyak K. Breast cancer: origins and evolution. J Clin Invest. 2007;117(11):3155–3163. doi: 10.1172/JCI33295. - DOI - PMC - PubMed
    1. Harbeck N, et al. Breast cancer. Nat Rev Dis Primers. 2019;5(1):66. doi: 10.1038/s41572-019-0111-2. - DOI - PubMed
    1. Slepicka PF, et al. The molecular basis of mammary gland development and epithelial differentiation. Semin Cell Dev Biol. 2021;114:93–112. doi: 10.1016/j.semcdb.2020.09.014. - DOI - PMC - PubMed

Publication types

Substances