

Detection of genes with differential expression dispersion unravels the role of autophagy in cancer progression
- PMID: 36893104
- PMCID: PMC9997931
- DOI: 10.1371/journal.pcbi.1010342
Detection of genes with differential expression dispersion unravels the role of autophagy in cancer progression
Abstract
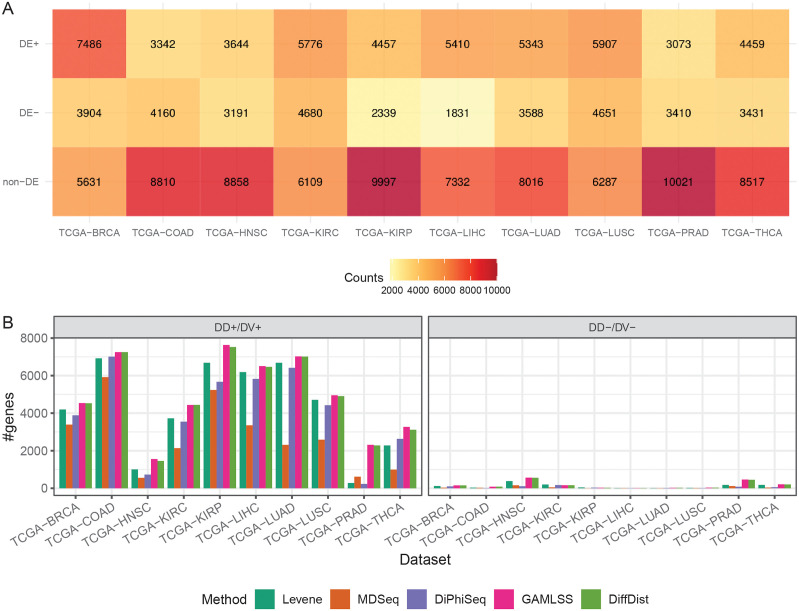
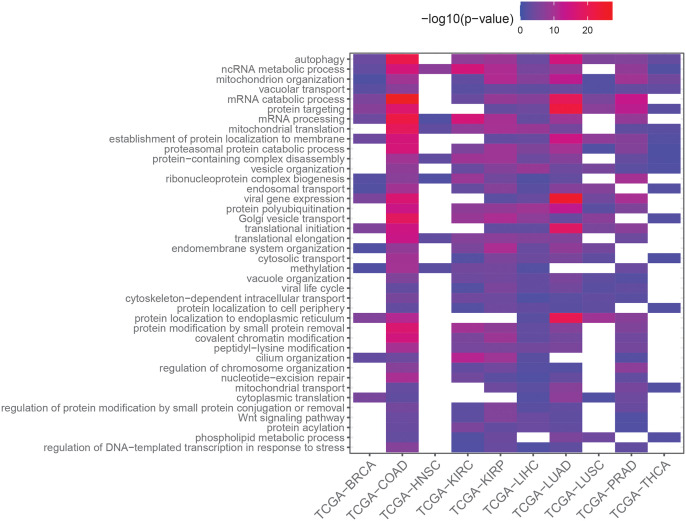
The majority of gene expression studies focus on the search for genes whose mean expression is different between two or more populations of samples in the so-called "differential expression analysis" approach. However, a difference in variance in gene expression may also be biologically and physiologically relevant. In the classical statistical model used to analyze RNA-sequencing (RNA-seq) data, the dispersion, which defines the variance, is only considered as a parameter to be estimated prior to identifying a difference in mean expression between conditions of interest. Here, we propose to evaluate four recently published methods, which detect differences in both the mean and dispersion in RNA-seq data. We thoroughly investigated the performance of these methods on simulated datasets and characterized parameter settings to reliably detect genes with a differential expression dispersion. We applied these methods to The Cancer Genome Atlas datasets. Interestingly, among the genes with an increased expression dispersion in tumors and without a change in mean expression, we identified some key cellular functions, most of which were related to catabolism and were overrepresented in most of the analyzed cancers. In particular, our results highlight autophagy, whose role in cancerogenesis is context-dependent, illustrating the potential of the differential dispersion approach to gain new insights into biological processes and to discover new biomarkers.
Copyright: © 2023 Le Priol et al. This is an open access article distributed under the terms of the Creative Commons Attribution License, which permits unrestricted use, distribution, and reproduction in any medium, provided the original author and source are credited.
Conflict of interest statement
The authors have declared that no competing interests exist.
Figures


Similar articles
-
A new shrinkage estimator for dispersion improves differential expression detection in RNA-seq data.Biostatistics. 2013 Apr;14(2):232-43. doi: 10.1093/biostatistics/kxs033. Epub 2012 Sep 22. Biostatistics. 2013. PMID: 23001152 Free PMC article.
-
Gene dispersion is the key determinant of the read count bias in differential expression analysis of RNA-seq data.BMC Genomics. 2017 May 25;18(1):408. doi: 10.1186/s12864-017-3809-0. BMC Genomics. 2017. PMID: 28545404 Free PMC article.
-
Blind spots of quantitative RNA-seq: the limits for assessing abundance, differential expression, and isoform switching.BMC Bioinformatics. 2013 Dec 24;14:370. doi: 10.1186/1471-2105-14-370. BMC Bioinformatics. 2013. PMID: 24365034 Free PMC article.
-
Statistical detection of differentially expressed genes based on RNA-seq: from biological to phylogenetic replicates.Brief Bioinform. 2016 Mar;17(2):243-8. doi: 10.1093/bib/bbv035. Epub 2015 Jun 24. Brief Bioinform. 2016. PMID: 26108230 Review.
-
Insights from a Computational-Based Approach for Analyzing Autophagy Genes across Human Cancers.Genes (Basel). 2023 Jul 28;14(8):1550. doi: 10.3390/genes14081550. Genes (Basel). 2023. PMID: 37628602 Free PMC article. Review.
References
Publication types
MeSH terms
Substances
LinkOut - more resources
Full Text Sources
Medical
