. 2023 Mar 10;379(6636):eadd9330.
doi: 10.1126/science.add9330. Epub 2023 Mar 10.

The connectome of an insect brain

Affiliations

The connectome of an insect brain

Michael Winding et al. Science. .

Abstract

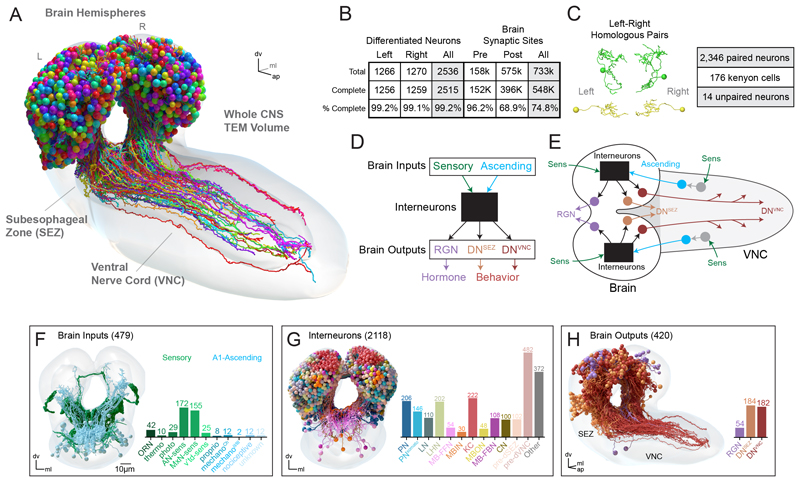
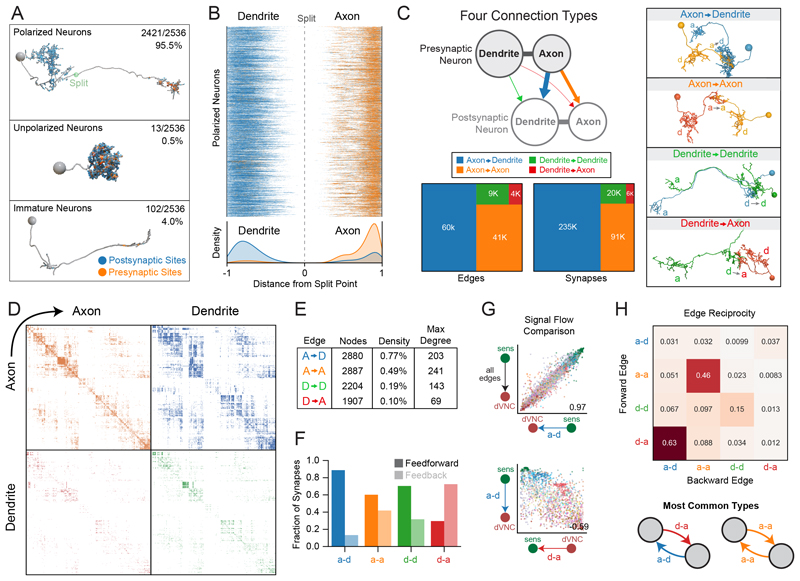
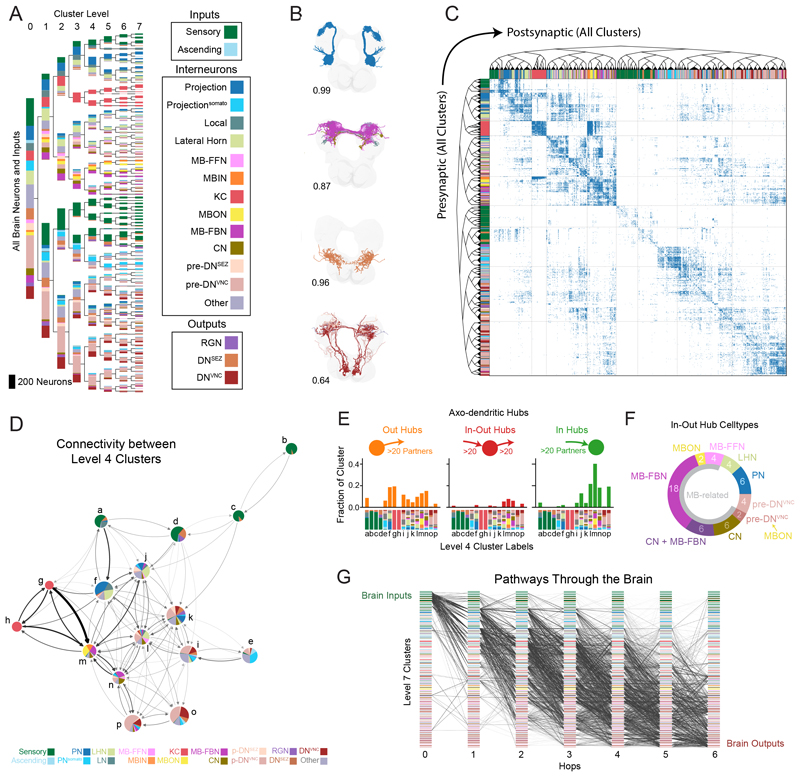
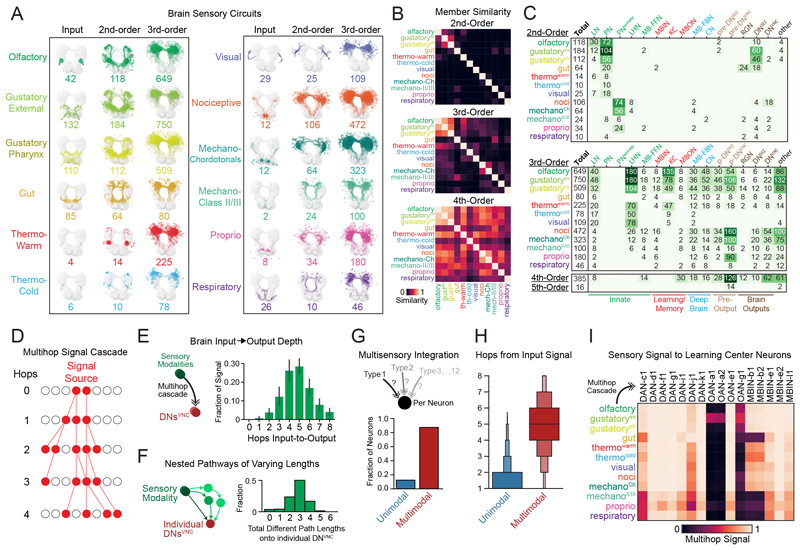
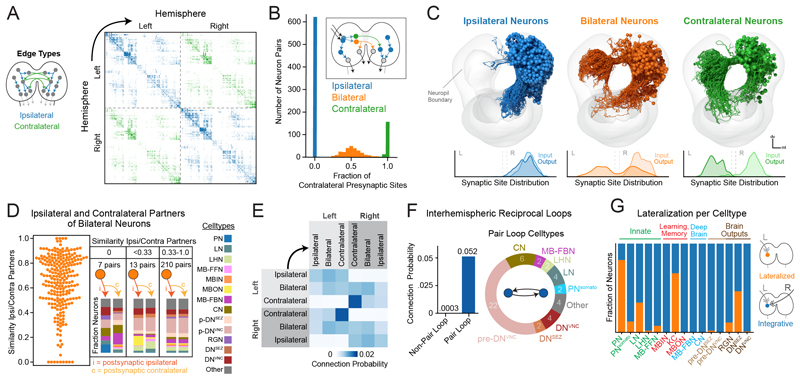
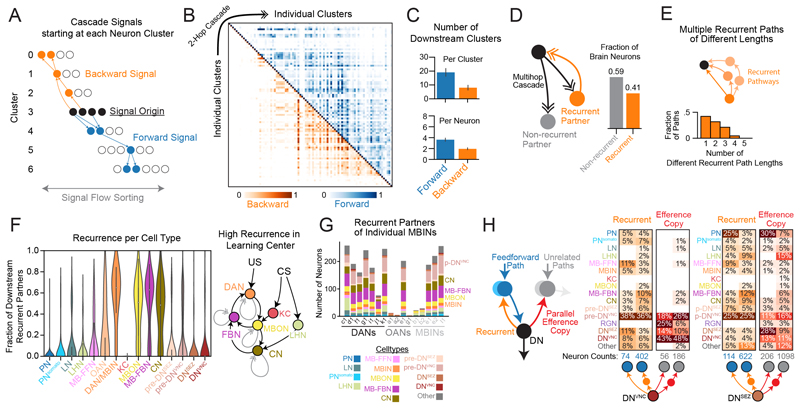
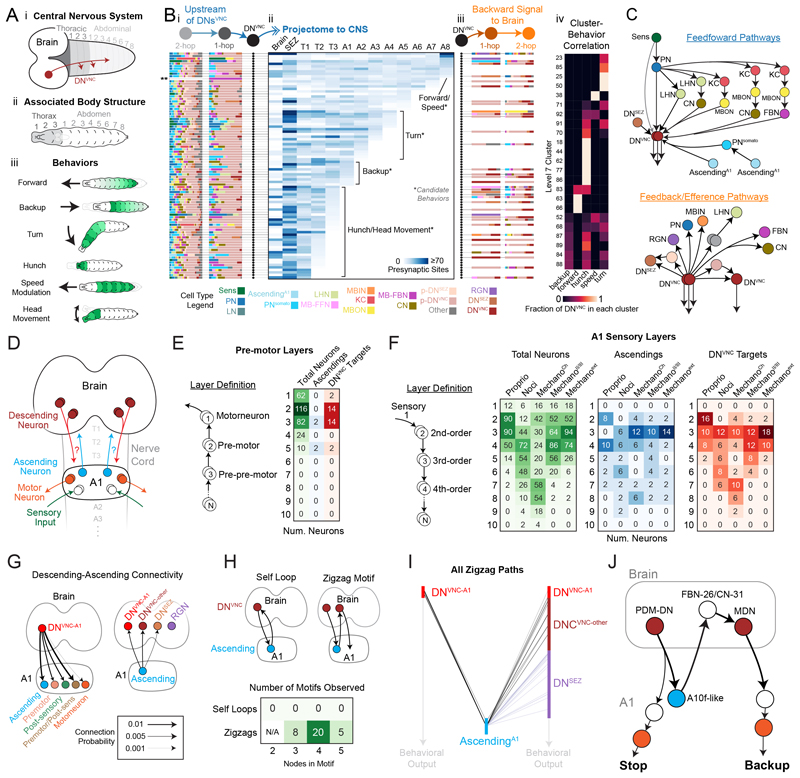
Brains contain networks of interconnected neurons and so knowing the network architecture is essential for understanding brain function. We therefore mapped the synaptic-resolution connectome of an entire insect brain (Drosophila larva) with rich behavior, including learning, value computation, and action selection, comprising 3016 neurons and 548,000 synapses. We characterized neuron types, hubs, feedforward and feedback pathways, as well as cross-hemisphere and brain-nerve cord interactions. We found pervasive multisensory and interhemispheric integration, highly recurrent architecture, abundant feedback from descending neurons, and multiple novel circuit motifs. The brain's most recurrent circuits comprised the input and output neurons of the learning center. Some structural features, including multilayer shortcuts and nested recurrent loops, resembled state-of-the-art deep learning architectures. The identified brain architecture provides a basis for future experimental and theoretical studies of neural circuits.


Conflict of interest statement

Competing interests: The authors declare that they have no competing interests.

Figures

Fig. 1
Fig. 1. Comprehensive reconstruction of a Drosophila larva brain.
(A) Morphology of differentiated brain neurons in the CNS of a Drosophila larva. (B) Most (>99%) of neurons were reconstructed to completion, defined by reconstruction of all terminal branches (see Methods) and no data quality issues preventing identification of axons and dendrites. Pre- and postsynaptic sites were considered complete when connected to a brain neuron or ascending arbors from neurons outside the brain. (C) Left and right homologous neuron pairs were identified using an automated graph matching with manual proofreading. There was no clear partner for 14 neurons based on this workflow (unpaired), along with 176 unpaired KCs in the learning and memory center. (D and E) Schematic overview of brain structure. Brain inputs include SNs, which directly synapse onto brain neurons, and ANs from VNC segment A1, which receive direct or polysynaptic input from A1 sensories (see fig. S2). Brain interneurons transmit these input signals to output neurons: DNs to the subesophageal zone (SEZ) (DNSEZ), DNs to the VNC (DNVNC), and ring gland neurons (RGN). (F to H) Cell classes in the brain. Some interneurons belong to multiple classes, but are displayed as mutually exclusive for plotting expedience (see fig. S4). Note that some previously reconstructed interneurons (40 total) and output neurons (6 total) are included in the barplots but are not brain neurons per se and not included in counts. There were 20 brain output neurons with known cell classes that were therefore also included in (G).
Fig. 2
Fig. 2. Identification of all brain axons and dendrites revealed four connection types.
(A) Axons and dendrites were identified in all brain neurons, >95% of which contained fully differentiated axons and dendrites. The remainder were unpolarized neurons and immature neurons. (B) Axons contained mostly presynaptic sites (orange), whereas dendrites contained mostly postsynaptic sites (blue), but pre- and postsynaptic sites were observed in both compartments. (C) Synaptic connections between brain neurons were categorized as axo-dendritic (a-d), axo-axonic (a-a), dendro-dendritic (d-d), or dendro-axonic (d-a). (D) Adjacency matrices displaying all connection types between brain neurons (raw data in data S1 and S2). Each quadrant represents a different connectivity type between each presynaptic neuron (row) and postsynaptic neuron (column) in the brain. (E) Graph metrics for subgraphs comprising each connection type: number of nodes participating in each connection type, graph density (number of connections observed divided by all possible connections), and max degree (maximum number of connections from a single neuron). (F) Fraction of feedforward and feedback synapses per connection type, defined based on the overall neuron sorting from sensory to output (fig. S6, F and G). (G) Comparison of the direction of information flow for the indicated connection types. Individual neurons in each graph type were sorted using the signal flow algorithm (see Methods) and the correlation between these node sortings was quantified. a-d sorting best matched the summed graph sorting (all edge types together). The d-a sorting was negatively correlated with a-d (–0.59). (H) Edge reciprocity between different edge types, i.e., fraction of forward edges that were coincident with different backward edge types.
Fig. 3
Fig. 3. Hierarchical clustering and analysis of brain structure.
(A) Hierarchical clustering of neurons using a joint left-right hemisphere spectral embedding based on connectivity. Clusters were colored based on cell classes (Fig. 1G and fig. S4), but this information was not used for clustering. Clusters were sorted using signal flow. (B) Example clusters with intracluster morphological similarity score using NBLAST (see Methods). (C) Adjacency matrix of the brain sorted by hierarchical cluster structure. (D) Network diagram of level 4 clusters displays coarse brain structure. Colored pie charts display cell types within clusters. (E) Fraction of a-d hub neurons in level 4 clusters. Cell types of each cluster are depicted on the x-axis and annotated to match clusters in (D). Hubs were defined as having ≥20 in- or out-degree (≥20 presynaptic or postsynaptic partners, respectively; based on the mean degree plus 1.5 standard deviations). (F) Cell classes of in-out hubs (a-d). Most neurons were downstream or upstream of the memory and learning center (gray semicircle, MB-related). Note that CN + MB-FBN indicates neurons that were both CNs and MB-FBNs. One pair of pre-DNVNC neurons received direct MBON input. (G) Pathways from SNs to output neurons with 6 or fewer hops, using a pairwise ≥1% input threshold of the a-d graph. Plot displays a random selection of 100,000 paths from a total set of 3.6 million paths.
Fig. 4
Fig. 4. Multimodal sensory integration across the brain.
(A) Morphology of neurons in sensory circuits, identified using multihop a-d connectivity from SNs or ANs. (B) Neuron similarity across sensory circuits using the Dice Coefficient. Most 2nd-order neurons were distinct, whereas 3rd- and 4th-order neurons were progressively more similar between modalities. (C) Cell classes in each sensory circuit. Note that neurons can be shared across sensory modalities within 2nd- or 3rd-order layers. (D) Schematic of a multihop signal cascade, which probabilistically propagates signal polysynaptically from a user-defined source and endpoint based on synaptic weights between neurons. (E) Signal cascades from sensory modalities to brain output neurons, DNsVNC. The number of hops between these input and output neurons was quantified. (F) The number of pathways with different lengths was quantified from individual sensory modalities to individual DNsVNC. Most sensory signals propagating to DNsVNC used multiple paths of differing lengths (short, medium, long). (G) Individual neurons were classified as unimodal or multimodal, based on signal cascades from individual sensory modalities. Most brain neurons integrated from multiple sensory types (multimodal), whereas a few integrated from a single modality (unimodal). (H) The distance from sensory input in unimodal or multimodal cells from (G) was quantified. (I) Signal cascades (up to 5 hops) from SNs or ANs of different modalities to the input neurons of the learning and memory center, including dopaminergic neurons (DANs), octopaminergic neurons (OANs), and neurons of unknown neurotransmitters (MBINs). All DANs, 33% of OANs, and 60% of other MBINs received signals from all sensory modalities.
Fig. 5
Fig. 5. Characterization of interhemispheric communication by bilateral and contralateral neurons.
(A) Connectivity between left and right hemispheres, sorted within each hemisphere by the cluster structure. (B) Fraction of contralateral a-d presynaptic sites per neuron. (C) Morphology of ipsilateral, bilateral, and contralateral axon neurons with a-d synaptic distribution (right-side neurons depicted to make contralateral arbors visible). (D) Most bilateral axon neurons synapsed onto homologous neurons in both hemispheres, as indicated by the high cosine similarity of their a-d connectivity to ipsilateral and contralateral downstream partners (left). Three bins of cosine similarity values and the cell type memberships of the downstream partners are displayed (right). (E) Connection probability between left and right cell types using a-d edges. The highest connection probabilities were observed between contralateral neurons in opposite brain hemispheres. (F) Reciprocal loops were observed between homologous left- and right-hemisphere neurons. (G) Sensory signal lateralization per cell class. Blue, neurons that received signals from both hemispheres; orange, neurons that received signals from only one hemisphere. Notably, 46% of DNsSEZ were lateralized (using either 8-hop or 5-hop cascades).
Fig. 6
Fig. 6. Comprehensive recurrent pathways through the brain.
(A) Schematic of signal cascades starting from each cluster. (B) Signal cascades originating at each level-7 cluster (along the diagonal) travel in both forward (above the diagonal) and backward (below the diagonal). Signal cascades were based on a-d connectivity and contained 2 hops maximum to restrict analysis to the lower bound of backward signals. (C) Number of clusters or single cells that received cascade forward or backward signals from clusters or single cells within clusters, respectively. (D) Recurrence in brain neurons. Polysynaptic downstream partners of each brain neuron were identified with a-d cascades (up to 5 hops). Recurrent partners sent multihop signal back to the source neuron, forming a recurrent loop (left), and 41% of brain neurons engaged in at least one such recurrent loop (right). (E) Quantification of recurrent pathways of different length between individual neurons. (F) Recurrence was quantified for each cell class. (Right) a schematic of the most recurrent cell types in the brain and their relation to conditioned stimulus (CS) and unconditioned stimulus (US) during associative learning. The MBIN category was split into OANs and DAN/MBIN, as they displayed different distributions of recurrence. Note that KC recurrence is so low that the violin plot is not visible. (G) Recurrent partners of individual MBINs are reported (i.e., all downstream partners, using 5-hop cascades, that send recurrent signals back), including those of dopaminergic neurons (DANs), octopaminergic neurons (OANs), and MBINs expressing unknown neurotransmitters. (H) Recurrent or parallel efference copy signals from DNsVNC or DNsSEZ using 1- or 2-hop a-d connectivity.
Fig. 7
Fig. 7. Investigation of brain-nerve cord interactions revealed direct connectivity between ascending and descending neurons.
(A) Schematic of the Drosophila larva CNS (i) and how this topology corresponds to different body segments (ii), involved in a diverse set of behaviors (iii). (B) Each row represents an individual DNVNC pair with its associated upstream and downstream a-d connectivity in the brain and its projections to the rest of the CNS. Upstream and downstream partner plots (i, iii) depict the fraction of cell types 1 and 2 hops from each DNVNC (color legend, bottom). **, indicates one DNVNC pair had no strong 2nd-order partners in the brain. The projectome plot (ii) reports the number of DNVNC presynaptic sites in each CNS region. Candidate behaviors are suggested based on known behaviors described in (A, iii). DNsVNC were grouped either by candidate behavior or level 7 clusters (iv). These independent groupings were highly correlated (Cramer's V Correlation Coefficient = 0.58). (C) Schematic of common recurrent and efference copy a-d pathways observed in the brain with a focus on DNVNC connectivity. (D) Avenues of interaction between the brain and VNC, DNsVNC, and ANs, focused on the A1 segment. (E) Premotor neuron layers in A1. Layers are identified based on a pairwise 1% a-d input threshold (left). Number of interneurons and ANs in each layer are reported (right). DNVNC targets refer to A1 neurons postsynaptic to a DNVNC. (F) Sensory layers in A1. Number of interneurons (green) and ANs (blue) are reported for each sensory layer and location of DNVNC targets (red). (G) Connection probability (a-d) between DNsVNC and A1 cell types, and between ANsA1 and brain output neurons. (H) A-d motifs involving DNsVNC and ANs in A1. The simplest version of each motif is depicted above, but motifs involving 3, 4, and 5 nodes were also assayed, which contained additional A1 interneurons or preoutput neurons in the brain. (I) All zigzag motifs observed. Each bar represents the number of neurons in each type and lines represent paths originating and ending at individual cells in each category. (J) A zigzag motif with previously characterized DNsVNC on either side. This motif starts at PDM-DN, whose acute stimulation elicits a stopping behavior, and ends at MDN, whose acute stimulation causes animals to back up. Stop-backup is a common behavioral sequence observed in the Drosophila larva.

Comment in

References

    1. Denk W, Briggman KL, Helmstaedter M. Structural neurobiology: Missing link to a mechanistic understanding of neural computation. Nat Rev Neurosci. 2012;13:351–358. doi: 10.1038/nrn3169. - DOI - PubMed
    1. Bargmann CI, Marder E. From the connectome to brain function. Nat Methods. 2013;10:483–490. doi: 10.1038/nmeth.2451. - DOI - PubMed
    1. White JG, Southgate E, Thomson JN, Brenner S. The structure of the nervous system of the nematode Caenorhabditis elegans. Philos Trans R Soc B. 1986;314:1–340. doi: 10.1098/rstb.1986.0056. - DOI - PubMed
    1. Ryan K, Lu Z, Meinertzhagen IA. The CNS connectome of a tadpole larva of Ciona intestinalis (L.) highlights sidedness in the brain of a chordate sibling. eLife. 2016;5:353–356. doi: 10.7554/eLife.16962. - DOI - PMC - PubMed
    1. Verasztó C, et al. bioRxiv. 2020:2020.08.21.260984. doi: 10.1101/2020.08.21.260984. Preprint. - DOI

LinkOut - more resources