. 2023 Mar 10;379(6636):1010-1015.
doi: 10.1126/science.ade2676. Epub 2023 Mar 9.

Direct observation of motor protein stepping in living cells using MINFLUX

Affiliations

Direct observation of motor protein stepping in living cells using MINFLUX

Takahiro Deguchi et al. Science. .

Abstract

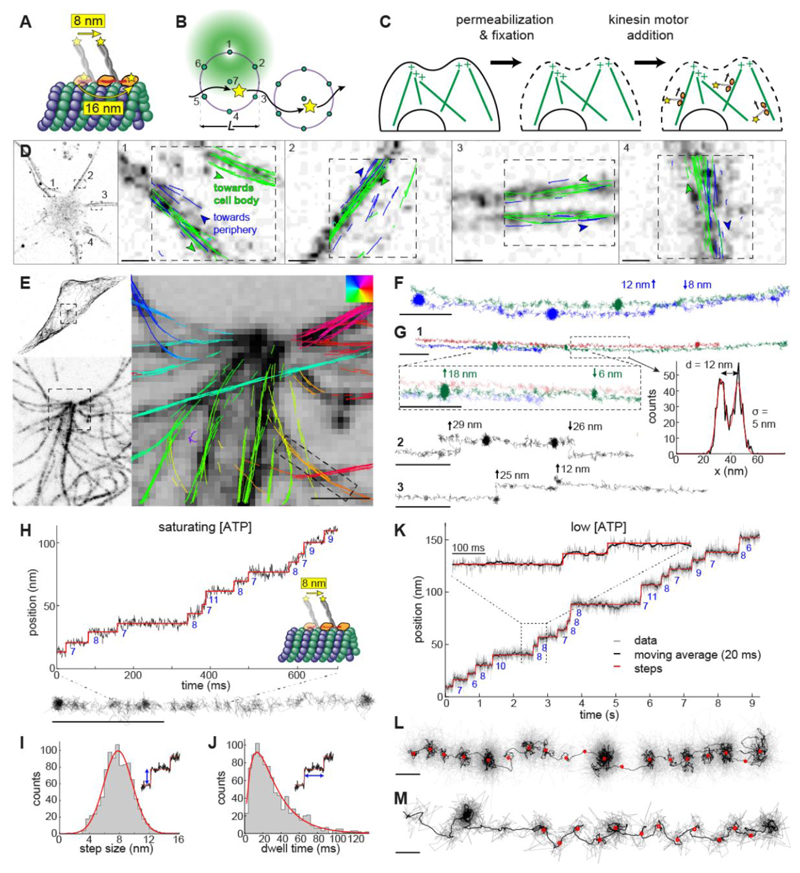
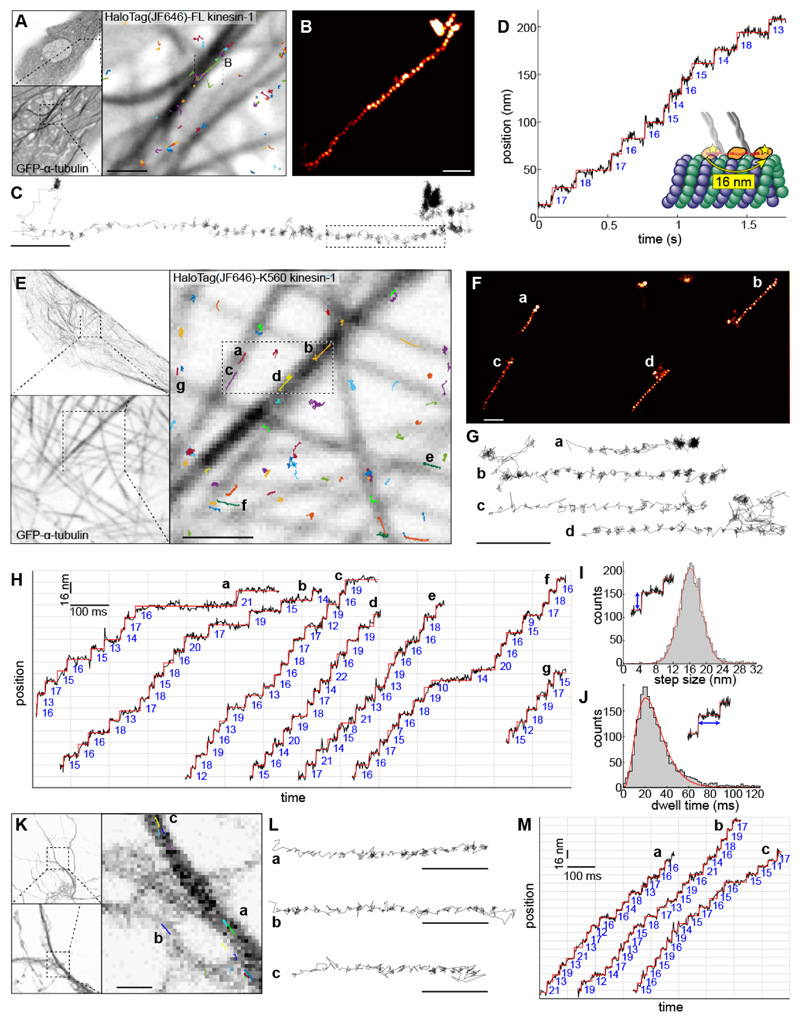
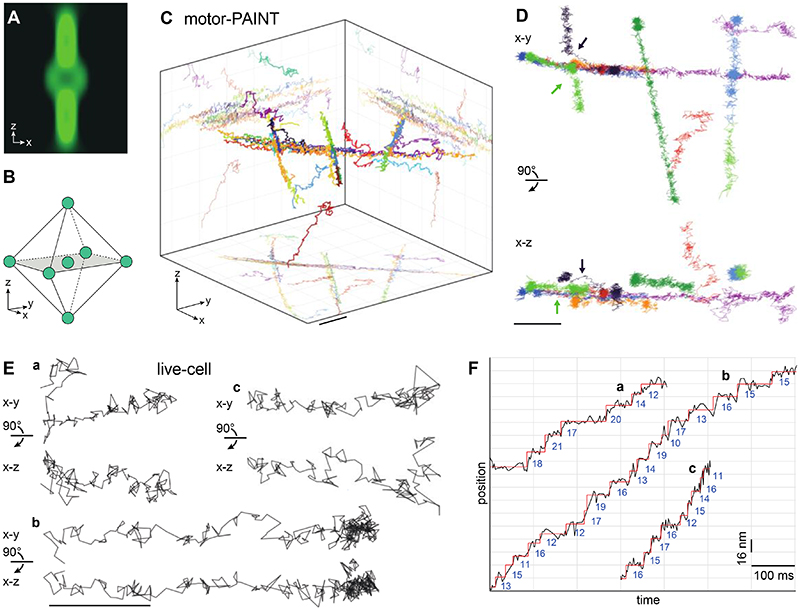
Dynamic measurements of molecular machines can provide invaluable insights into their mechanism, but these measurements have been challenging in living cells. Here, we developed live-cell tracking of single fluorophores with nanometer spatial and millisecond temporal resolution in two and three dimensions using the recently introduced super-resolution technique MINFLUX. Using this approach, we resolved the precise stepping motion of the motor protein kinesin-1 as it walked on microtubules in living cells. Nanoscopic tracking of motors walking on the microtubules of fixed cells also enabled us to resolve the architecture of the microtubule cytoskeleton with protofilament resolution.


Conflict of interest statement

Competing interests:

The authors declare that they have no competing interests.

Figures

Figure 1
Figure 1. MINFLUX tracking of kinesin-1 in fixed cells.
(A) Kinesin-1 walks on microtubules (MTs) in a hand-over-hand manner. The apparent step size is 8 nm when the label is attached to the C-terminal tail domain and 16 nm when it is attached to the N-terminal motor domain. (B) 2D MINFLUX tracking of a single molecule. A donut beam probes seven positions around a fluorophore to determine its location with nanometer precision. The scan pattern is iteratively centered on the fluorophore during tracking. (C) Motor-PAINT approach to track kinesin in fixed cells. Cells are first permeabilized to extract cell contents and then gently fixed to preserve MTs. Purified fluorescently labeled kinesins (DmKHC (1-421)-SNAP-tag-6xHis) are added and tracked as they walk towards the plus-ends of the MTs (movie S1). (DM) MINFLUX motor-PAINT in fixed cells. (D) Confocal images of a neuron and overlaid kinesin trajectories in four neurites. Most of the neurites show kinesin trajectories in both directions, i.e. towards (green) and away (blue) from the soma, as expected for dendrites. (E) Confocal microscopy images of GFP-α-tubulin in U2OS cells showing what appears to be a centrosome and overlaid kinesin trajectories with color-coded walking directions. (F) Tracks as indicated in (E) show side-stepping. (G) Tracks as close as 12 nm are clearly resolved and display kinesin switching laterally between neighboring MTs or protofilaments (movie S2). (H) Representative track and the corresponding time versus position plot at saturating ATP concentrations (>1 mM, here 6 mM), showing 8 nm walking steps. (I) Histogram of step size at saturating ATP concentrations from 7 experiments, 49 tracks, and 956 steps and Gaussian fit (7.8 nm ± 2.7 (std) ± 0.09 nm (sem); red line). (J) Dwell time histogram and fit with a convolution of two exponential functions (average dwell time of 30.8 ms; red line). (K, L and movie S3) A representative track at low ATP concentrations (10 μΜ) and a corresponding time versus position, raw data (gray), and 20 ms running mean (black), clearly showing 8 nm walking steps. (M, fig. S2A, E and movie S4) A representative track showing a zigzag trajectory, indicating an asymmetric arrangement of the label within a kinesin molecule (see fig. S3 for additional examples). Scale bars: 10 nm (L, M), 100 nm (F, G, H), 1 μm (D, E).
Figure 2
Figure 2. MINFLUX tracking of kinesin-1 in live cells.
(A - D) Tracking of full-length kinesin-1 labeled N-terminally with a HaloTag bound to JF646 in live U2OS cells. (A) Confocal images of GFP-α-tubulin in untreated live U2OS cells, and overlaid full-length human kinesin-1 trajectories. (B) A kinesin-1 track where the localizations are rendered as a super-resolution image, in the region indicated in (A). (C) A line plot connecting each localization. (D) Time versus position plot of the highlighted portion of the track in (C), showing steps of 16 nm. (E - J) Tracking of truncated kinesin-1 (HaloTag-K560) in Taxol-treated live U2OS cells. (E) Confocal images of GFP-α-tubulin and overlaid kinesin-1 tracks. The tracks indicated in (E) rendered as a super-resolution image (F), and line plots connecting each localization (G and movie S9), showing clear walking steps (localization precision: 2 nm; temporal resolution: 1 ms). (H) Time versus position plots of representative kinesin-1 tracks as indicated in (E), showing clear 16 nm stepwise movements. (I) Step size histogram (161 experiments, 330 tracks, and 2887 steps) and a Gaussian fit (16.2 ± 3.8 (std) ± 0.07 (sem) nm). (J) Dwell time histogram, fit with a convolution of four exponential functions (average dwell time of 27.5 ms; red line). (K - M) Tracking of kinesin-1 (HaloTag-K560) in untreated live primary mouse cortical neurons. (K) Confocal images of GFP-α-tubulin and overlaid kinesin-1 tracks. (L) Representative tracks corresponding to those indicated in (K) as line plots and (M) time versus position plots, showing 16 nm stepwise movements (see fig. S2C, G for step size and dwell time histograms). Scale bars: 100 nm (B, C, F, G, L), 1 μm (A, E, K).
Figure 3
Figure 3. 3D MINFLUX tracking of kinesin-1.
(A, B) 3D MINFLUX tracking. (A) A 3D donut beam probes the intensity at (B) seven three-dimensionally distributed positions around a fluorophore. (C, D) 3D tracking with motor-PAINT in fixed U2OS cells. (C) 3D rendering of kinesin-1 tracks at crossing MTs with a volumetric size of 1.2 μm × 1.2 μm × 1 μm. (D) Selected tracks from (C) in top and side views, including ascending and descending trajectories, and two trajectories in which motors switch MTs (arrows). (E, F) 3D tracking in live cells. (E) Representative kinesin-1 tracks in live U2OS cells in top and side views, showing stepwise movements both in the x-y plane and along the z-axis (see fig. S2D, H for histograms, fig. S9 confocal overview images and movie S10). (F) Position versus time plots of the tracks from (E), showing 16 nm steps. Scale bars: 100 nm (E), 200 nm (C, D).

References

    1. Howard J, Hudspeth AJ, Vale RD. Movement of microtubules by single kinesin molecules. Nature. 1989;342:154–158. - PubMed
    1. Mehta AD, Rock RS, Rief M, Spudich JA, Mooseker MS, Cheney RE. Myosin-V is a processive actin-based motor. Nature. 1999;400:590–593. - PubMed
    1. Shingyoji C, Higuchi H, Yoshimura M, Katayama E, Yanagida T. Dynein arms are oscillating force generators. Nature. 1998;393:711–714. - PubMed
    1. Svoboda K, Schmidt CF, Schnapp BJ, Block SM. Direct observation of kinesin stepping by optical trapping interferometry. Nature. 1993;365:721–727. - PubMed
    1. Sudhakar S, Abdosamadi MK, Jachowski TJ, Bugiel M, Jannasch A, Schäffer E. Germanium nanospheres for ultraresolution picotensiometry of kinesin motors. Science. 2021;371:eabd9944. - PubMed

LinkOut - more resources