. 2023 Mar 10;379(6636):1043-1049.
doi: 10.1126/science.ade0004. Epub 2023 Mar 9.

High level of novelty under the hood of convergent evolution

Affiliations

High level of novelty under the hood of convergent evolution

Steven M Van Belleghem et al. Science. .

Abstract

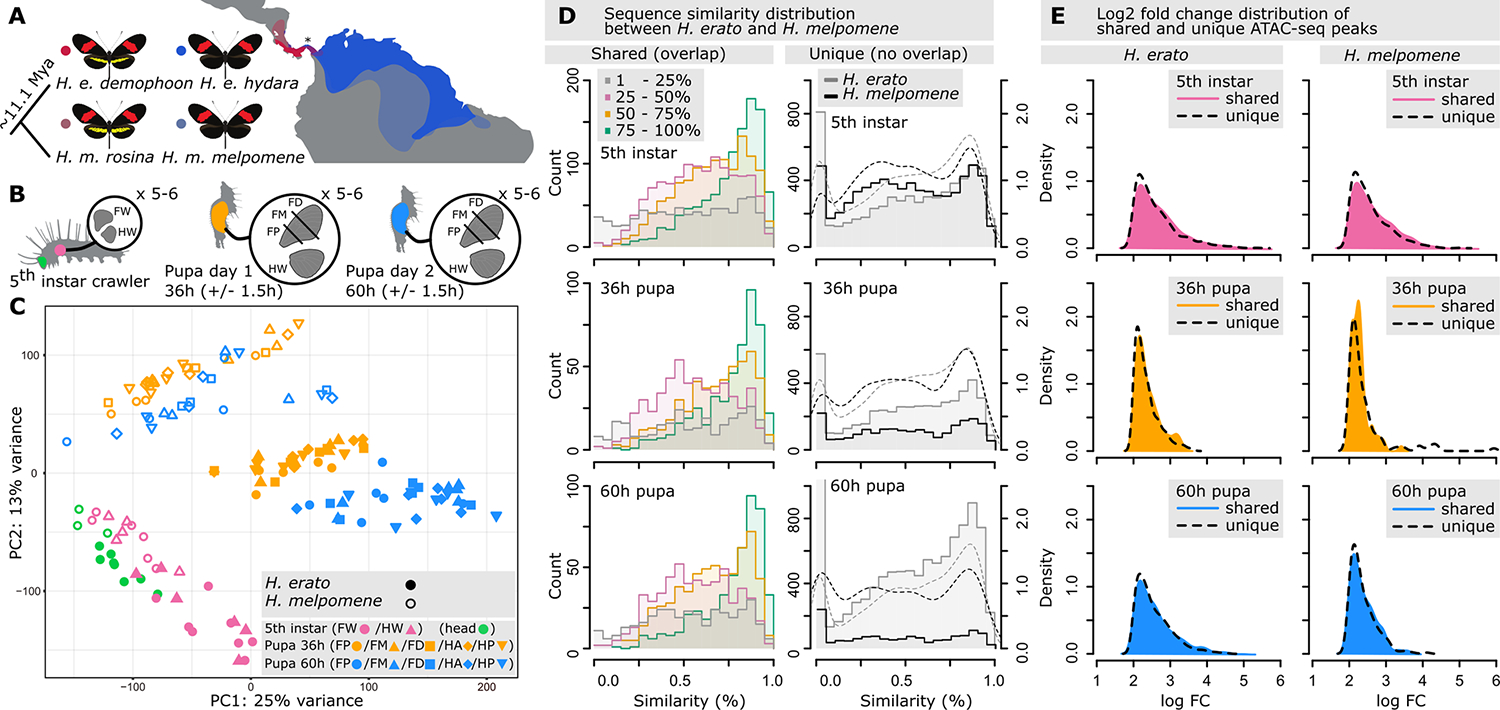
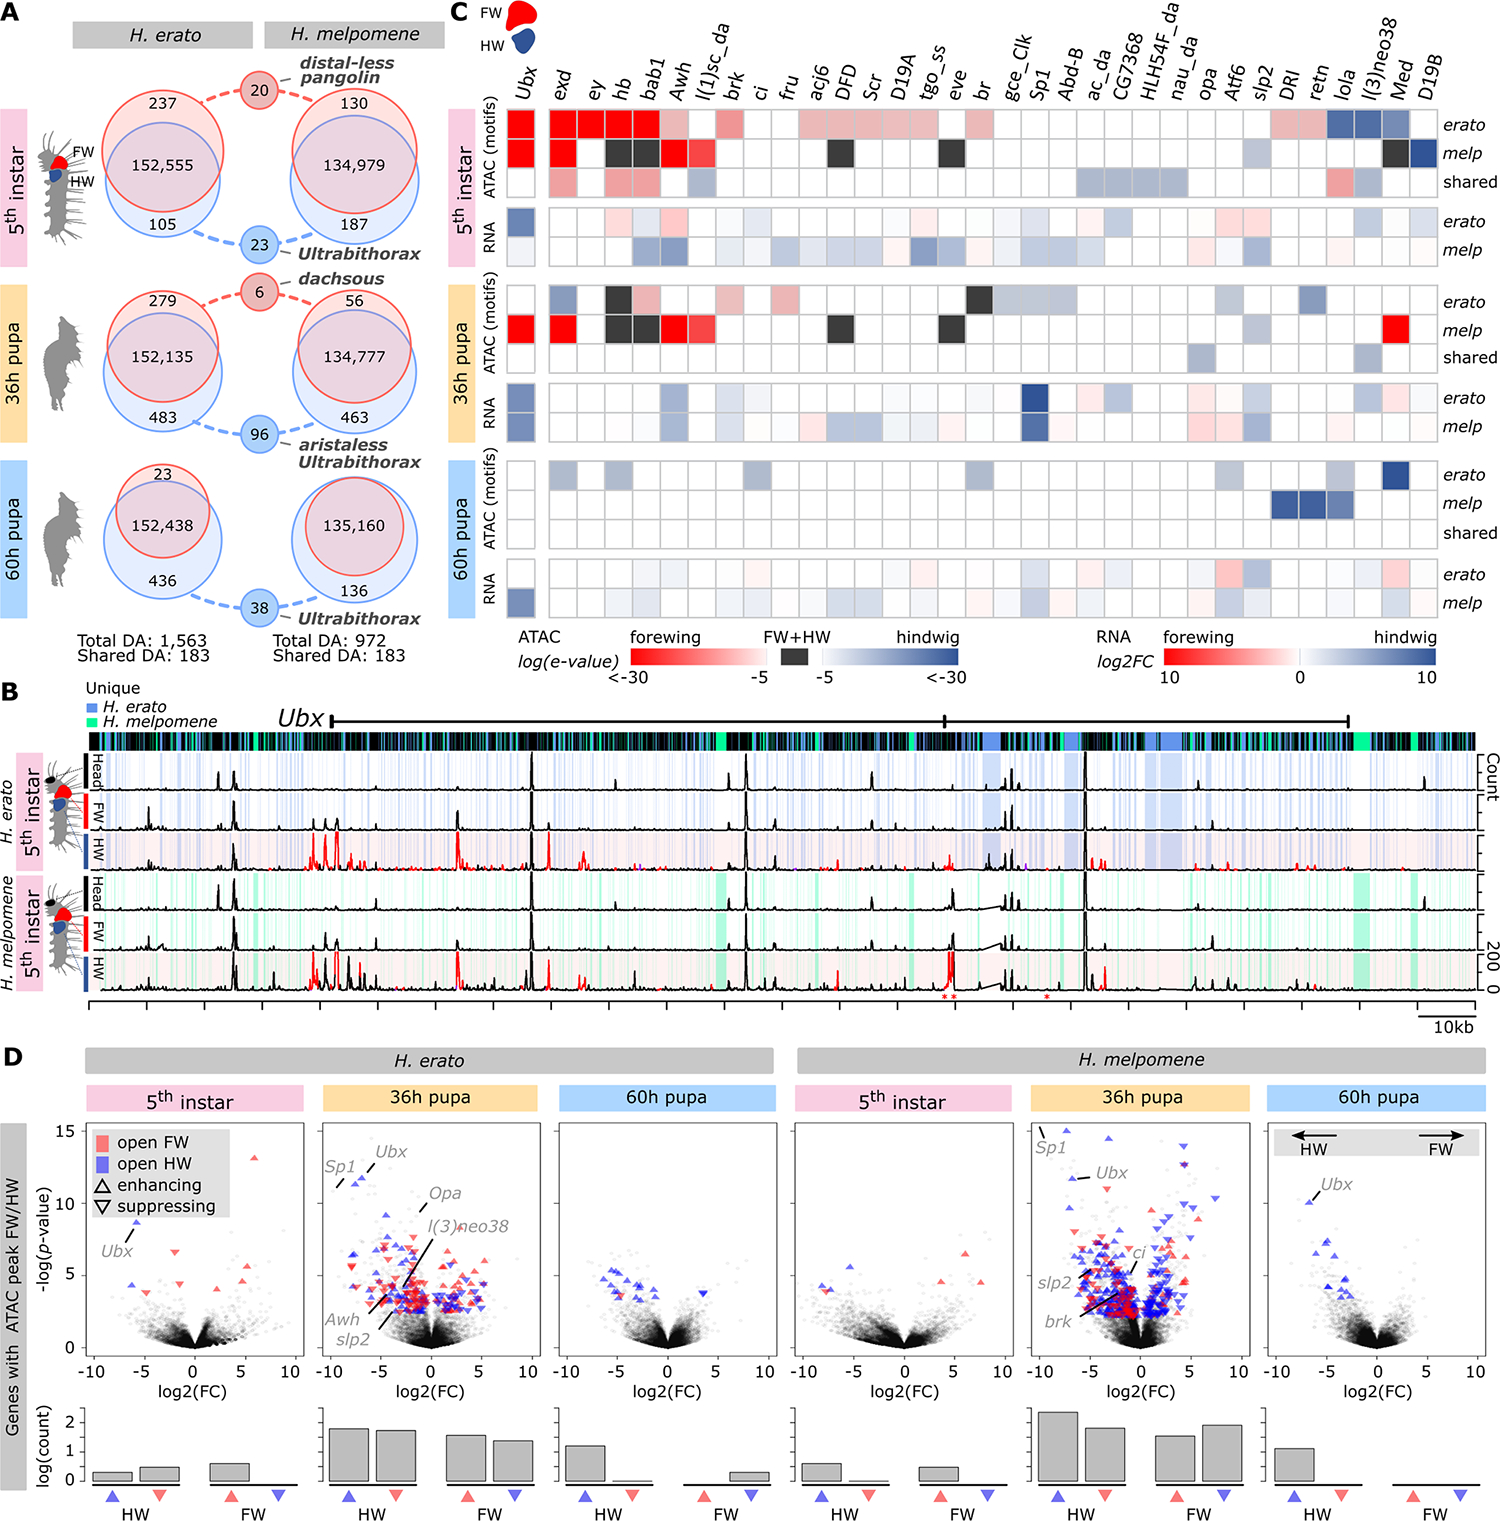
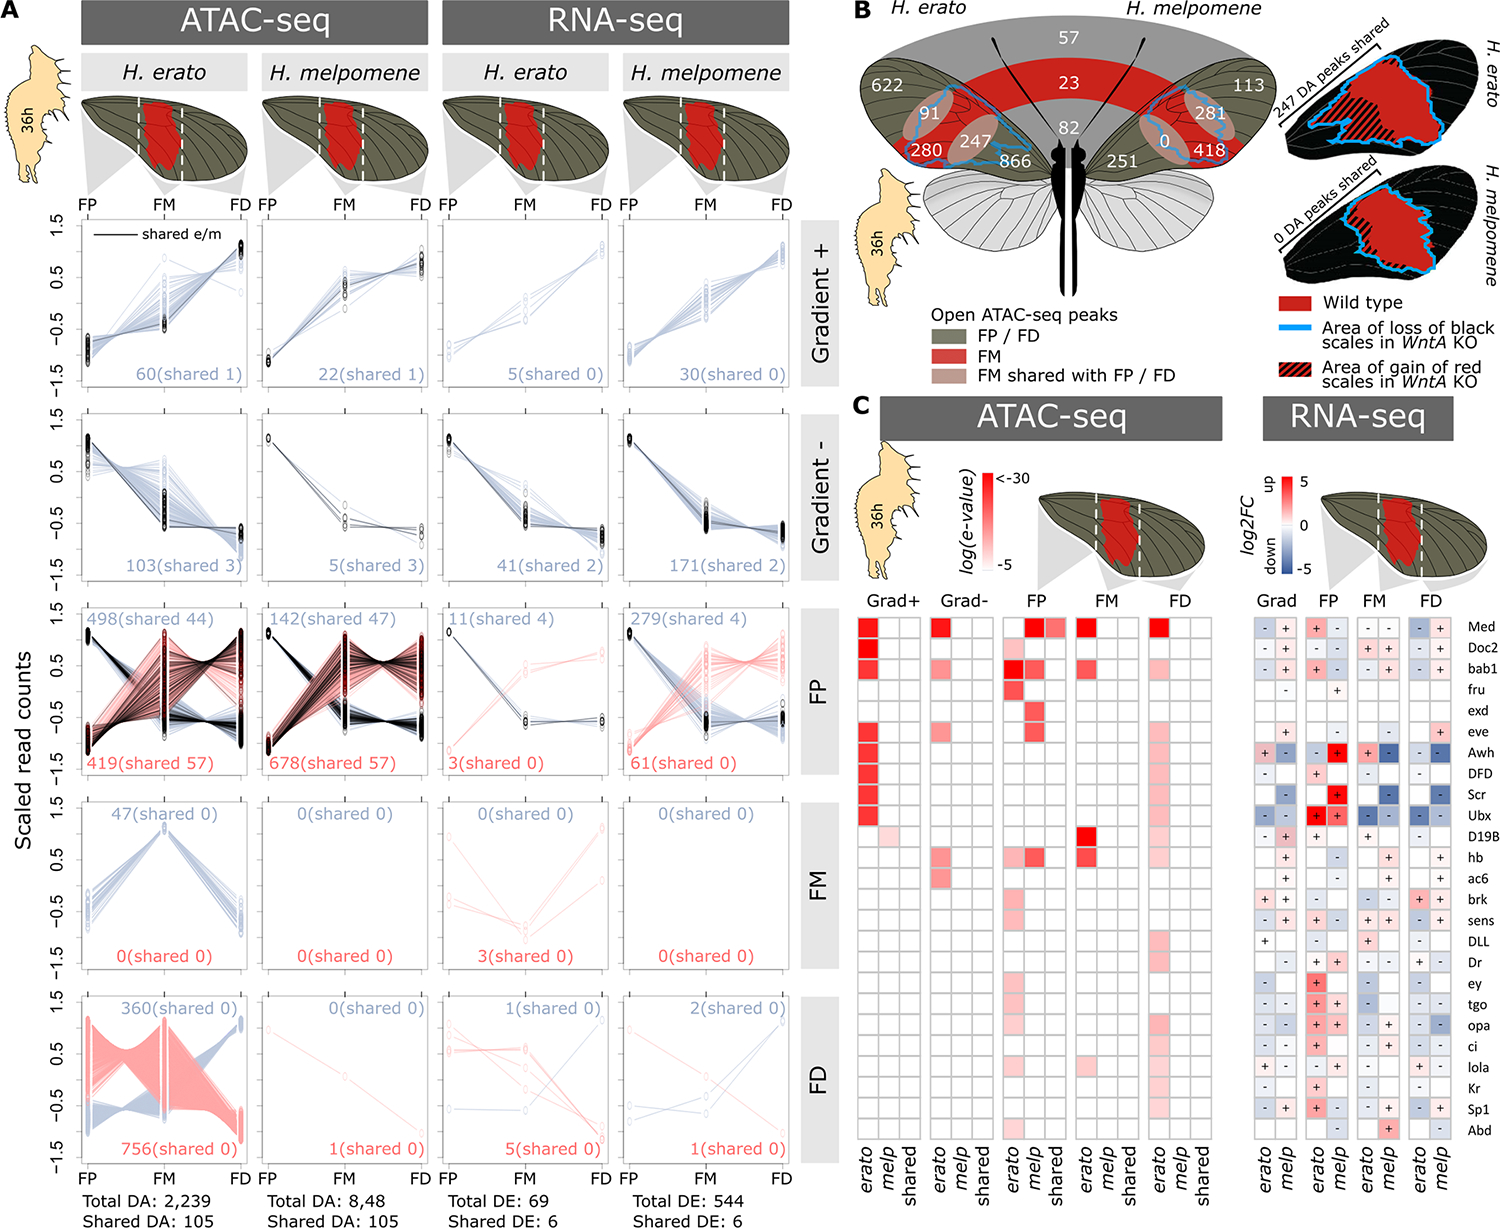
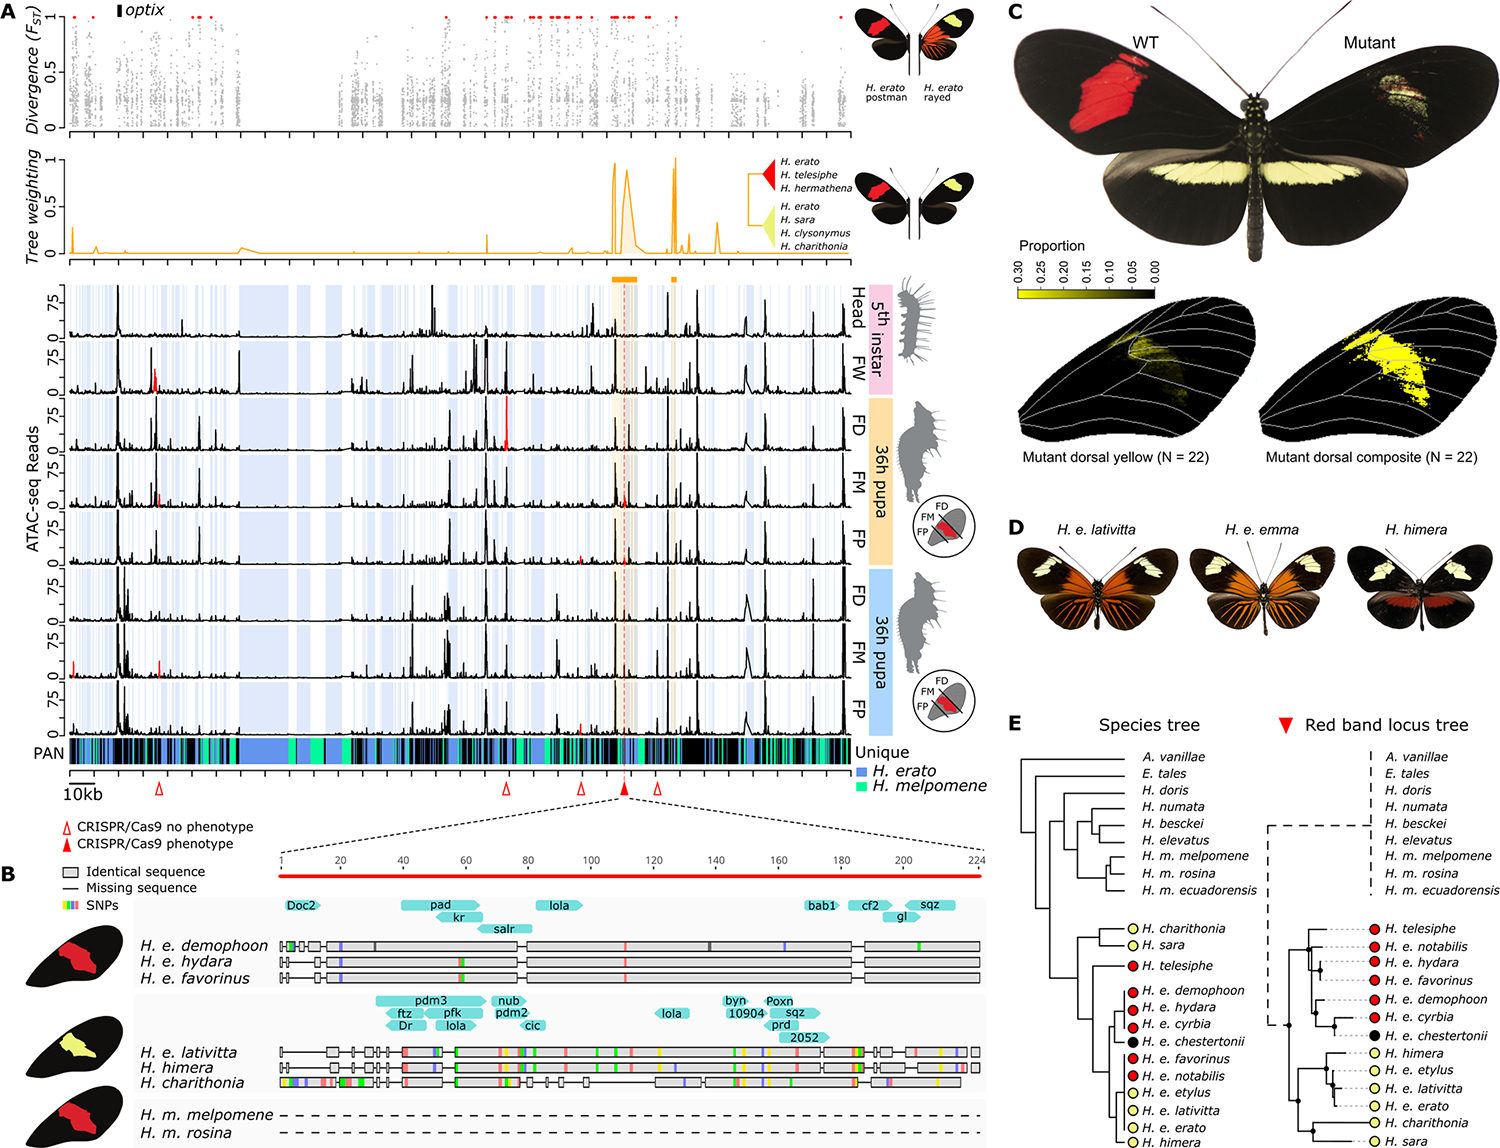
Little is known about the extent to which species use homologous regulatory architectures to achieve phenotypic convergence. By characterizing chromatin accessibility and gene expression in developing wing tissues, we compared the regulatory architecture of convergence between a pair of mimetic butterfly species. Although a handful of color pattern genes are known to be involved in their convergence, our data suggest that different mutational paths underlie the integration of these genes into wing pattern development. This is supported by a large fraction of accessible chromatin being exclusive to each species, including the de novo lineage-specific evolution of a modular optix enhancer. These findings may be explained by a high level of developmental drift and evolutionary contingency that occurs during the independent evolution of mimicry.


Figures

Fig. 1.
Fig. 1.. Sampling of chromatin accessibility (ATAC-seq) data and architecture of specific and shared chromatin landscape between H. erato and H. melpomene.
(A) Geographic distribution of red-banded H. erato and H. melpomene postman morphs used in this study. The populations of H. erato demophoon and H. melpomene rosina have a red forewing band and a yellow hindwing bar and admix with, respectively, H. erato hydara and H. melpomene melpomene that lacks the yellow hindwing bar. Samples come from reared morphs of Panama indicated with an asterisk (*). (B) Tissue sampling of fifth-instar head, forewing (FW), and hindwing (HW), and 36-hour pupal (day 1) and 60-hour pupal (day 2) FW sections (FP, FW posterior; FM, FW medial; FD, FW distal) and HW. (C) Principal components analysis (PCA) of ATAC-seq count values for peaks with at least 25% overlap between species. (D) Sequence similarity distribution between H. erato and H. melpomene for shared (left, ≥1-bp overlap, with overlapping ranges investigated at 25% intervals) and specific (right, 0-bp overlap) ATAC-seq peaks. Dashed lines indicate density distributions. (E) Log2-fold changes of shared (colored) and specific (dashed lines) ATAC-seq peaks that were differentially more accessible at a developmental time point in H. erato and H. melpomene.
Fig. 2.
Fig. 2.. Forewing and hindwing identity observed from gene expression and chromatin landscape.
(A) Venn diagrams show the differentially accessible (DA) ATAC-seq peaks between the fore- and hindwings in H. erato and H. melpomene. Circles connected with dashed lines indicate how many of these wing-specific ATAC-seq peaks are shared between the two species (50% reciprocal overlap). (B) ATAC-seq profile near the Ubx gene in fifth-instar caterpillars. Blue and green shading indicate sequence that is specific to H. erato and H. melpomene, respectively. Peaks in red are significantly more accessible in the hindwing compared with forewing near Ubx and indicate the expected conserved homology at this gene. Asterisks (*) indicate peaks that are shared between species but significantly differentially accessible. (C) TF motifs enriched in differentially accessible ATAC-peaks between fore- and hindwing and their RNA expression levels. Log(e-value) indicates the significance level of the enrichment signal, with red and blue indicating higher enrichment in the fore- and hindwing, respectively, and black indicating enrichment in both fore- and hindwing. Log2FC indicates the expression level relative to the alternative wing. (D) Gene expression volcano plots with differentially expressed genes that have a differentially accessible ATAC-seq peak nearby. Red and blue indicate open ATAC-seq peak in fore- or hindwing, respectively. Upward and downward triangles indicate the enhancing or suppressing effect of the ATAC-seq peak. Significantly differentially expressed TFs with significant motif enrichment signal are indicated in gray. The bar plots show the counts of the enhancing and suppressing ATAC-seq peaks in fore- and hindwing.
Fig. 3.
Fig. 3.. Chromatin accessibility and gene expression in 36-hour pupa forewing sections.
(A) Differentially accessible (DA) ATAC-seq peaks between forewing sections in H. erato and H. melpomene. ATAC-seq peaks are either significantly open (black lines) or closed (dark red lines) in FP, FM, FD, or a gradient + to − (increasing or decreasing accessibility from the proximal to distal wing section). Green lines indicate ATAC-seq peaks that are considered shared between H. erato and H. melpomene. For each comparison, we present the total and shared count numbers. (B) Numbers are differentially accessible ATAC-seq peaks in the wing sections. In contrast to (A), these numbers are obtained by pairwise comparisons between wing sections. Numbers at the boundaries of wing sections indicate peaks with shared differential accessibility compared to the other wing section. Numbers in the middle of the wings indicate peaks identified as shared between H. erato and H. melpomene (50% reciprocal overlap). Wings on the right show the wild-type phenotypes of H. erato and H. melpomene, with the blue lines indicating the extent of red scale development (and optix expression) in the WntA CRISPR-Cas9 KO. Numbers next to the wings represent DA peaks between FP or FM and FD in H. erato and H. melpomene, respectively. (C) TF motif enrichment (left) for differentially accessible ATAC-peaks between wing sections and expression of associated TFs (right). Log(e-value) indicates the significance level of the enrichment signal, and log2FC indicates the expression level relative to all other sections.
Fig. 4.
Fig. 4.. Key regulatory switch of red forewing band development.
(A) Divergence [Fixation index (FST)], phylogenetic association (tree weighting), and ATAC-seq profile of red FW band near the optix gene. Blue shading indicates sequence that is specific to H. erato compared with H. melpomene. Red triangles indicate CRISPR-Cas9 excision targets. The solid red triangle indicates the target for which loss of red scales and gain of yellow scales in the FM section were observed. (B) Zoom-in on the only differentially accessible peak near optix associated with red forewing band. Gray bars and colors indicate aligned nucleotides and single-nucleotide polymorphisms (SNPs), respectively, whereas horizontal lines represent gaps. Blue arrows indicate in silico TF binding sites specific to each haplotype. The dashed lines indicate complete absence of homologous sequence. (C) CRISPR-Cas9 KO phenotype of key regulatory switch. Because of the mosaicism of CRISPR-Cas9 mutants, the complete color pattern transition is represented by the composite analysis of the individual mutant wing phenotypes. (D) Examples of geographic morphs with yellow forewing band phenotypes. (E) Detail of phylogeny of red (red circles) versus yellow (yellow circles) forewing band phenotypes at the key regulatory optix switch. The dashed branch for the outgroup species and H. melpomene indicates complete absence of homologous sequence.

References

    1. True JR, Haag ES, Evol. Dev. 3, 109–119 (2001). - PubMed
    1. Blount ZD, Lenski RE, Losos JB, Science 362, eaam5979 (2018). - PubMed
    1. Van Belleghem SM, Lewis JJ, Rivera ES, Papa R, Curr. Opin. Genet. Dev. 69, 72–81 (2021). - PMC - PubMed
    1. Kratochwil CF et al., Science 362, 457–460 (2018). - PubMed
    1. Roscito JG et al., Nat. Commun. 9, 4737 (2018). - PMC - PubMed

MeSH terms