. 2023 Mar 10;379(6636):1023-1030.
doi: 10.1126/science.abq4822. Epub 2023 Mar 9.

Droplet-based forward genetic screening of astrocyte-microglia cross-talk

Affiliations

Droplet-based forward genetic screening of astrocyte-microglia cross-talk

Michael A Wheeler et al. Science. .

Abstract

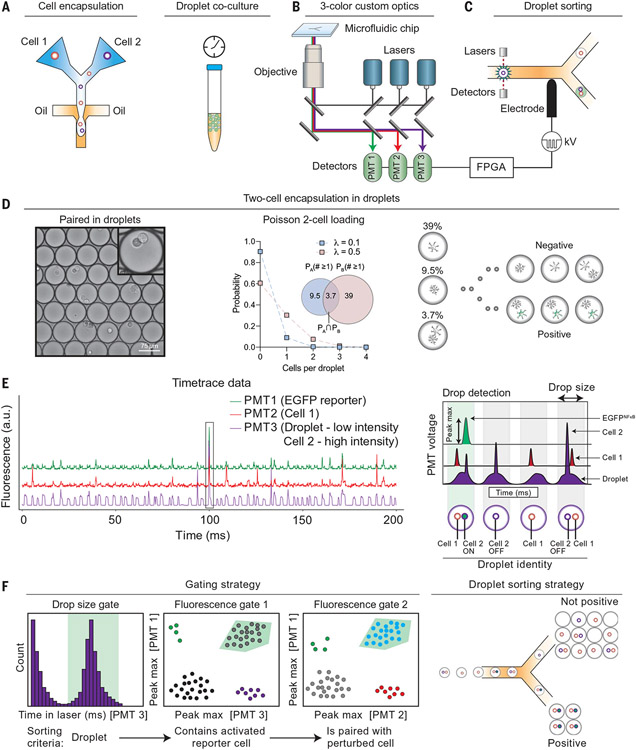
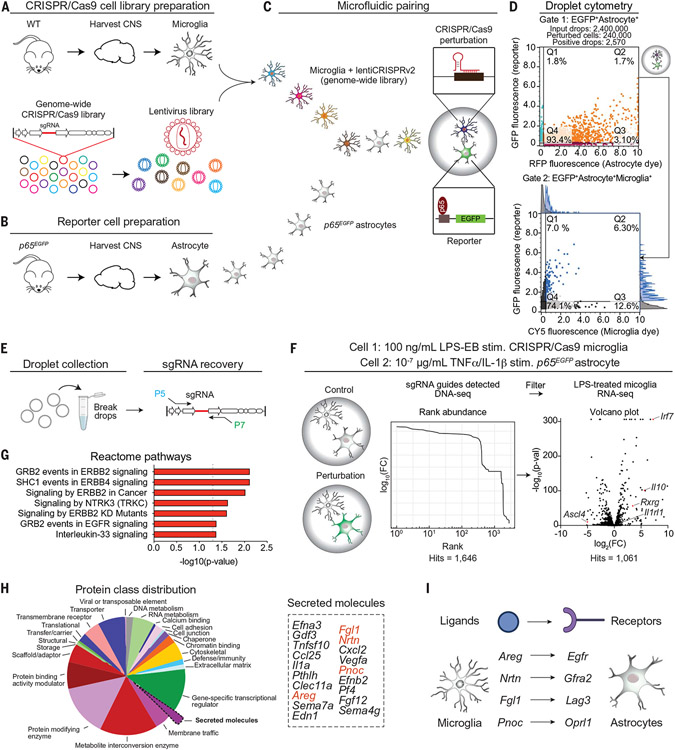
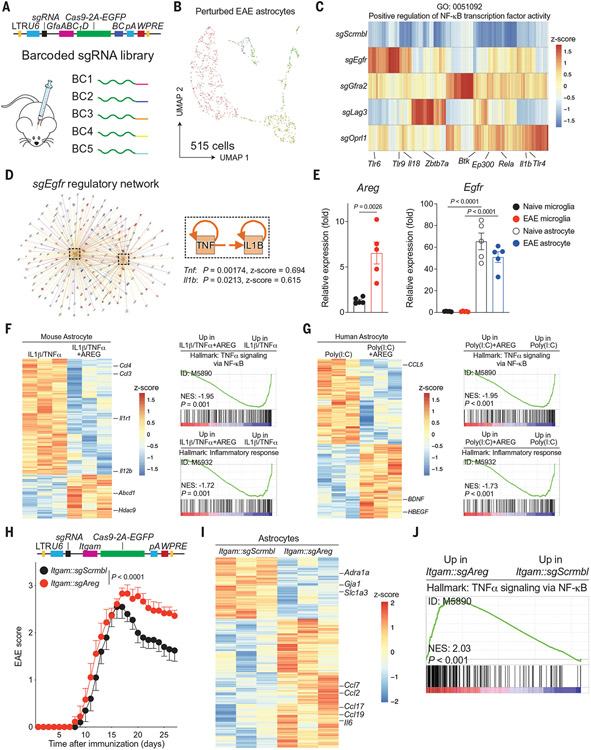
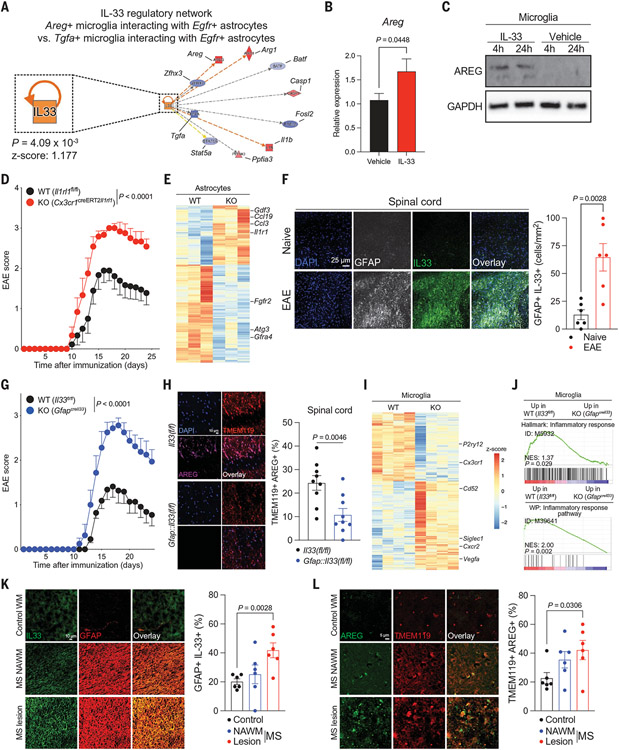
Cell-cell interactions in the central nervous system play important roles in neurologic diseases. However, little is known about the specific molecular pathways involved, and methods for their systematic identification are limited. Here, we developed a forward genetic screening platform that combines CRISPR-Cas9 perturbations, cell coculture in picoliter droplets, and microfluidic-based fluorescence-activated droplet sorting to identify mechanisms of cell-cell communication. We used SPEAC-seq (systematic perturbation of encapsulated associated cells followed by sequencing), in combination with in vivo genetic perturbations, to identify microglia-produced amphiregulin as a suppressor of disease-promoting astrocyte responses in multiple sclerosis preclinical models and clinical samples. Thus, SPEAC-seq enables the high-throughput systematic identification of cell-cell communication mechanisms.


Figures

Fig. 1.
Fig. 1.. Detection of cell–cell interactions in picoliter droplet vessels.
(A) Cells are coencapsulated by using microfluidics inside picoliter water-in-oil droplets. (B and C) (B) Cocultured cell pairs are monitored on the basis of their fluorescence by using a three-color custom droplet cytometric system and (C) sorted with dielectrophoresis to isolate cell–cell pairs. FPGA, field programmable gate array; PMT, photomultiplier tube. (D) Cells cocultured within droplets remain isolated from neighboring cell pairs and interact through direct contact and/or secreted soluble factors. Cell loading determines the probability that a drop contains each cell type; cell loading was set to favor a single cell containing a CRISPR-Cas9 perturbation. (E) Droplet cytometric time trace data showing presence of droplet (PMT3, low sustained intensity), cell 2 (PMT 3, sharp intensity peak), EGFP reporter (PMT1), and cell 1 (PMT2). An inert CY5 tracer dye was added to detect and gate drops of the correct size. The schematic (right) shows possible combinations of cell–cell pairings and their corresponding droplet fluorescence traces. a.u., arbitrary unit. (F) Gating strategy showing how cell–cell pairs were identified by sequentially gating drops that (i) were the correct size, (ii) contained an activated reporter cell (astrocyte), and (iii) were paired with the desired cell–cell pair (astrocyte–microglia) and sorted such that only drops containing two-cell combinations were studied.
Fig. 2.
Fig. 2.. SPEAC-seq identifies microglial factors that limit astrocyte proinflammatory responses.
(A) Microglia were isolated from wild-type (WT) B6 mice and transduced with a pooled genome-wide lentiviral CRISPR-Cas9 library (78,637 sgRNA sequences) by low-MOI spinfection to generate a single mutation in each cell. (B) Astrocytes were isolated from p65EGFP reporter mice and paired in droplets with a single CRISPR-Cas9–perturbed microglial cell for 24 hours. (C) CRISPR-Cas9–based perturbations in microglia that resulted in NF-κB activation in astrocytes after 24 hours were screened by using a high-throughput microfluidic fluorescence-activated cell sorting platform. (D) Identification of activated cell pairs after 24 hours by using a three-color, dual-gating strategy. Representative gating strategy: The upper gate identifies EGFP+ astrocytes (activated NF-κB), and the bottom gate identifies EGFP+ primary astrocytes paired with a single perturbed microglial cell. Fluorescence histograms in the bottom droplet cytometry panel show the distribution within each channel. RFP, red fluorescent protein. (E) Droplet sorting of cell pairs, genomic DNA extraction, and sgRNA recovery through PCR was used to generate a library for Illumina sequencing. (F) Experimental schematic (left). Analysis of guides detected in the genomic DNA of microglia from sorted droplets containing an EGFP+ astrocyte (middle). SPEAC-seq hits were filtered against an RNA-seq database of LPS-activated primary mouse microglia (right). Volcano plot represents expression of LPS treatment relative to vehicle treatment, n = 3 per group. EB, Escherichia coli 0111:B4; FC, fold change. (G) Pathways detected by SPEAC-seq that limit astrocyte NF-κB activation discovered through bioinformatic analysis. (H and I) Analysis of secreted signals perturbed in microglia enriched in SPEAC-seq data (H) and the cognate astrocyte receptors that transduce the signals of several candidate genes (I).
Fig. 3.
Fig. 3.. Microglial AREG limits astrocyte proinflammatory responses.
(A) Construction of a barcoded lentiviral library for in vivo Perturb-seq analysis of candidate astrocyte receptors. (B) UMAP plot of astrocytes captured by Perturb-seq from n = 4 EAE mice. (C) Analysis of NF-κB signaling activation as a function of Perturb-seq–based knockdown of candidate astrocyte receptors. (D) Qiagen IPA network analysis showing that EGFR signaling limits TNFα and IL-1β-driven NF-κB signals. Right-tailed Fisher’s exact test. (E) Egfr and Areg expression determined by qPCR in primary astrocytes and microglia from naïve or EAE mice. n = 5 per group. Unpaired two-tailed t test. (F and G) Analysis of the transcriptional effects of AREG in primary mouse (F) or human (G) astrocytes pretreated with proinflammatory cytokines and recombinant AREG. n = 3 per group. (H) EAE disease course in mice transduced with Itgam::Cas9 lentiviruses coexpressing sgAreg or sgScrmbl. n = 14 sgScrmbl, n = 12 sgAreg mice. Experiment repeated three times. Two-way repeated measures analysis of variance (ANOVA). LTR, long terminal repeat. (I) Volcano plot of differential gene expression analyzed by RNA-seq of astrocytes isolated from EAE mice transduced with Itgam::sgAreg versus Itgam::sgScrmbl. n = 3 mice per group. (J) GSEA preranked analysis of RNA-seq data comparing NF-κB signaling in astrocytes isolated from Itgam::sgAreg versus Itgam::sgScrmbl microglia. NES, normalized enrichment score.
Fig. 4.
Fig. 4.. IL-33-ST2 signaling controls an astrocyte–microglia regulatory circuit.
(A) IL-33 regulates Areg+ microglial interactions with Egfr+ astrocytes determined by RABID-seq during peak EAE. (B and C) IL-33 induces the expression of Areg/AREG in primary microglia. n = 15 to 18 per condition (qPCR). Unpaired two-tailed t test. (D) EAE curve of Cx3cr1::CreERT2Il1rl1 mice (ST2 knockout [KO]) and controls. Two-way repeated measures ANOVA. n = 9 control, n = 6 KO. Experiment repeated three times. (E) Analysis of astrocytes isolated from Cx3cr1::CreERT2Il1rl1 mice by RNA-seq. n = 3 per group. (F) Quantification of IL-33 in GFAP+ astrocytes by immunostaining. n = 6 images from n = 3 mice per group. Unpaired two-tailed t test. (G) EAE curve of GfapIl33 mice and controls. n = 11 control, n = 8 KO. Experiment repeated twice. Two-way repeated measures ANOVA. DAPI, 4',6-diamidino-2-phenylindole; GFAP, glial fibrillary acidic protein. (H) Immunostaining analysis of microglial AREG expression in GfapI133 mice. n = 3 mice per group, n = 9 images. Unpaired two-tailed t test. TMEM, transmembrane protein. (I and J) RNA-seq analyses of microglia isolated from GfapIl33 mice. n = 3 per group. (K) Analysis of IL33+ astrocytes by immunostaining in MS patient CNS samples. n = 3 patients per condition, n = 6 images. Unpaired two-tailed t test. NAWM, normal-appearing white matter; WM, white matter. (L) Analysis of AREG+ microglia by immunostaining in MS patient CNS samples. n = 3 patients per condition, n = 6 images. Unpaired two-tailed t test.

References

    1. Reich DS, Lucchinetti CF, Calabresi PA, N. Engl. J. Med 378, 169–180 (2018). - PMC - PubMed
    1. Han RT, Kim RD, Molofsky AV, Liddelow SA, Immunity 54, 211–224 (2021). - PubMed
    1. Linnerbauer M, Wheeler MA, Quintana FJ, Neuron 108, 608–622 (2020). - PMC - PubMed
    1. Prinz M, Masuda T, Wheeler MA, Quintana FJ, Annu. Rev. Immunol 39, 251–277 (2021). - PMC - PubMed
    1. Sanmarco LM, Polonio CM, Wheeler MA, Quintana FJ, J. Exp. Med 218, e20202715 (2021). - PMC - PubMed

MeSH terms