. 2023 Mar 10;379(6636):996-1003.
doi: 10.1126/science.abm3452. Epub 2023 Mar 9.

Protein-metabolite interactomics of carbohydrate metabolism reveal regulation of lactate dehydrogenase

Affiliations

Protein-metabolite interactomics of carbohydrate metabolism reveal regulation of lactate dehydrogenase

Kevin G Hicks et al. Science. .

Abstract

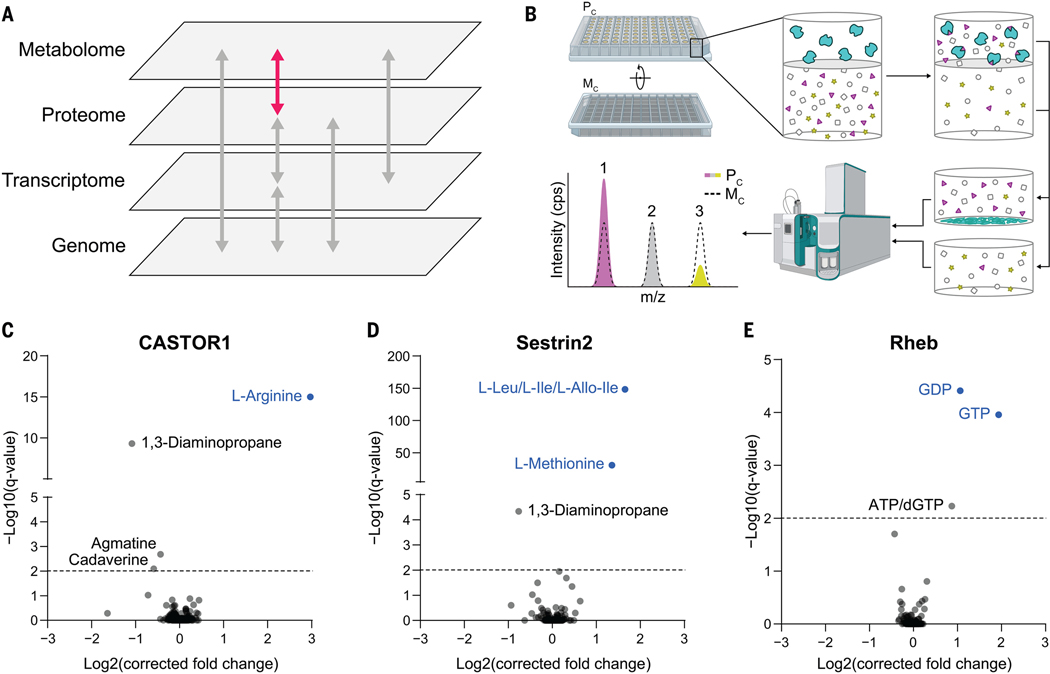
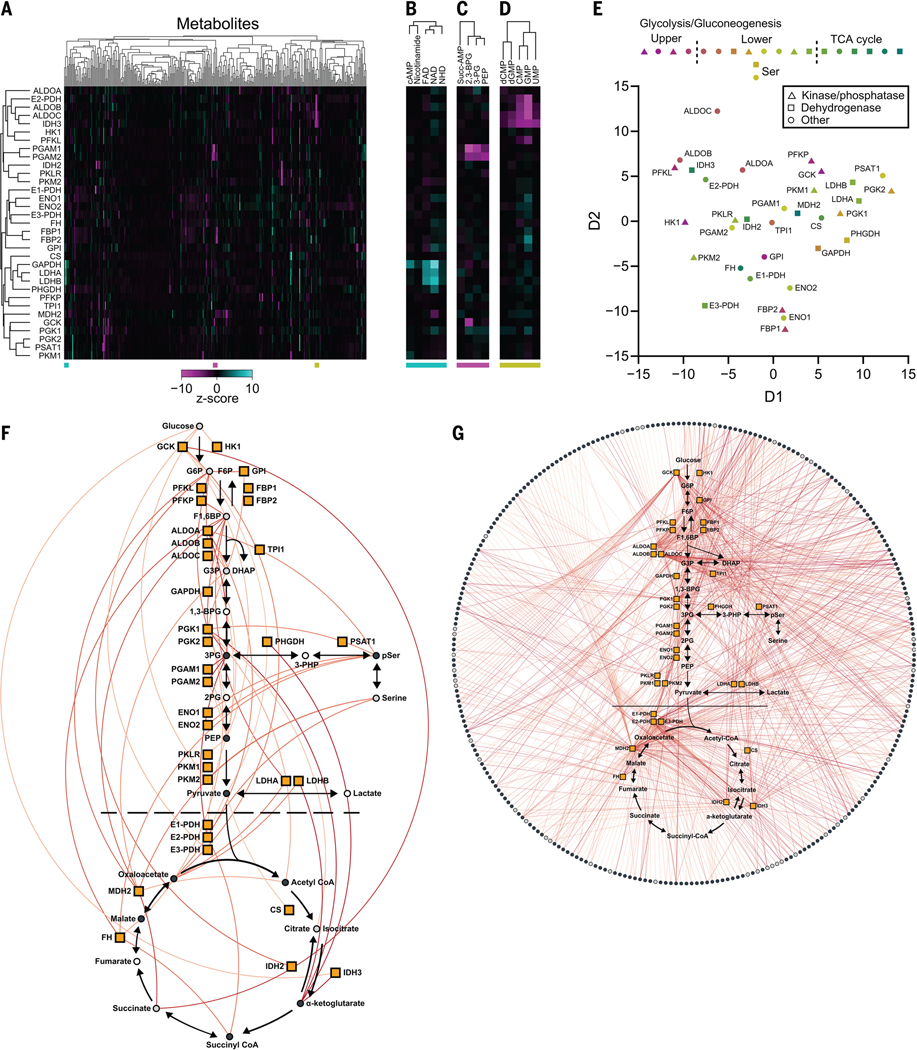
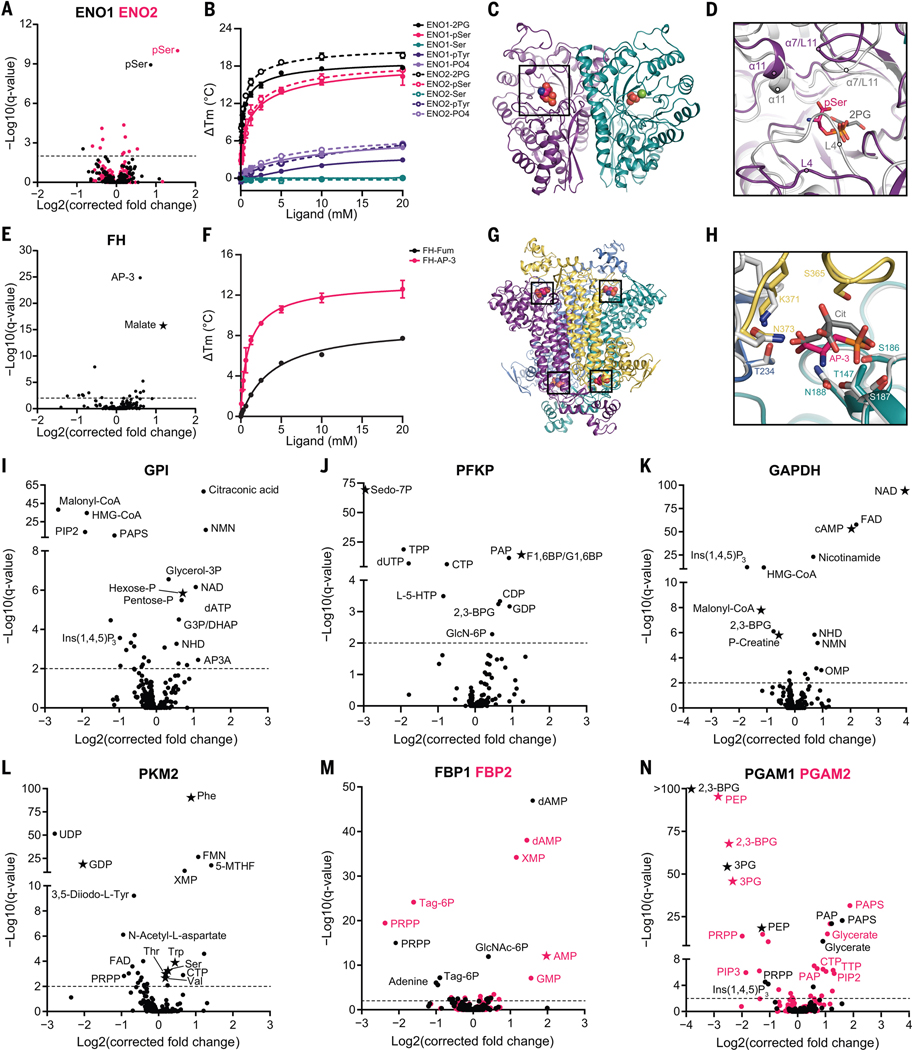
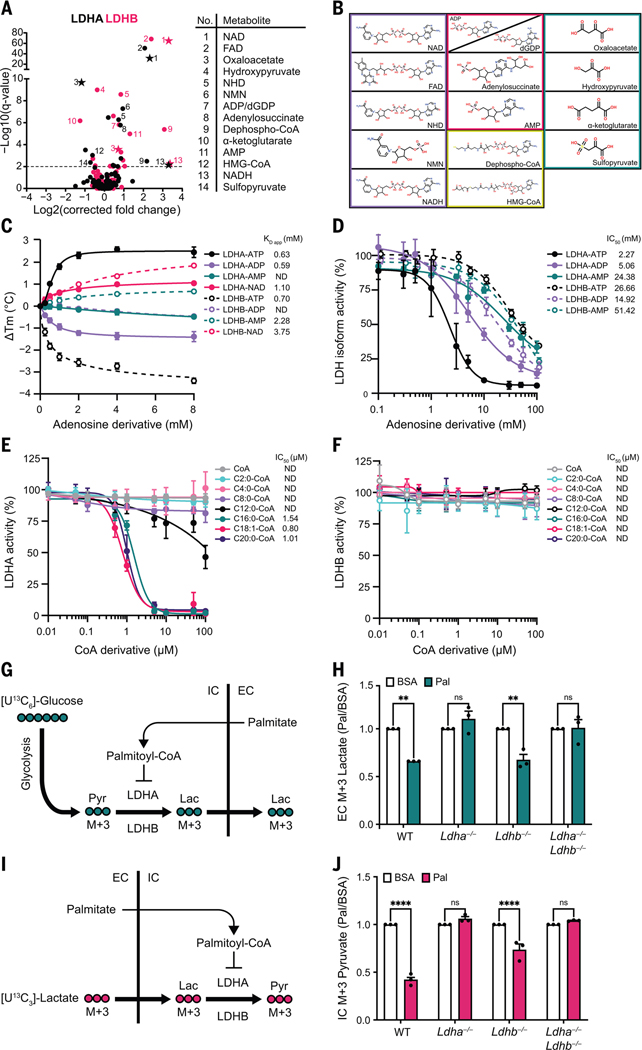
Metabolic networks are interconnected and influence diverse cellular processes. The protein-metabolite interactions that mediate these networks are frequently low affinity and challenging to systematically discover. We developed mass spectrometry integrated with equilibrium dialysis for the discovery of allostery systematically (MIDAS) to identify such interactions. Analysis of 33 enzymes from human carbohydrate metabolism identified 830 protein-metabolite interactions, including known regulators, substrates, and products as well as previously unreported interactions. We functionally validated a subset of interactions, including the isoform-specific inhibition of lactate dehydrogenase by long-chain acyl-coenzyme A. Cell treatment with fatty acids caused a loss of pyruvate-lactate interconversion dependent on lactate dehydrogenase isoform expression. These protein-metabolite interactions may contribute to the dynamic, tissue-specific metabolic flexibility that enables growth and survival in an ever-changing nutrient environment.


Conflict of interest statement

Competing interests: K.G.H. and J.R. are inventors of MIDAS technology that has been licensed to Atavistik Bio, for which K.G.H. is a consultant and J.R. is a founder. F.C. and F.J.S. have financial interest in Furanica, Inc. F.J.S. has financial interest in Creegh Pharma, Inc. S.R.H. is an employee of Calico Life Sciences. All other authors declare that they have no competing interests.

Figures

Fig. 1.
Fig. 1.. MIDAS is a platform for the systematic discovery of PMIs.
(A) Biological systems are organized into domains of information (labeled gray panes). Flow of information within and between these domains is transmitted through direct interactions and underlies biological function (arrows). The MIDAS platform provides PMI discovery (pink arrow). (B) The MIDAS platform is an equilibrium dialysis tandem FIA-MS approach. (Top left and top center) Purified proteins (cyan) are loaded into the protein chamber (Pc) and defined pools of metabolites into the metabolite chamber (Mc), separated by a protein-impermeable dialysis membrane. (Top right) The system is incubated to relative equilibrium. (Bottom right and bottom center) Proteins are removed by precipitation, metabolites in the Pc and Mc are sampled, and the relative abundance of metabolites from both chambers are quantified using FIA-MS. (Bottom left) PMIs are observed as an increase (1) or decrease (3) in metabolite abundance in the Pc relative to the Mc (dotted peak). Metabolites that have equal abundance in the Pc relative to the Mc (2) are defined as noninteracting with the target protein. cps, counts per second; m/z, mass/charge ratio. (C to E) Volcano plots of MIDAS analyses of the mTORC1 regulators CASTOR1, Sestrin2, and Rheb. Significant PMIs are labeled; previously known interactions are blue. All proteins were screened by triplicate equilibrium dialysis and technical triplicate FIA-MS injections. Significant PMIs identified by MIDAS are labeled and have a Q < 0.01 (dotted line).
Fig. 2.
Fig. 2.. The protein-metabolite interactome of human carbohydrate metabolism.
(A) Heatmap representation of MIDAS PMIs of 33 enzymes in human carbohydrate metabolism. Heatmap values are the z-score log2(corrected fold change) for all metabolites in the MIDAS metabolite library on a per-protein basis. Clustering was performed by one minus the Pearson correlation. Positive (cyan) and negative (magenta) metabolite z-score log2(corrected fold change) have a maximum and minimum cutoff of 10 and −10, respectively. MIDAS analysis of all proteins was performed by triplicate equilibrium dialysis and technical triplicate FIA-MS injections. (B to D) Excerpt examples of metabolite clustering from (A). Colored bars (bottom) indicate the location of the extracted heatmaps from (A). (E) Multidimensional scaling (MDS) of 33 human enzymes in carbohydrate metabolism based on their MIDAS PMIs. MDS distance values were generated from the z-score log2(corrected fold change) for all metabolites in the MIDAS metabolite library on a per-protein basis. (F and G) Significant intrapathway (F) and interpathway (G) interactions (colored lines) between metabolites (circles) and 33 enzymes in human carbohydrate metabolism (orange boxes) (plots generated in Electrum). Metabolites with (light gray circles) and without (dark gray circles) isomers in the same screening pool are shown. Metabolites not present in the library (open circles) are also indicated. Significant PMIs identified by MIDAS have a Q < 0.01 and are colored by increasing significance, from light orange to red.
Fig. 3.
Fig. 3.. MIDAS identifies known and previously undescribed metabolite interactions with enzymes from human carbohydrate metabolism.
(A) Volcano plot of MIDAS metabolite interactions with ENO1 (black) and ENO2 (pink). (B) Ligand-induced DSF melting point analysis of ENO1 (solid lines, solid circles) and ENO2 (dotted lines, open circles) with 2PG (black), pSer (pink), serine (Ser; teal), phosphotyrosine (pTyr; purple), and phosphate (PO4; light purple). (C) X-ray crystal structure of the pSer-ENO2 complex [Protein Data Bank (PDB) ID: 7MBH]. pSer (black box), phosphate ions (orange and red spheres), magnesium ion (green sphere), and monomers within the ENO2 dimer (purple and teal) are displayed. (D) Magnified view of the ENO2 active site with pSer (pink) or 2PG (gray) bound (2PG-ENO2; PDB: 3UCC) (53). Secondary structure is labeled in the pSer-ENO2 (purple) and 2PG-ENO2 (light gray) costructures. (E) Volcano plot of MIDAS metabolite interactions with fumarase (FH). (F) Ligand-induced DSF melting point analysis of FH with fumarate (Fum; black) and AP-3 (pink). [(B) and (F)] Line of best fit was determined from triplicate experiments, each with sextuplicate technical replicates using the specific binding and Hill slope equation from GraphPad Prism 9. Means ± SDs are plotted from triplicate experiments. (G) X-ray crystal structure of the AP-3–FH complex (PDB: 7LUB). AP-3 (black boxes) and monomers within the FH tetramer (purple, yellow, teal, and light blue) are shown. (H) Magnified view of the FH active site with AP-3 (pink) or citrate (Cit; gray) bound (Escherichia coli Cit-FH structure, light gray; PDB: 1FUO) (18). Side chains that coordinate the AP-3 interaction with FH are labeled and colored according to FH monomers from (G). (I to N) Volcano plots of MIDAS metabolite interactions with GPI; 6-phosphofructokinase, platelet type (PFKP); GAPDH; PKM2; FBP1 (black) and FBP2 (pink); and PGAM1 (black) and PGAM2 (pink). [(A), (E), and (I) to (N)] Stars indicate a previously known human PMI primarily sourced from BRENDA (https://www.brenda-enzymes.org/index.php). MIDAS analysis of all proteins was performed by triplicate equilibrium dialysis and technical triplicate FIA-MS injections. Specific, significant PMIs identified by MIDAS are labeled (see table S1 for metabolite abbreviations). Significant PMIs have a Q < 0.01 (dotted line). Single-letter abbreviations for the amino acid residues are as follows: A, Ala; C, Cys; D, Asp; E, Glu; F, Phe; G, Gly; H, His; I, Ile; K, Lys; L, Leu; M, Met; N, Asn; P, Pro; Q, Gln; R, Arg; S, Ser; T, Thr; V, Val; W, Trp; and Y, Tyr.
Fig. 4.
Fig. 4.. ATP and long-chain acyl-CoAs inhibit LDH in an isoform-specific manner.
(A) Volcano plots of MIDAS metabolite interactions with LDHA (black) and LDHB (pink). Specific, significant metabolites are numbered and labeled. Stars indicate a previously known human PMI, primarily sourced from BRENDA (https://www.brenda-enzymes.org/index.php). MIDAS analysis of LDHA and LDHB was performed by triplicate equilibrium dialysis and technical triplicate FIA-MS injections. Significant PMIs identified have a Q < 0.01 (dotted line). (B) Metabolite classes that interact with LDHA and LDHB from (A) (nicotinamides and dinucleotides, purple; adenosine nucleotide derivatives, pink; CoA derivatives, yellow; keto acids, teal). (C) Ligand-induced DSF melting point analysis of LDHA (solid lines, filled circles) and LDHB (dotted lines, open circles) with ATP (black), ADP (light purple), AMP (teal), and NAD (pink). KD app was determined from triplicate experiments, each with sextuplicate technical replicates, by fitting the specific binding and Hill slope equation from GraphPad Prism 9. Means ± SDs are plotted from triplicate experiments. (D) Enzyme activity of LDHA (solid lines, filled circles) and LDHB (dotted lines, open circles) treated with ATP (black), ADP (light purple), or AMP (teal). (E and F) Enzyme activity of LDHA or LDHB treated with CoA (gray), acetyl-CoA (C2:0-CoA; cyan), butyryl-CoA (C4:0-CoA; light pink), octanoyl-CoA (C8:0-CoA; light purple), lauroyl-CoA (C12:0-CoA; black), palmitoyl-CoA (C16:0-CoA; teal), oleoyl-CoA (C18:1-CoA; pink), and saturated arachidoyl-CoA (C20:0-CoA; purple). [(D) to (F)] IC50 was determined from triplicate experiments, each with triplicate technical replicates using GraphPad Prism 9. ND, not determined. Means ± SDs are plotted from triplicate experiments. (G) Schematic of [U13C6]-glucose metabolism in cells treated with palmitate-conjugated BSA after inhibition of the mitochondrial pyruvate carrier with UK5099. Pyr, pyruvate; Lac, lactate; IC, intracellular; EC, extracellular. (H) Fold change of extracellular [U13C3]-lactate collected from the growth media of the indicated H9c2 cell lines in response to treatment with palmitate-conjugated BSA (Pal) relative to BSA-vehicle control (BSA). Absolute abundance is displayed in fig. S4H. (I) Schematic of [U13C3]-lactate metabolism in cells treated with palmitate-conjugated BSA after inhibition of the mitochondrial pyruvate carrier with UK5099. (J) Fold change of intracellular [U13C3]-pyruvate in indicated H9c2 cell lines in response to treatment with palmitate-conjugated BSA (Pal) relative to BSA-vehicle control (BSA). Absolute abundance is displayed in fig. S4J. [(H) and (J)] Experiments were performed in triplicate, and means ± SDs are displayed. A two-way analysis of variance (ANOVA) and Sidak’s multiple comparison test (GraphPad Prism 9) was performed between Pal and BSA samples (ns, not significant; **P < 0.005; ****P < 0.0001).

References

    1. Diether M, Sauer U, Curr. Opin. Microbiol. 39, 16–23 (2017). - PubMed
    1. Diether M, Nikolaev Y, Allain FH, Sauer U, Mol. Syst. Biol. 15, e9008 (2019). - PMC - PubMed
    1. Orsak T et al., Biochemistry 51, 225–232 (2012). - PubMed
    1. Chantranupong L et al., Cell 165, 153–164 (2016). - PMC - PubMed
    1. Wolfson RL et al., Science 351, 43–48 (2016). - PMC - PubMed