. 2023 Mar 14;120(11):e2218330120.
doi: 10.1073/pnas.2218330120. Epub 2023 Mar 9.

KMT2D acetylation by CREBBP reveals a cooperative functional interaction at enhancers in normal and malignant germinal center B cells

Affiliations

KMT2D acetylation by CREBBP reveals a cooperative functional interaction at enhancers in normal and malignant germinal center B cells

Sofija Vlasevska et al. Proc Natl Acad Sci U S A. .

Abstract

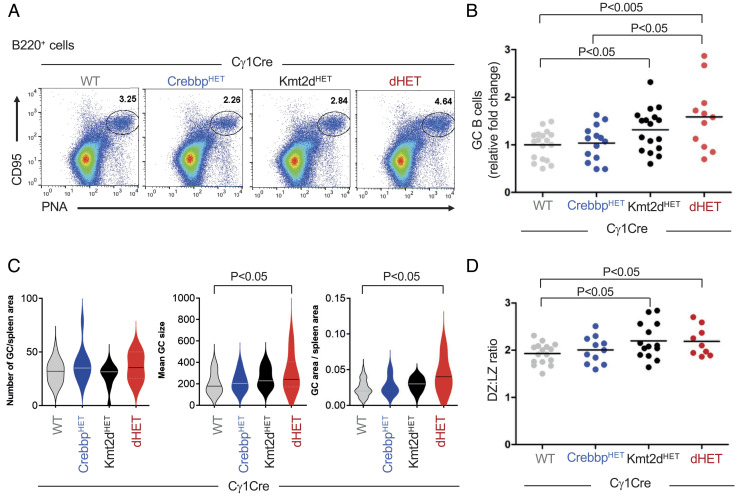
Heterozygous inactivating mutations of the KMT2D methyltransferase and the CREBBP acetyltransferase are among the most common genetic alterations in B cell lymphoma and co-occur in 40 to 60% of follicular lymphoma (FL) and 30% of EZB/C3 diffuse large B cell lymphoma (DLBCL) cases, suggesting they may be coselected. Here, we show that combined germinal center (GC)-specific haploinsufficiency of Crebbp and Kmt2d synergizes in vivo to promote the expansion of abnormally polarized GCs, a common preneoplastic event. These enzymes form a biochemical complex on select enhancers/superenhancers that are critical for the delivery of immune signals in the GC light zone and are only corrupted upon dual Crebbp/Kmt2d loss, both in mouse GC B cells and in human DLBCL. Moreover, CREBBP directly acetylates KMT2D in GC-derived B cells, and, consistently, its inactivation by FL/DLBCL-associated mutations abrogates its ability to catalyze KMT2D acetylation. Genetic and pharmacologic loss of CREBBP and the consequent decrease in KMT2D acetylation lead to reduced levels of H3K4me1, supporting a role for this posttranslational modification in modulating KMT2D activity. Our data identify a direct biochemical and functional interaction between CREBBP and KMT2D in the GC, with implications for their role as tumor suppressors in FL/DLBCL and for the development of precision medicine approaches targeting enhancer defects induced by their combined loss.

Keywords: B cell lymphoma; CREBBP; KMT2D; acetylation; germinal center.


Conflict of interest statement

The authors have organizational affiliations to disclose, ASTRA ZENECA: Consulting; NEOGENOMICS: Advisory Board Member, the authors have research support to disclose, ASTRA ZENECA: Research Award CU20-0758.

Figures

Fig. 1.
Fig. 1.
Haploinsufficiency of Crebbp and Kmt2d synergizes to promote the expansion of GC B cells. (A) Representative flow cytometric analysis of splenic B220+ cells from Kmt2d+/+Crebbp+/+ Cγ1Cre/+(WT), Crebbpfl/+Cγ1Cre/+(CrebbpHET), Kmt2dfl/+Cγ1Cre/+(Kmt2dHET), and Kmt2dfl/+Crebbpfl/+Cγ1Cre/+ (dHET) mice analyzed 10 d after SRBC immunization. GC B cells are identified as CD95+PNAhi cells, and numbers in each panel indicate the percentage in the gate. (B) Percentage of GC B cells in mice from the indicated genotypes analyzed 10 d after SRBC immunization. Data are from five independent experiments and are expressed as relative changes compared to the mean percentage in WT littermates from the same experiment, arbitrarily set as 1 (n = 11 to 18 mice/genotype; see also SI Appendix, Fig. S1). One-way ANOVA with Bonferroni post hoc correction. (C) Mean GC number, GC size, and overall GC area (per spleen section) in mice of the indicated genotypes, measured in pixels using ImageJ (n = 2 independent experiments with 3 to 4 mice/genotype and 3 sections/mouse). Student’s t test. (D) GC DZ:LZ ratio in the same mouse cohorts (n = 9 to 16 mice/genotype from four independent experiments). Student’s t test. In all plots, only statistically significant P values are indicated.
Fig. 2.
Fig. 2.
CREBBP and KMT2D occupy shared and distinct E/SEs linked to immune signaling genes. (A) Distance plots of KMT2D ChIP-seq peaks in human GC B cells, as related to the closest CREBBP peak. (B) Distribution pattern of KMT2D and CREBBP mapping in human GC B cells. Chromatin domains bound by KMT2D-only, CREBBP-only, and both proteins (co-bound) are defined as TSS-proximal (–2/+1 kb), intragenic (i.e., regions within a gene), and intergenic (i.e., regions between annotated genes). (C) Histone modification pattern at CREBBP/KMT2D-cobound regions shown separately for TSS-proximal and TSS-distal chromatin domains. Signal is centered on the KMT2D peak. (D) Violin plots of H3K27Ac and H3K4me1 enrichment in regions cooccupied by CREBBP and KMT2D as compared to regions bound by these enzymes individually (**< 0.01; Mann–Whitney test). (E) Venn diagram of shared and unique regions bound by KMT2D and CREBBP at E/SEs in GC B cells. (F) Top positively enriched (< 0.05 after Benjamini–Hochberg correction) biological programs/signaling pathways in the gene lists identified in (E). Analyses were performed using the top 500 genes (based on ChIPseeker P value) and signatures from the MSigDB Hallmark and CP/C2 gene sets (KEGG and REACTOME). The size of the circle is proportional to the number of genes in the overlap (see Dataset S2 for the complete list). (G) ChIP-seq tracks of CREBBP, KMT2D, H3K4me1, H3K27Ac, and H3K4me3 at representative chromatin domains bound by KMT2D and/or CREBBP. Green bars below the H3K27Ac track denote domains identified as SEs by ROSE. Genes included in the region are aligned below the tracks (only the main transcript is shown, with arrows indicating the transcription start site). Genomic coordinates based on hg19. (H) Top significantly enriched TF binding motifs identified in CREBBP/KMT2D-cobound regions.
Fig. 3.
Fig. 3.
Dual loss of CREBBP and KMT2D perturbs a select LZ-associated program in normal GCs and DLBCL. (A) Unsupervised hierarchical clustering of RNA-seq profiles from purified mouse GC B cells of the indicated genotypes. Color scale represents the z score. (B) Heat map of significantly down-regulated transcripts in either Kmt2dHET, CrebbpHET, or dHET GC B cells as compared to WT (q < 0.05 after Benjamini–Hochberg correction). Scale bar indicates the z score (see also Dataset S3). (C) GSEA enrichment plots of genes significantly down-regulated (Left) or up-regulated (Right) in dHET mice across the rank of differentially expressed genes in WT vs Kmt2dHET or WT vs CrebbpHET GC B cells. (D) GSEA of GC single cell signatures in WT vs dHET GC B cells. On the left, UMAP projection of scRNA profiles obtained from human GC B cells color-coded according to 13 distinct B cell differentiation states identified in ref  (see original Fig. 2A). On the right, the enrichment q values obtained by GSEA of the 13 sc-associated signatures in WT vs dHET mice are overlaid onto the same UMAP plot. Red color identifies signatures significantly down-regulated in dHET cells (q < 0.05) as a read-out for the depletion of specific subpopulations. Gray color identified nonsignificant changes (>0.25), and the full details of the analysis are provided in Dataset S4. (E) Top significantly dysregulated molecular programs in dHET GC B cells, as identified by GSEA using the Signature DB datasets (see also Dataset S4 and SI Appendix, Fig. S3 B and C). (F) GSEA enrichment plots of dHET down-regulated genes in GCB-DLBCL (CREBBP/KMT2D comutated vs WT). See also SI Appendix, Fig. S3 D and E. (G) Heat map of 70 leading-edge genes identified in (F) (DLBCL-NCI cohort). Representative genes are indicated. C/K, CREBBP/KMT2D genetic status; co-M, comutated (tumors carrying mutations in CREBBP-only and KMT2D-only not included).
Fig. 4.
Fig. 4.
CREBBP and KMT2D form a biochemical complex in B cells. (A) Immunoblot analysis of the indicated proteins in whole-cell extracts (input), KMT2D immunoprecipitates (IP:HA), and CREBBP immunoprecipitates (IP:FLAG) obtained from HEK293-T cells cotransfected with HA-KMT2D and FLAG-CREBBP expression vectors. Tubulin is used as the loading control. L.e., long exposure. (B) Physical interaction of CREBBP and KMT2D in nuclear extracts from native DLBCL cells documented by immunoblot analysis of KMT2D (or control IgG) immunoprecipitates with the indicated antibodies. The reverse IP confirms this interaction in panel C.
Fig. 5.
Fig. 5.
KMT2D is acetylated by CREBBP. (A) Experimental plan used for the analysis of KMT2D acetylation in normal B cell subsets and DLBCL cell lines harboring intact KMT2D and lysine acetyltransferase (KAT1 through KAT8) genes. (B) Immunoblot analysis of the indicated proteins in whole-cell extracts (Input) and KMT2D immunoprecipitates (KMT2D-IP) from two DLBCL cell lines treated with TSA and/or NIA. IgG antibodies were used as control for nonspecific binding (CREBBP, p300, and AcCREBBP/p300 levels in the inputs or vinculin loading control in SI Appendix, Fig. S4A). (C) Immunoblot analysis of the indicated proteins in whole-cell extracts (input) and KMT2D immunoprecipitates (KMT2D-IP) from purified naive and GC B cells (SI Appendix, Fig. S4 B and C). In (B) and (C), Ac-KMT2D was detected using a pan-AcK antibody, and asterisks in the inputs denote a nonspecific band. (D) Immunoblot analysis of the indicated proteins in whole-cell extracts (input) or KMT2D immunoprecipitates (IP:HA) from 293T cells cotransfected with vectors expressing HA-KMT2D and FLAG-CREBBP or empty vector as control. The anti-CREBBP antibody detects both endogenous and exogenous CREBBP, and the specific Ac-CBP/p300 antibody documents an active enzyme based on self-acetylation. Inputs are 5% of the lysate used in the IP. (E) Immunoblot analysis with anti-AcK antibodies documents the presence of acetylated KMT2D in 293T cells overexpressing CREBBP wild type but not a truncated form lacking the HAT domain (Q1113X) or a point mutant in the HAT domain (R1446L) that is also unable to self-acetylate (6). (F) Mapping of the KMT2D acetylated region in transfected 293T cells. Details on the expression constructs used and the list of acetylated lysines validated by mass spectrometry in DLBCL cells are provided in SI Appendix, Fig. S5. (G) A deletion mutant lacking AA2289-3170 (KMT2D-ΔC) confirms this region is the main target of CREBBP-mediated acetylation. (H) In vitro acetyltransferase assay using semipurified HA-KMT2D and FLAG-CREBBP polypeptides (wild type or R1446L mutant) with increasing amounts of Ac-CoA. Immunoblot analysis of AcK reveals a specific, dose-dependent signal upon addition of wild-type CREBBP (Left) but not of the enzymatically defective point mutant (Right). Documentation of protein purity is provided in SI Appendix, Fig. S6.
Fig. 6.
Fig. 6.
CREBBP is the preferred acetyltransferase for KMT2D. (A) Immunoblot analysis of total and Ac-KMT2D in isogenic CREBBPKO and p300KO clones from two DLBCL cell lines as compared to WT control clones obtained by editing a neutral region of the genome (WT). Cells were treated with TSA/NIA for 3 h before IP with a KMT2D antibody or IgG as control. Immunoblot analysis of total CREBBP, p300, and Ac-CBP/p300 controls for efficient knockout of these two acetyltransferases. Vinculin serves as the loading control. (B) Quantification of Ac-KMT2D signal in the isogenic clones shown in (A), as assessed by densitometry using ImageJ. Data are presented as relative levels compared to the WT control, set as 1, and correspond to two independent experiments (mean ± SD). (C) Immunoblot analysis of total and Ac-KMT2D in native SUDHL4 and LY7 cells cultured in the absence (−) or presence (+) of TSA/NIA and a specific CBP/p300 HAT inhibitor prior to IP with KMT2D antibodies. (D) Quantification of Ac-KMT2D signal in the same immunoprecipitates, as assessed by densitometry using ImageJ after normalization for total KMT2D levels in the IP (mean ± SD; two independent experiments). In (A) and (C), Ac-KMT2D was detected by a pan-AcK antibody, and asterisks denote nonspecific signal detected in the inputs. *< 0.05; Student’s t test. Only statistically significant P values are indicated in B and D.
Fig. 7.
Fig. 7.
DLBCL-associated CREBBP HAT mutations abrogate the protein ability to acetylate KMT2D. (A) Schematic diagram of the CREBBP C-terminal HAT domain, with its flanking CH2 and CH3 (ZZ-TAZ2) domains. The position of common amino acid substitutions found in primary DLBCL samples and tested in the cotransfection assay is approximately indicated (numbering corresponds to mouse Crebbp). ΔS1681 is a recurrent in-frame deletion of a single serine. (B) Immunoblot analysis of CREBBP and KMT2D expression in HEK293T cells cotransfected with the indicated vectors. Acetylated KMT2D and CREBBP/p300 proteins are detected by a pan-AcK antibody (^), and vinculin controls for equal loading. Arrow indicates the exogenous truncated protein encoded by the R1361X construct (note that this protein is not detected by the HA antibody as the stop codon was introduced in the full-length sequence 5' to the C-terminal tag).
Fig. 8.
Fig. 8.
CREBBP-mutant DLBCL cells display significantly reduced H3K4me1 levels. (A) Immunoblot analysis of histone marks in chromatin extracts from isogenic CREBBPWT and CREBBPKO DLBCL clones treated with TSA/NIA (n = 4 each) (Bottom). Expression of CREBBP, KMT2D, and Ac-CREBBP/p300 in whole-cell extracts from the same cells is shown in the middle panels (input), while total and Ac-KMT2D in the IPs are in the top panels. Below the blots, quantification by densitometry using ImageJ (n = 4 clones/each; mean ± SD, with the WT levels arbitrarily set as 1; one representative experiment out of two that showed analogous results). (B) Relative abundance of H3K4me1 (TK(me1)QTAR) and H3K27Ac (KSAPATGGVKKPHR) in the same cells, assessed by mass spectrometry (n = 3 clones each; mean ± SD). (C) Immunoblot analysis of histone marks in SUDHL4 cells treated with TSA/NIA in the presence or absence of the specific CBP/p300 HAT inhibitor CU329 (Bottom). The levels of total and Ac-KMT2D in the KMT2D-IP are shown in the top panel (^, pan-AcK antibody). Quantification of H3K4me1 is displayed below the blots. In all panels, *< 0.05 and ** < 0.01, two-tailed Student’s t test. Only statistically significant P values are indicated.

Similar articles

Cited by

References

    1. Pasqualucci L., Molecular pathogenesis of germinal center-derived B cell lymphomas. Immunol. Rev. 288, 240–261 (2019), 10.1111/imr.12745. - DOI - PubMed
    1. Kuppers R., Klein U., Hansmann M. L., Rajewsky K., Cellular origin of human B-cell lymphomas. N. Engl. J. Med. 341, 1520–1529 (1999), 10.1056/NEJM199911113412007. - DOI - PubMed
    1. Roschewski M., Phelan J. D., Wilson W. H., Molecular classification and treatment of diffuse large B-cell lymphoma and primary mediastinal B-cell lymphoma. Cancer J. 26, 195–205 (2020), 10.1097/PPO.0000000000000450. - DOI - PMC - PubMed
    1. Huet S., Sujobert P., Salles G., From genetics to the clinic: A translational perspective on follicular lymphoma. Nat. Rev. Cancer 18, 224–239 (2018), 10.1038/nrc.2017.127. - DOI - PubMed
    1. Morin R. D., et al. , Frequent mutation of histone-modifying genes in non-Hodgkin lymphoma. Nature 476, 298–303 (2011), 10.1038/nature10351. - DOI - PMC - PubMed

Publication types