. 2023 Jun 1;141(22):2756-2770.
doi: 10.1182/blood.2022019578.

Molecular basis of polycomb group protein-mediated fetal hemoglobin repression

Affiliations

Molecular basis of polycomb group protein-mediated fetal hemoglobin repression

Kunhua Qin et al. Blood. .

Abstract

The switch from fetal hemoglobin (HbF) to adult hemoglobin (HbA) is a paradigm for developmental gene expression control with relevance to sickle cell disease and β-thalassemia. Polycomb repressive complex (PRC) proteins regulate this switch, and an inhibitor of PRC2 has entered a clinical trial for HbF activation. Yet, how PRC complexes function in this process, their target genes, and relevant subunit composition are unknown. Here, we identified the PRC1 subunit BMI1 as a novel HbF repressor. We uncovered the RNA binding proteins LIN28B, IGF2BP1, and IGF2BP3 genes as direct BMI1 targets, and demonstrate that they account for the entirety of BMI1's effect on HbF regulation. BMI1 functions as part of the canonical PRC1 (cPRC1) subcomplex as revealed by the physical and functional dissection of BMI1 protein partners. Lastly, we demonstrate that BMI1/cPRC1 acts in concert with PRC2 to repress HbF through the same target genes. Our study illuminates how PRC silences HbF, highlighting an epigenetic mechanism involved in hemoglobin switching.


Conflict of interest statement

Conflict-of-interest disclosure: G.A.B. received funding from Pfizer and Fulcrum Therapeutics. The remaining authors declare no competing financial interests.

Figures

None
Graphical abstract
Figure 1.
Figure 1.
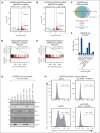
A protein domain–focused CRISPR screen identified BMI1 as a novel HbF repressor. (A) Scatter plot of sgRNA abundance in HbF-high and HbF-low populations from the domain-focused CRISPR screen. Each dot represents 1 sgRNA. Control sgRNAs (n = 50) and sgRNAs targeting BMI1 (n = 6) are labeled in blue and red, respectively. (B-D) Representative immunoblots of BMI1, GATA1, and γ-globin protein, HBG:(HBG+HBB) mRNA level, and HbF+ cell fraction in control (sgNeg: nontargeting sgRNA; sgBCL11A+58: positive control) and BMI1-depleted HUDEP2 cells. n = 2. β-Actin was used as the loading control in immunoblot experiment. Glyceraldehyde-3-phosphate dehydrogenase (GAPDH) was used as internal control for RT-qPCR. Values are presented as mean ± SEM. SEM, standard error of the mean.
Figure 2.
Figure 2.
BMI1 represses HbF in primary adult erythroblasts. (A) Schematic of the validation experiment in primary adult erythroid cells. CD34+ HSPCs isolated from peripheral blood of healthy donors were cultured with indicated cytokines and electroporated with Cas9 ribonucleoprotein at day 4 or 5 of the differentiation. (B-D) HBG:(HBB+HBG) mRNA levels (B) (n = 3 independent donors), HbF+ cell fraction (C) (n = 2), and hemoglobin HPLC profile (D) (n = 2) in control and BMI1-depleted primary adult erythroid cells. Values are presented as mean ± SEM. P values were calculated by unpaired 2-tailed Student t test. HPLC, high-performance liquid chromatography; SEM, standard error of the mean.
Figure 3.
Figure 3.
IGF2BP1 and LIN28B mediate the HbF silencing activity of BMI1 in HUDEP2 cells. (A-B) Volcano plots of DEGs identified from RNA-seq in BMI1-depleted HUDEP2 cells (sgBMI1#1 or sgBMI1#2) by DESeq2. Cutoff threshold: fold change > 2; FDR < 0.1; n = 2. (C) Venn diagram of DEGs identified from RNA-seq in BMI1-depleted HUDEP2 cells by comparing control sample with sgBMI1#1 (A) and sgBMI1#2 (B) sample, respectively. (D-E) Enrichment plots of fetal enriched genes overrepresented in BMI1 depletion RNA-seq in HUDEP2 cells as determined by GSEA. (F-H) RT-qPCR analysis of HBG:(HBB+HBG) (F) (n = 2), representative immunoblots of BCL11A, IGF2BP1, LIN28B, BMI1, and γ-globin protein (G), and HbF+ fraction (H) in AsCas12a-expressing HUDEP2 cells that were transduced with lentivirus expressing indicated sgRNAs. Values are presented as mean ± SEM. RT-qPCR data were normalized to AHSP. GAPDH was used as loading control in immunoblot experiment. DEGs, differentially expressed genes; GSEA, gene set enrichment analysis; SEM, standard error of the mean.
Figure 4.
Figure 4.
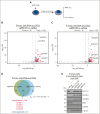
IGF2BP1 and IGF2BP3 mediate the HbF silencing activity of BMI1 in primary adult erythroblasts. (A) Schematic of BMI1 depletion experiments in primary adult erythroid cells. (B-C) Volcano plots of DEGs identified from RNA-seq in BMI1-depleted primary adult erythroblasts (sgBMI1#1 or sgBMI1#3) by DESeq2. Cutoff threshold: fold change > 2; FDR < 0.1; n = 2. (D) Venn diagram of overlapped DEGs identified from RNA-seq in BMI1-depleted primary adult erythroblasts by comparing control sample with sgBMI1#1 (B) and sgBMI1#3 (C) sample, respectively. (E) Representative immunoblots of BCL11A, IGF2BP1, IGF2BP3, BMI1, and γ-globin protein in control (sgNeg: nontargeting sgRNA; sgBCL11A+58, positive control) or BMI1-depleted primary adult erythroblasts. GAPDH was used as loading control. DEGs, differentially expressed genes.
Figure 5.
Figure 5.
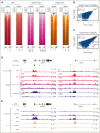
BMI1 occupies proximal CpG islands at the IGF2BP1, IGF2BP3, and LIN28B genes. (A) Heatmaps of BMI1, H2AK119ub1, and H3K27me3 peaks identified from CUT&RUN experiment in control or BMI1-depleted HUDEP2 cells. (B-C) Scatter plots of H2AK119ub1 (B) and H3K27me3 (C) enrichments in control and BMI1-depleted HUDEP2 cells. Differential analysis was performed using DESeq2 and DiffBind packages. Differential peaks were identified with FDR < 0.05 and are labeled in red (n = 2 biological replicates). (D) Chromatin occupancy of BMI1 and enrichment of H2AK119ub1 and H3K27me3 at the IGF2BP1 and LIN28B genes in control and BMI1-depleted HUDEP2 cells. Chromatin occupancy of BMI1 in primary adult erythroblasts was used for comparison. CpG island track (hg38) was obtained from the University of California, Santa Cruz (UCSC) genome browser. (E) Enrichment of H3K27me3 and H3K27ac at the IGF2BP1 and LIN28B genes in primary erythroblasts derived from CD34+ HSPCs isolated from fetal liver (fetal), cord blood (newborn), and peripheral blood (adult); n = 2 healthy donors.
Figure 6.
Figure 6.
BMI1 associates with CBX proteins to repress HbF in adult erythroid cells. (A) Representative immunoblots of BMI1 and different ancillary subunits (CBX2, 4, 6-8, and RYBP) in primary adult erythroblasts coimmunoprecipitation (co-IP) experiments. (B) Volcano plots of DEGs identified from CBX2, 4, and 8 triple depletion RNA-seq experiment in HUDEP2 cells by DESeq2. Cutoff threshold: fold change > 2; FDR < 0.1; n = 2. (C) Representative immunoblots of CBX2, 4, and 8, and IGF2BP1, LIN28B, and γ-globin protein in nuclear extract or whole-cell lysate of control and CBX2, 4, and 8 triple-depleted HUDEP2 cells. Lamin B1 and GAPDH were used as loading controls for nuclear extract and whole cell lysate respectively. (D) Enrichment plots of BMI1-repressed genes overrepresented in CBX2, 4, and 8 triple depletion RNA-seq in HUDEP2 cells as determined by GSEA. (E) Chromatin occupancies of BMI1, RING1B, EZH2, CBX2, 4, 7, and 8 in primary adult erythroblasts at the IGF2BP1 gene region. (F) Chromatin enrichment of H3K27me3 and H3K4me3 at IGF2BP1 gene in control or CBX2, 4, and 8 triple-depleted HUDEP2 cells. DEGs, differentially expressed genes; GSEA, gene set enrichment analysis.
Figure 7.
Figure 7.
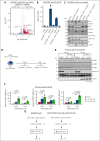
cPRC1 and PRC2 cooperate to maintain the repression of IGF2BP1/3 and LIN28B in adult erythroid cells. (A) Volcano plots of DEGs identified from EZH2 depletion RNA-seq in HUDEP2 cells by DESeq2. Cutoff threshold: fold change > 2; FDR < 0.1; n = 2. (B-C) RT-qPCR analysis of the ratio of HBG:(HBB+HBG) mRNA levels (B), representative immunoblots (C) of EZH2, IGF2BP1, LIN28B, BMI1, H2AK119ub1, H3K27me3, and γ-globin protein in AsCas12a-expressing HUDEP2 cells that were transduced with lentivirus expressing indicated sgRNAs. Values are presented as mean ± SEM. RT-qPCR data were normalized to AHSP (n = 2). GAPDH was used as loading control in immunoblot experiment. (D) Schematic of EZH2 inhibition experiment in primary erythroid cells. (E) Representative immunoblots of IGF2BP1, IGF2BP3, H3K27me3, histone H3, and γ-globin in drug-treated primary adult erythroblasts. GAPDH were used as the loading control. (F) Relative IGF2BP1, IGF2BP3, and HBG mRNA level in primary adult erythroblasts (at day 10 or 12 of differentiation [equal to 3 or 5 days after drug treatment]) as detected by RT-qPCR. Values are presented as mean ± SEM. Data were normalized to AHSP; n = 4. (G) Summary of PRC1/2 perturbation experiments. In HUDEP2 cells, genetic perturbation of BMI1, CBX, or EZH2 led to upregulation of LIN28B and IGF2BP1, and thus, HbF activation. In primary adult erythroblasts, BMI1 depletion and EZH2 inhibition both resulted in derepression of IGF2BP1/3, and elevation of HbF. However, the molecular link between the 3 RNA binding proteins and HbF activation remains to be defined. Our observations support a major role of BCL11A in mediating the function of these RNA-binding proteins, especially in HUDEP2 cells, however we cannot rule out additional, yet to be identified targets of 3 RNA binding proteins involved in HbF activation.

Comment in

  • Help on the way to unsilence HbF.
    Dean A. Dean A. Blood. 2023 Jun 1;141(22):2670-2672. doi: 10.1182/blood.2023020345. Blood. 2023. PMID: 37530647 Free PMC article. No abstract available.

References

    1. Orkin SH. Molecular medicine: found in translation. Med (N Y) 2021;2(2):122–136. - PMC - PubMed
    1. Hardison R, Slightom JL, Gumucio DL, Goodman M, Stojanovic N, Miller W. Locus control regions of mammalian β-globin gene clusters: combining phylogenetic analyses and experimental results to gain functional insights. Gene. 1997;205(1-2):73–94. - PubMed
    1. Bulger M, Schübeler D, Bender MA, et al. A complex chromatin landscape revealed by patterns of nuclease sensitivity and histone modification within the mouse β-globin locus. Mol Cell Biol. 2003;23(15):5234–5244. - PMC - PubMed
    1. Bulger M, van Doorninck JH, Saitoh N, et al. Conservation of sequence and structure flanking the mouse and human β-globin loci: the β-globin genes are embedded within an array of odorant receptor genes. Proc Natl Acad Sci U S A. 1999;96(9):5129–5134. - PMC - PubMed
    1. Liu N, Hargreaves VV, Zhu Q, et al. Direct promoter repression by BCL11A controls the fetal to adult hemoglobin switch. Cell. 2018;173(2):430–442.e17. - PMC - PubMed

Publication types

MeSH terms

Substances