. 2023 Apr:90:104507.
doi: 10.1016/j.ebiom.2023.104507. Epub 2023 Mar 7.

Cytotoxic CD161-CD8+ TEMRA cells contribute to the pathogenesis of systemic lupus erythematosus

Affiliations

Cytotoxic CD161-CD8+ TEMRA cells contribute to the pathogenesis of systemic lupus erythematosus

Hui Xiong et al. EBioMedicine. 2023 Apr.

Abstract

Background: Systemic lupus erythematosus (SLE) is a prototypical autoimmune disease affecting multiple organs and tissues with high cellular heterogeneity. CD8+ T cell activity is involved in the SLE pathogenesis. However, the cellular heterogeneity and the underlying mechanisms of CD8+ T cells in SLE remain to be identified.

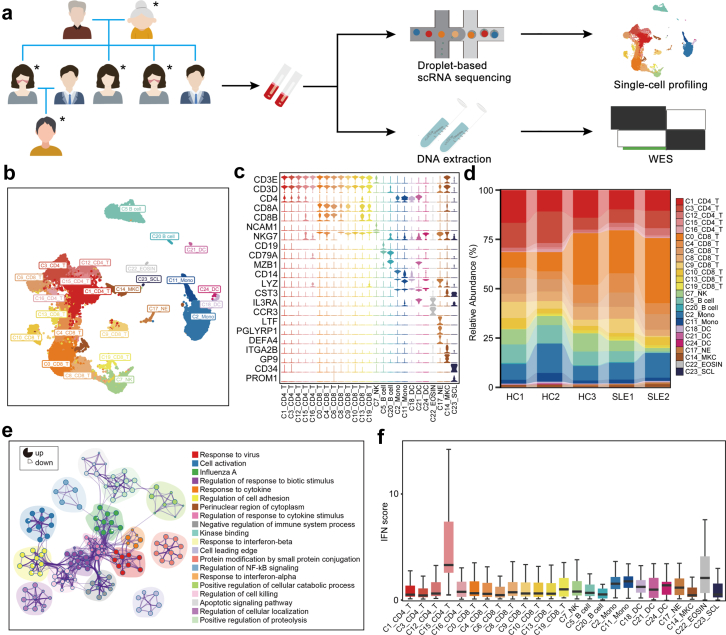
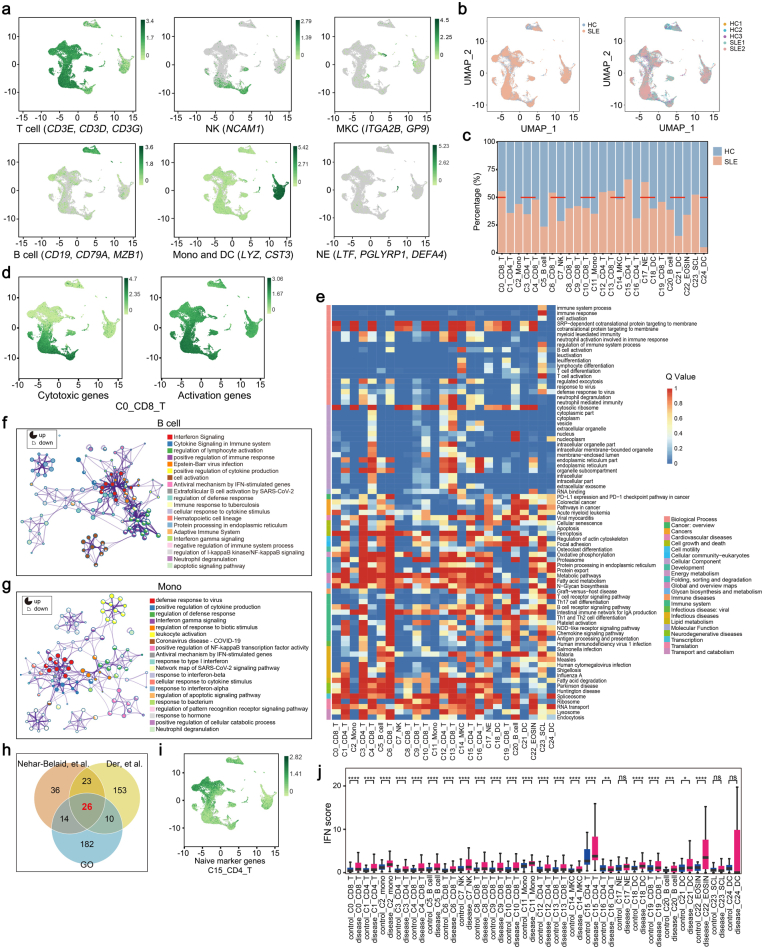
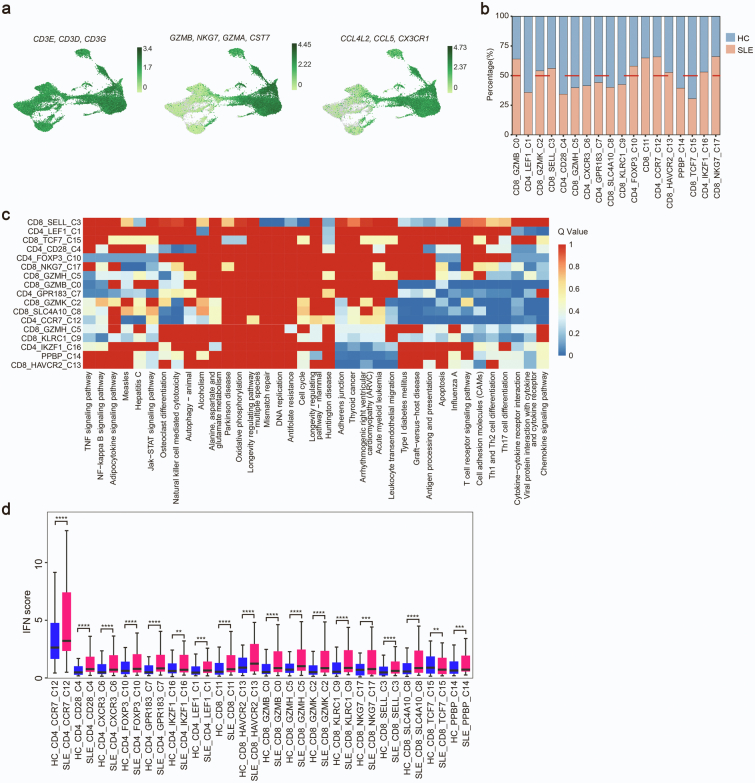
Methods: Single-cell RNA sequencing (scRNA-seq) of PBMCs from a SLE family pedigree (including 3 HCs and 2 SLE patients) was performed to identify the SLE-associated CD8+ T cell subsets. Flow cytometry analysis of a SLE cohort (including 23 HCs and 33 SLE patients), qPCR analysis of another SLE cohort (including 30 HCs and 25 SLE patients) and public scRNA-seq datasets of autoimmune diseases were employed to validate the finding. Whole-exome sequencing (WES) of this SLE family pedigree was used to investigate the genetic basis in dysregulation of CD8+ T cell subsets identified in this study. Co-culture experiments were performed to analyze the activity of CD8+ T cells.

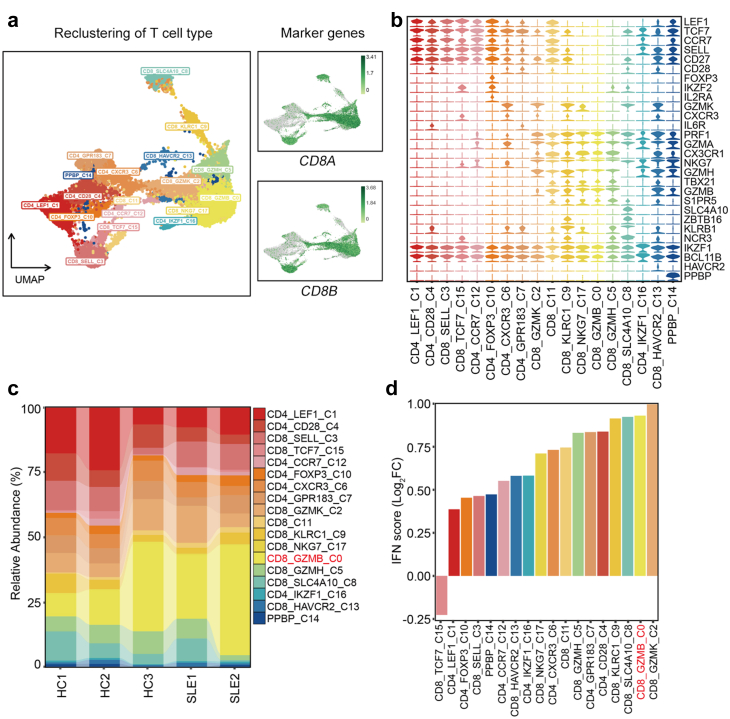
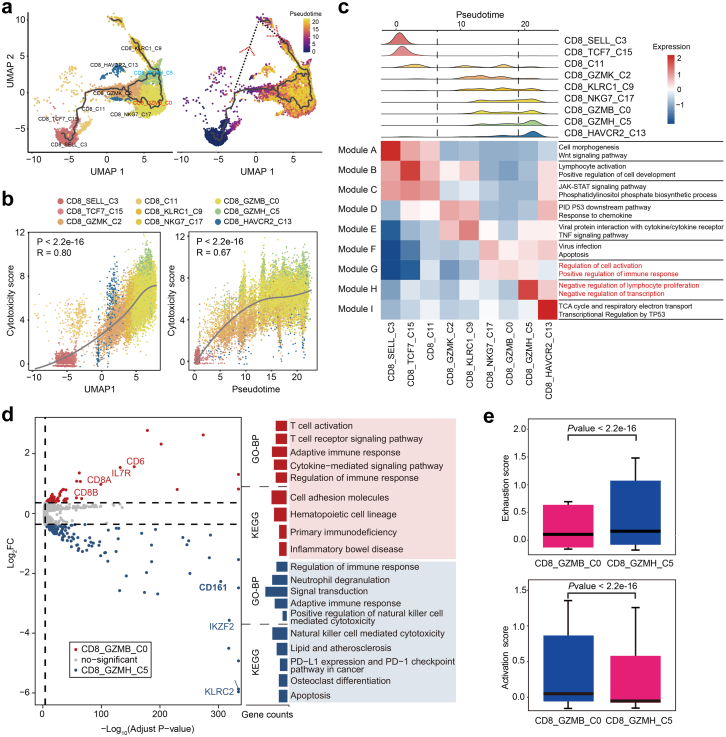
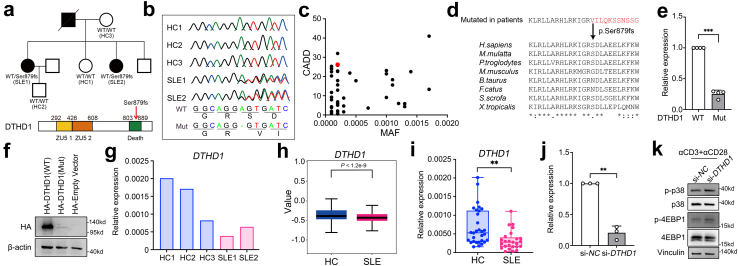
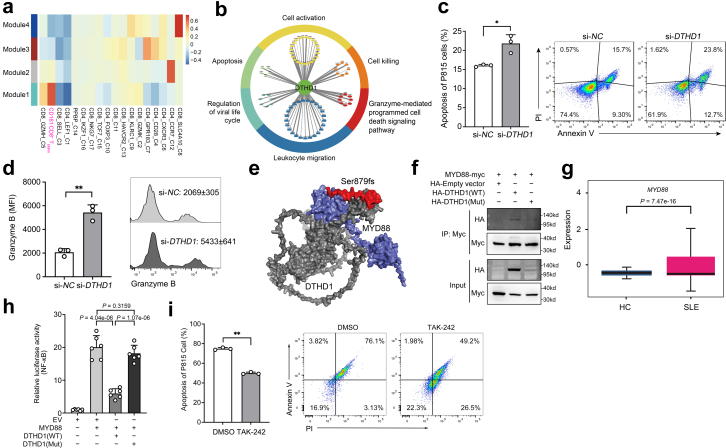
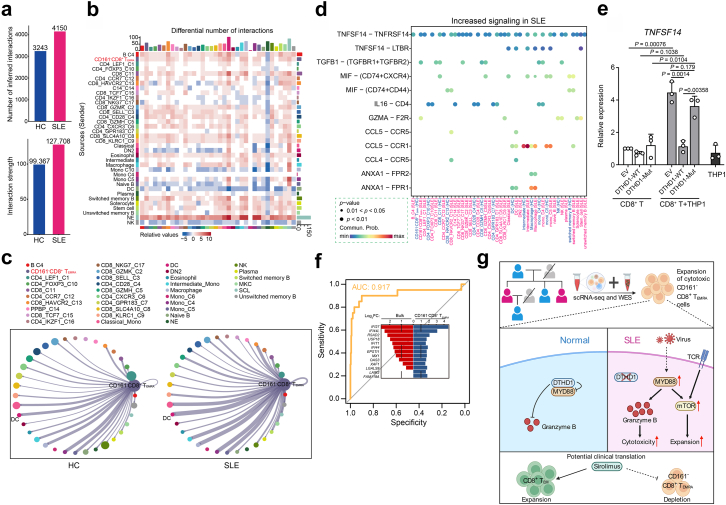
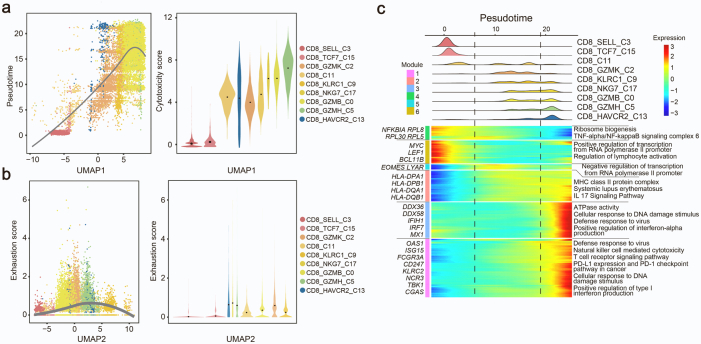
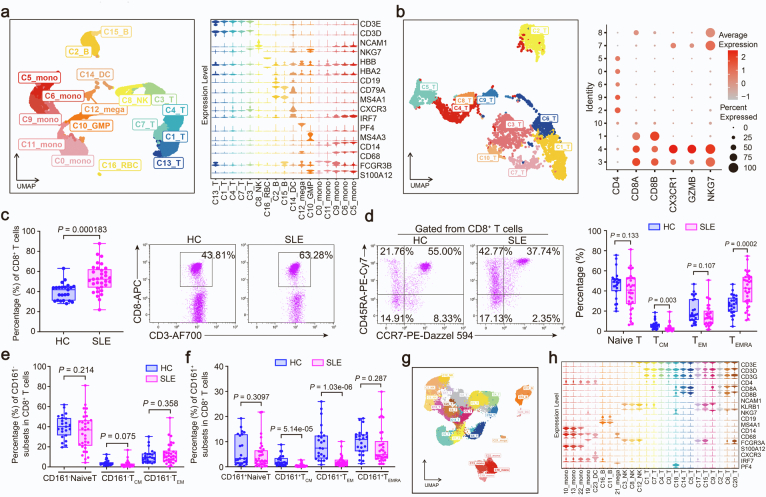
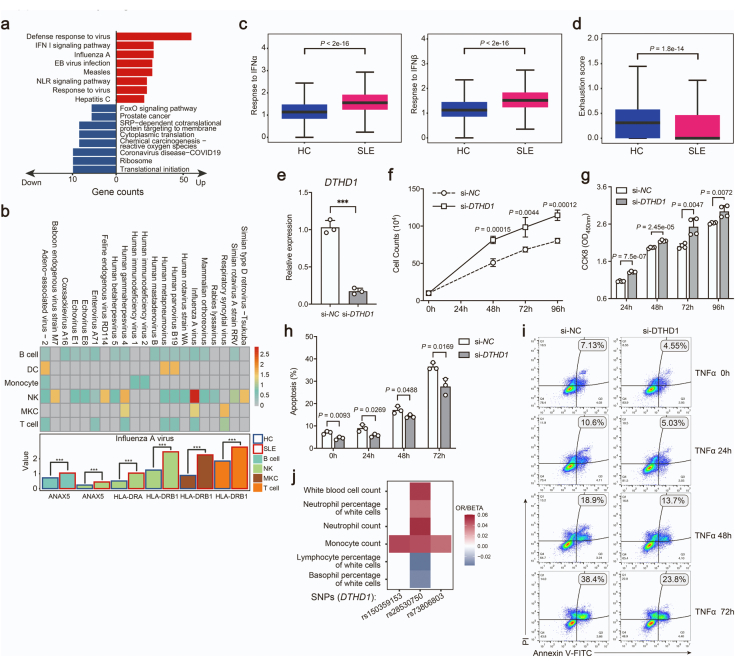
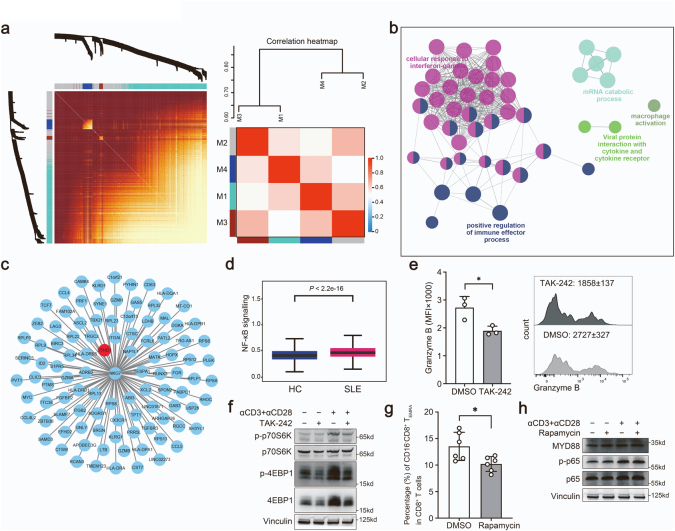
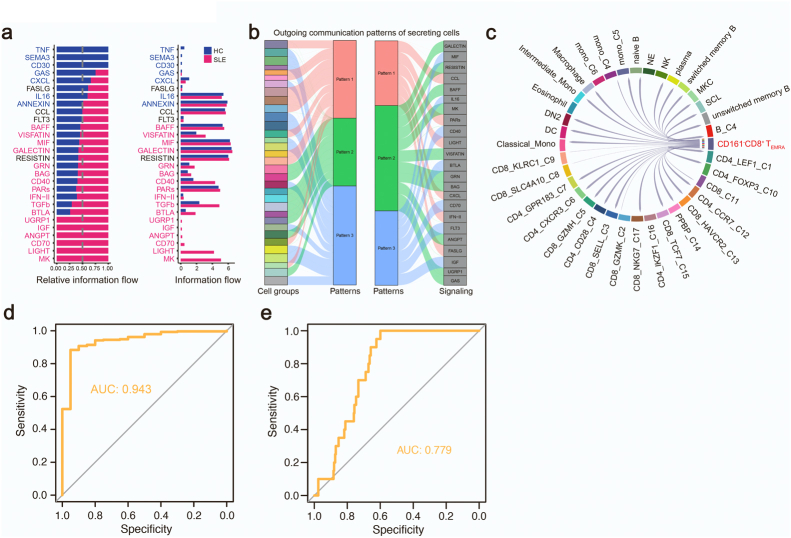
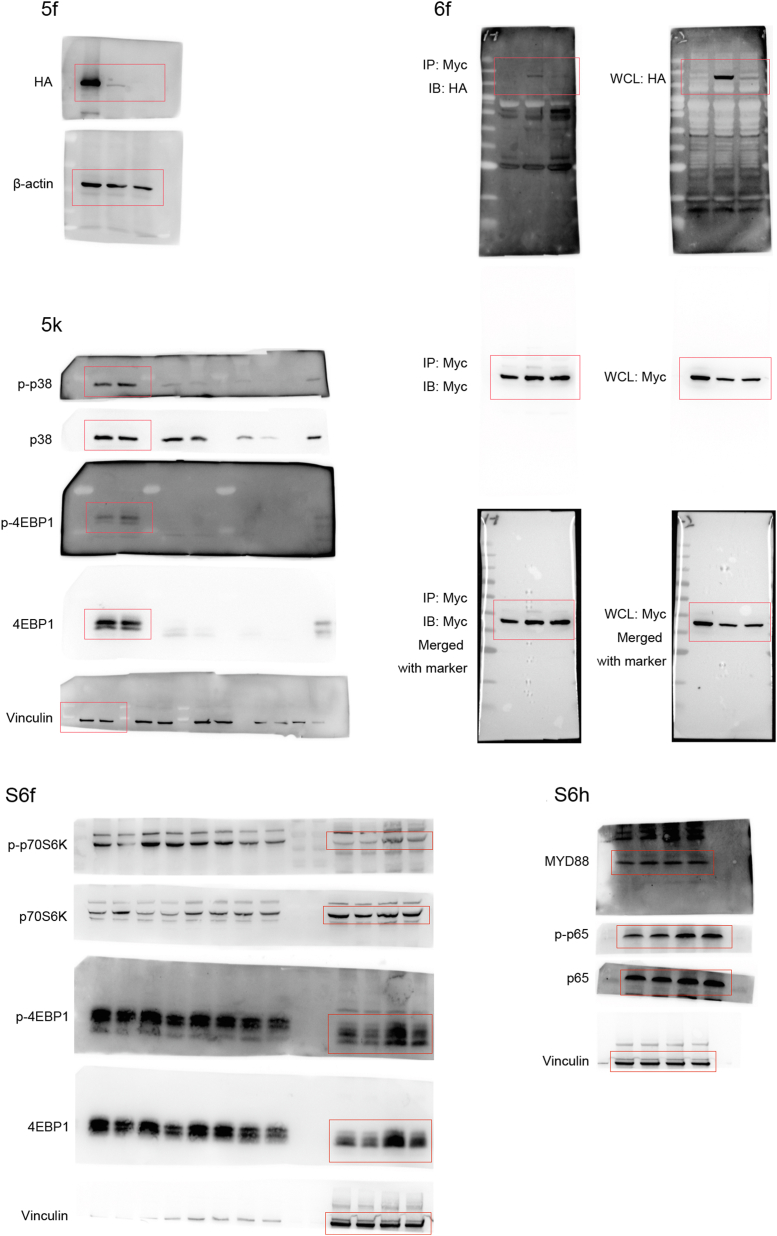
Findings: We elucidated the cellular heterogeneity of SLE and identified a new highly cytotoxic CD8+ T cell subset, CD161-CD8+ TEMRA cell subpopulation, which was remarkably increased in SLE patients. Meanwhile, we discovered a close correlation between mutation of DTHD1 and the abnormal accumulation of CD161-CD8+ TEMRA cells in SLE. DTHD1 interacted with MYD88 to suppress its activity in T cells and DTHD1 mutation promoted MYD88-dependent pathway and subsequently increased the proliferation and cytotoxicity of CD161-CD8+ TEMRA cells. Furthermore, the differentially expressed genes in CD161-CD8+ TEMRA cells displayed a strong out-of-sample prediction for case-control status of SLE.

Interpretation: This study identified DTHD1-associated expansion of CD161-CD8+ TEMRA cell subpopulation is critical for SLE. Our study highlights genetic association and cellular heterogeneity of SLE pathogenesis and provides a mechanistical insight into the diagnosis and treatment of SLE.

Fundings: Stated in the Acknowledgements section of the manuscript.

Keywords: CD8(+) T cell subset; DTHD1; Genetic variant; MYD88; Systemic lupus erythematosus; Whole-exome sequencing; scRNA-seq.


Conflict of interest statement

Declaration of interests The authors declare that they have no competing interests.

Figures

Fig. 1
Fig. 1
PBMCs profiling of a SLE family pedigree at the single-cell resolution. (a) Schematic map of experimental strategy. Individuals with butterfly erythema on their faces represent SLE patients, others represent HCs. The samples marked with ∗ are used to perform scRNA-seq and WES. (b) UMAP and clustering of 47,349 cells from 5 samples. (c) Violin plots depicting clusters are defined by a set of known marker genes. Heights denote average expression levels; widths denote cell densities. (d) Sankey plot representing cell abundance of each cluster (n = 25) across the 5 individuals (3 HCs and 2 SLE samples). (e) Network of enriched terms by the differentially expressed genes in T cells: colored by cluster ID. The proportion of the color in the circle represents the proportion of up-regulated genes in the term, and the proportion of the blank represents the proportion of down-regulated genes. (f) IFN scores across the clusters.
Fig. 2
Fig. 2
Transcriptional features of T cell subclusters. (a) UMAP of T cells which are reclustered into 18 subclusters. (b) T cell subclusters are defined by a set of known marker genes. (c) Sankey plot representing the cell abundance of each T cell subcluster (n = 18) across the 5 individuals (3 HCs and 2 SLE samples). (d) Alterations of IFN scores in each T cell subcluster.
Fig. 3
Fig. 3
Analysis of CD8+T cell subsets transition trajectory in SLE. (a) Pseudotemporal analysis of CD8+ T cell subsets. Trajectory of CD8+ T Cell subclusters is inferred using monocle3 and subclusters are marked by colors (left). Pseudotime-ordered variables are inferred using monocle2 (right). Dotted lines and arrows indicate inferred differentiation trajectory and direction. (b) Correlation between pseudo-time and cytotoxicity of CD8+ T cell subsets. The solid line represents loess fitting of the relationship between cytotoxicity scores and Monocle components. P values are calculated by Spearman correlation. (c) Distribution of CD8+ subpopulations during the transition, along with the pseudo-time (upper). Heatmap showing the co-expression modules with the highest average expression in each CD8+ T cell subcluster (lower). (d) Volcano plots (left) and GO/KEGG enrichment analysis (right) of differentially expressed genes between CD8_GZMB and CD8_GZMH (left). Red represents upregulation in CD8_GZMB, and blue represents upregulation in CD8_GZMH. (e) Boxplot indicating the average expression of exhaustion and activation gene signatures in CD8_GZMB and CD8_GZMH. The P values are from a Wilcoxon test. Loess, locally weighted regression.
Fig. 4
Fig. 4
Expansion of CD161CD8+TEMRAcells in SLE. (a) Percentages of CD161CD8+ TEMRA and CD161+CD8+ TEMRA cell subclusters in HCs and SLE samples. (b) Two-dimensional plots showing the changes of CD161 expression over pseudotime in HCs and SLE samples. P value is calculated by Spearman correlation. (c) CD161 expression in CD161CD8+ TEMRA and CD161+CD8+ TEMRA cell subcluster (left), and relative abundance of these two subsets in HCs and SLE subjects from public dataset (GSE162577) (right). P value is calculated by Wilcoxon rank-sum test. (d) CD161 expression of PBMCs from a new case–control cohort (HCs, n = 30; SLEs, n = 25). P value is from Unpaired t-test (e and f) Flow cytometry (left) and quantification (right) of the frequency of CD161CD8+ TEMRA cells (e) cytoplastic levels granzyme B of CD161CD8+ TEMRA (f) from a validation cohort (HCs, n = 23; SLEs, n = 33). P value is from Unpaired t-test. (g) Representative histogram showing granzyme B expression in HC and SLE samples. (h) Comparison of granzyme B expression in CD161CD8+ TEMRA and CD161+CD8+ TEMRA cells from SLE samples (n = 33). P value is from Paired t-test. (i) Boxplot showing SLEDAI scores of SLE patients with high levels of CD161 and low levels of CD161 from public dataset (GSE121239). P value is calculated by Wilcoxon rank-sum test (j) Sankey plot representing the relative abundance of CD161CD8+ TEMRA cells and CD161+CD8+ TEMRA cells from case–control cohorts of pSS (left, GSE177278) and MS (right, GSE193770).
Fig. 5
Fig. 5
Loss of function of DTHD1 from SLE patients. (a) SLE family pedigree and schematic map showing mutation (Ser879fs) location within DTHD1 protein. (b) Sanger sequencing reads indicating variant location. (c) CADD scores versus MAF for the new Ser879fs patient-derived DTHD1 variant as compared with DTHD1 variants with an MAF cutoff of >10−4 from the gnomAD database. (d) Amino acid sequence alignment of DTHD1 death domain across species. The arrow indicates the position of the Ser589fs mutation (e and f) qPCR (e) and western blotting (f) analysis of DTHD1 expression in HEK293T cells transfected with HA-tagged WT DTHD1 or mutant DTHD1 expressing plasmid. P value is determined by Paired t-test, P = 0.000158. (g) qPCR analysis of DTHD1 expression in this SLE family pedigree. (h) Expression of DTHD1 in scRNA dataset between SLE samples and HCs. (i) qPCR analysis of DTHD1 expression in another cohort (HCs, n = 30; SLEs, n = 25). P value is determined by Unpaired t-test, P = 0.00178 (j) qPCR analysis of DTHD1 expression in primary CD8+ T cells electroporated with si-NC or si-DTHD1 siRNAs (50 nM). P value is determined by Paired t-test, P = 0.00608 (k) Western blotting analysis of p-p38, p38, p-4EBP1, 4EBP1 in primary CD8+ T cells electroporated with si-NC or si-DTHD1 siRNAs after treatment with αCD3 and αCD28. One representative experiment of three is shown (f and k). ∗∗P < 0.01, ∗∗∗P < 0.001.
Fig. 6
Fig. 6
DTHD1 deficiency increased the cytotoxicity of CD161CD8+TEMRAcells. (a) Heatmap showing the correlation of co-expression modules with different cell subsets. (b) Functional annotations of DTHD1-related genes. (c) Quantification (left) and flow cytometry (right) of the apoptosis percentage of P815 cells after cocultured with primary CD8+ T cells electroporated with si-NC or si-DTHD1 siRNAs for 5 h at the ratio of 1:5. P value is determined by Unpaired t-test, P = 0.0124. (d) Flow cytometric analysis of mean fluorescence intensity (MFI) of Granzyme B of CD161CD8+ T cells electroporated with si-NC or si-DTHD1 siRNAs after coculture with P815 cell. P value is calculated by Unpaired t-test, P = 0.0012. (e) Structural prediction of DTHD1-MYD88 interaction by ZDOCK. Grey, DTHD1; blue, MYD88; red, mutated regions in DTHD1. (f) Western blotting analysis of HA in HEK293T cells co-transfected with myc-MYD88 and HA-empty vector or HA-DTHD1 (WT) or HA-DTHD1 (Mutant) expressing plasmids after immunoprecipitated with anti-Myc beads. (g) Boxplot indicating the average expression of MYD88 in CD161CD8+ TEMRA cells in HCs and SLE samples from our dataset. P value is from Wilcoxon rank-sum test. (h) Luciferase activity analysis of lysates of HEK293T cells co-transfected luciferase reporter plasmid for NF-κB, pRL-TK-renilla-luciferase plasmid, MYD88 plasmid and WT-DTHD1 plasmid or mutant DTHD1 plasmid (n = 6). P values are determined by Unpaired t-test. (i) Quantification (left) and flow cytometry (right) of the apoptosis percentage of P815 cells after cocultured with primary CD8+ T cells pre-treated with DMSO or TAK-242 for 5 h at the ratio of 1:5. P value is determined by Unpaired t-test, P = 0.0024. One representative experiment of three is shown (f). ∗P < 0.05, ∗∗P < 0.01, ∗∗∗P < 0.001.
Fig. 7
Fig. 7
CD161CD8+TEMRAcells contribute to SLE by LIGHT signaling. (a) The number (top) and strength (bottom) of interaction among all cells in HCs and SLE samples. (b) Heatmap of differential interactions between HCs and SLE samples in cell–cell communication network. The top bar indicates the sum of incoming signaling and right bar indicates the sum of outgoing signaling. Red indicates increased signaling and blue indicates decreased signaling in SLE. (c) Number of significant ligand-receptor pairs between CD161CD8+ TEMRA cells (outgoing) and other cell subclusters (incoming) in HCs (left) and SLEs (right). The relative number of ligand-receptor pairs is represented by the edge width. (d) Comparison of the significant outgoing signaling from CD161CD8+ TEMRA cells between HC and SLE. Empty space means the communication probability is zero. P-values are computed from one-sided permutation test. ∗∗∗P < 0.001. (e) qPCR analysis of TNFSF14 expression in primary CD8+ T cells electroporated with empty vector, DTHD1-WT or DTHD-mut plasmid cocultured with THP1 cells (n = 3). P values are determined by unpaired t-test. (f) Receiver operating curve for out-of-sample prediction of case–control state by a logistic regression model trained on DEGs in CD161CD8+ TEMRA cells. DEGs include IFI27, IFI44L, RSAD2, IFI44, FAM118A, LGALS9, MX1, EPSTI1, USP18, OAS3, LAIR2, IFIT1, XAF1. Inset depicts the changes of DEGs in the public transcriptome profile and CD161CD8+ TEMRA cells. (g) Graphic abstract showing the expansion of CD161CD8+ TEMRA in patients with SLE and DTHD1 downregulation promotes MYD88-mediated expansion and cytotoxicity of this pathogenic CD161CD8+ TEMRA subset in SLE.
Supplementary Fig. S1
Supplementary Fig. S2
Supplementary Fig. S3
Supplementary Fig. S4
Supplementary Fig. S5
Supplementary Fig. S6
Supplementary Fig. S7
Full Western Blots
Full Western Blots

References

    1. Tsokos G.C. Systemic lupus erythematosus. N Engl J Med. 2011;365(22):2110–2121. - PubMed
    1. Dorner T., Furie R. Novel paradigms in systemic lupus erythematosus. Lancet. 2019;393(10188):2344–2358. - PubMed
    1. Kaul A., Gordon C., Crow M.K., et al. Systemic lupus erythematosus. Nat Rev Dis Primers. 2016;2 - PubMed
    1. Chaussabel D., Quinn C., Shen J., et al. A modular analysis framework for blood genomics studies: application to systemic lupus erythematosus. Immunity. 2008;29(1):150–164. - PMC - PubMed
    1. Chiche L., Jourde-Chiche N., Whalen E., et al. Modular transcriptional repertoire analyses of adults with systemic lupus erythematosus reveal distinct type I and type II interferon signatures. Arthritis Rheumatol. 2014;66(6):1583–1595. - PMC - PubMed

MeSH terms

Substances