. 2023 Mar 8;31(3):389-404.e7.
doi: 10.1016/j.chom.2023.02.001.

Candida albicans-specific Th17 cell-mediated response contributes to alcohol-associated liver disease

Affiliations

Candida albicans-specific Th17 cell-mediated response contributes to alcohol-associated liver disease

Suling Zeng et al. Cell Host Microbe. .

Abstract

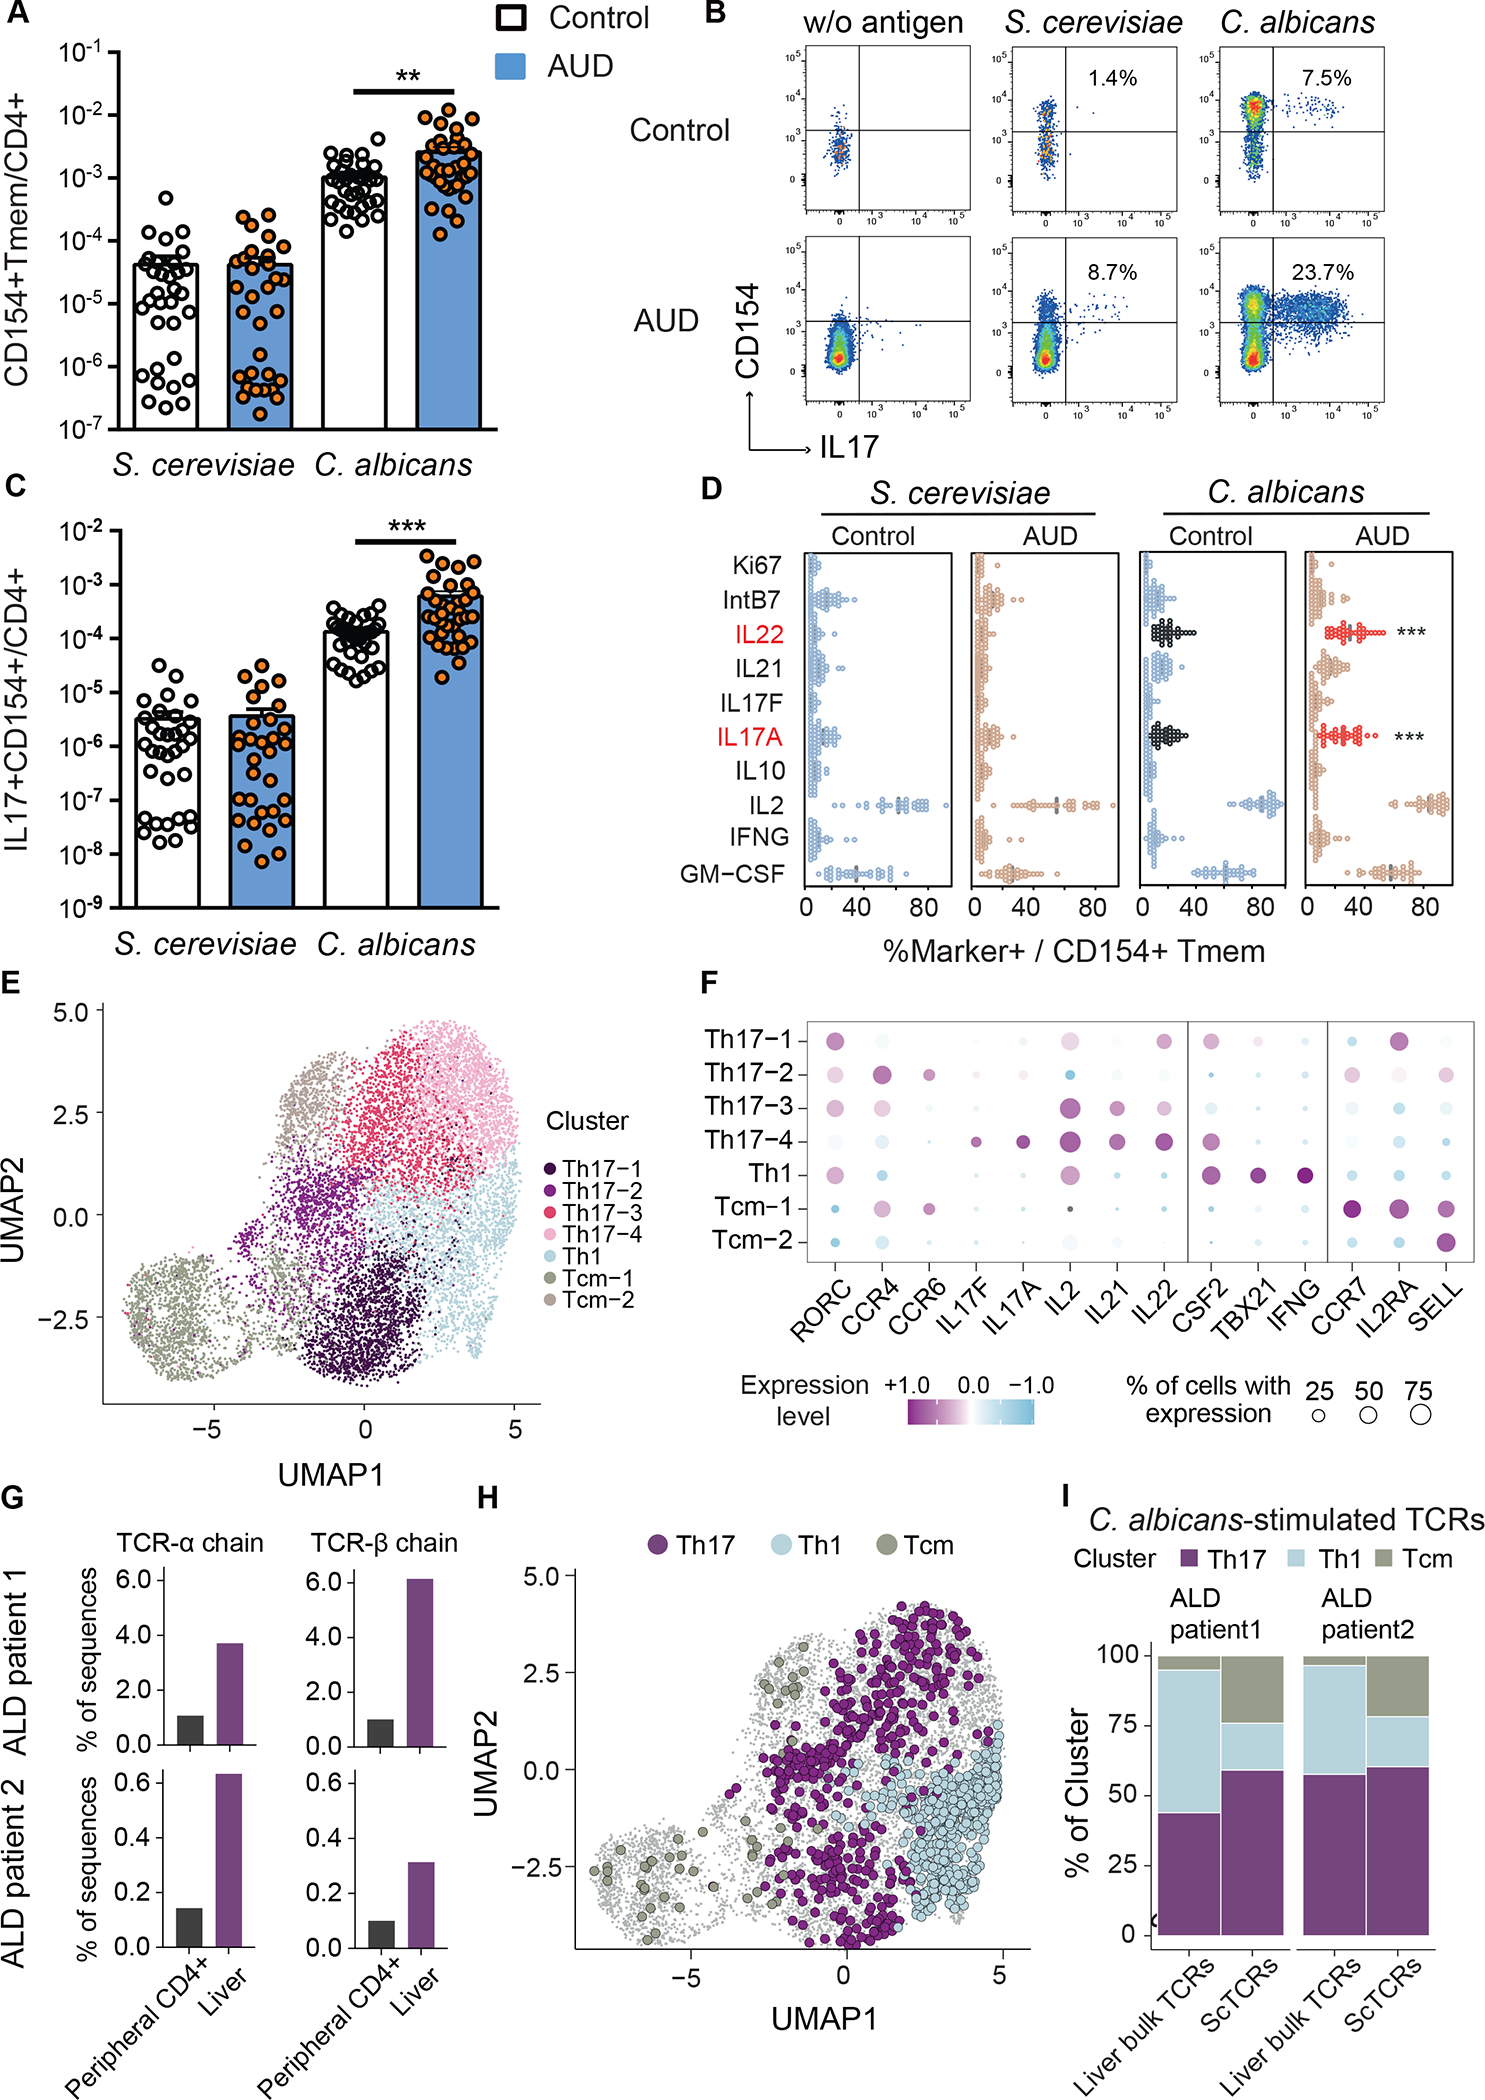
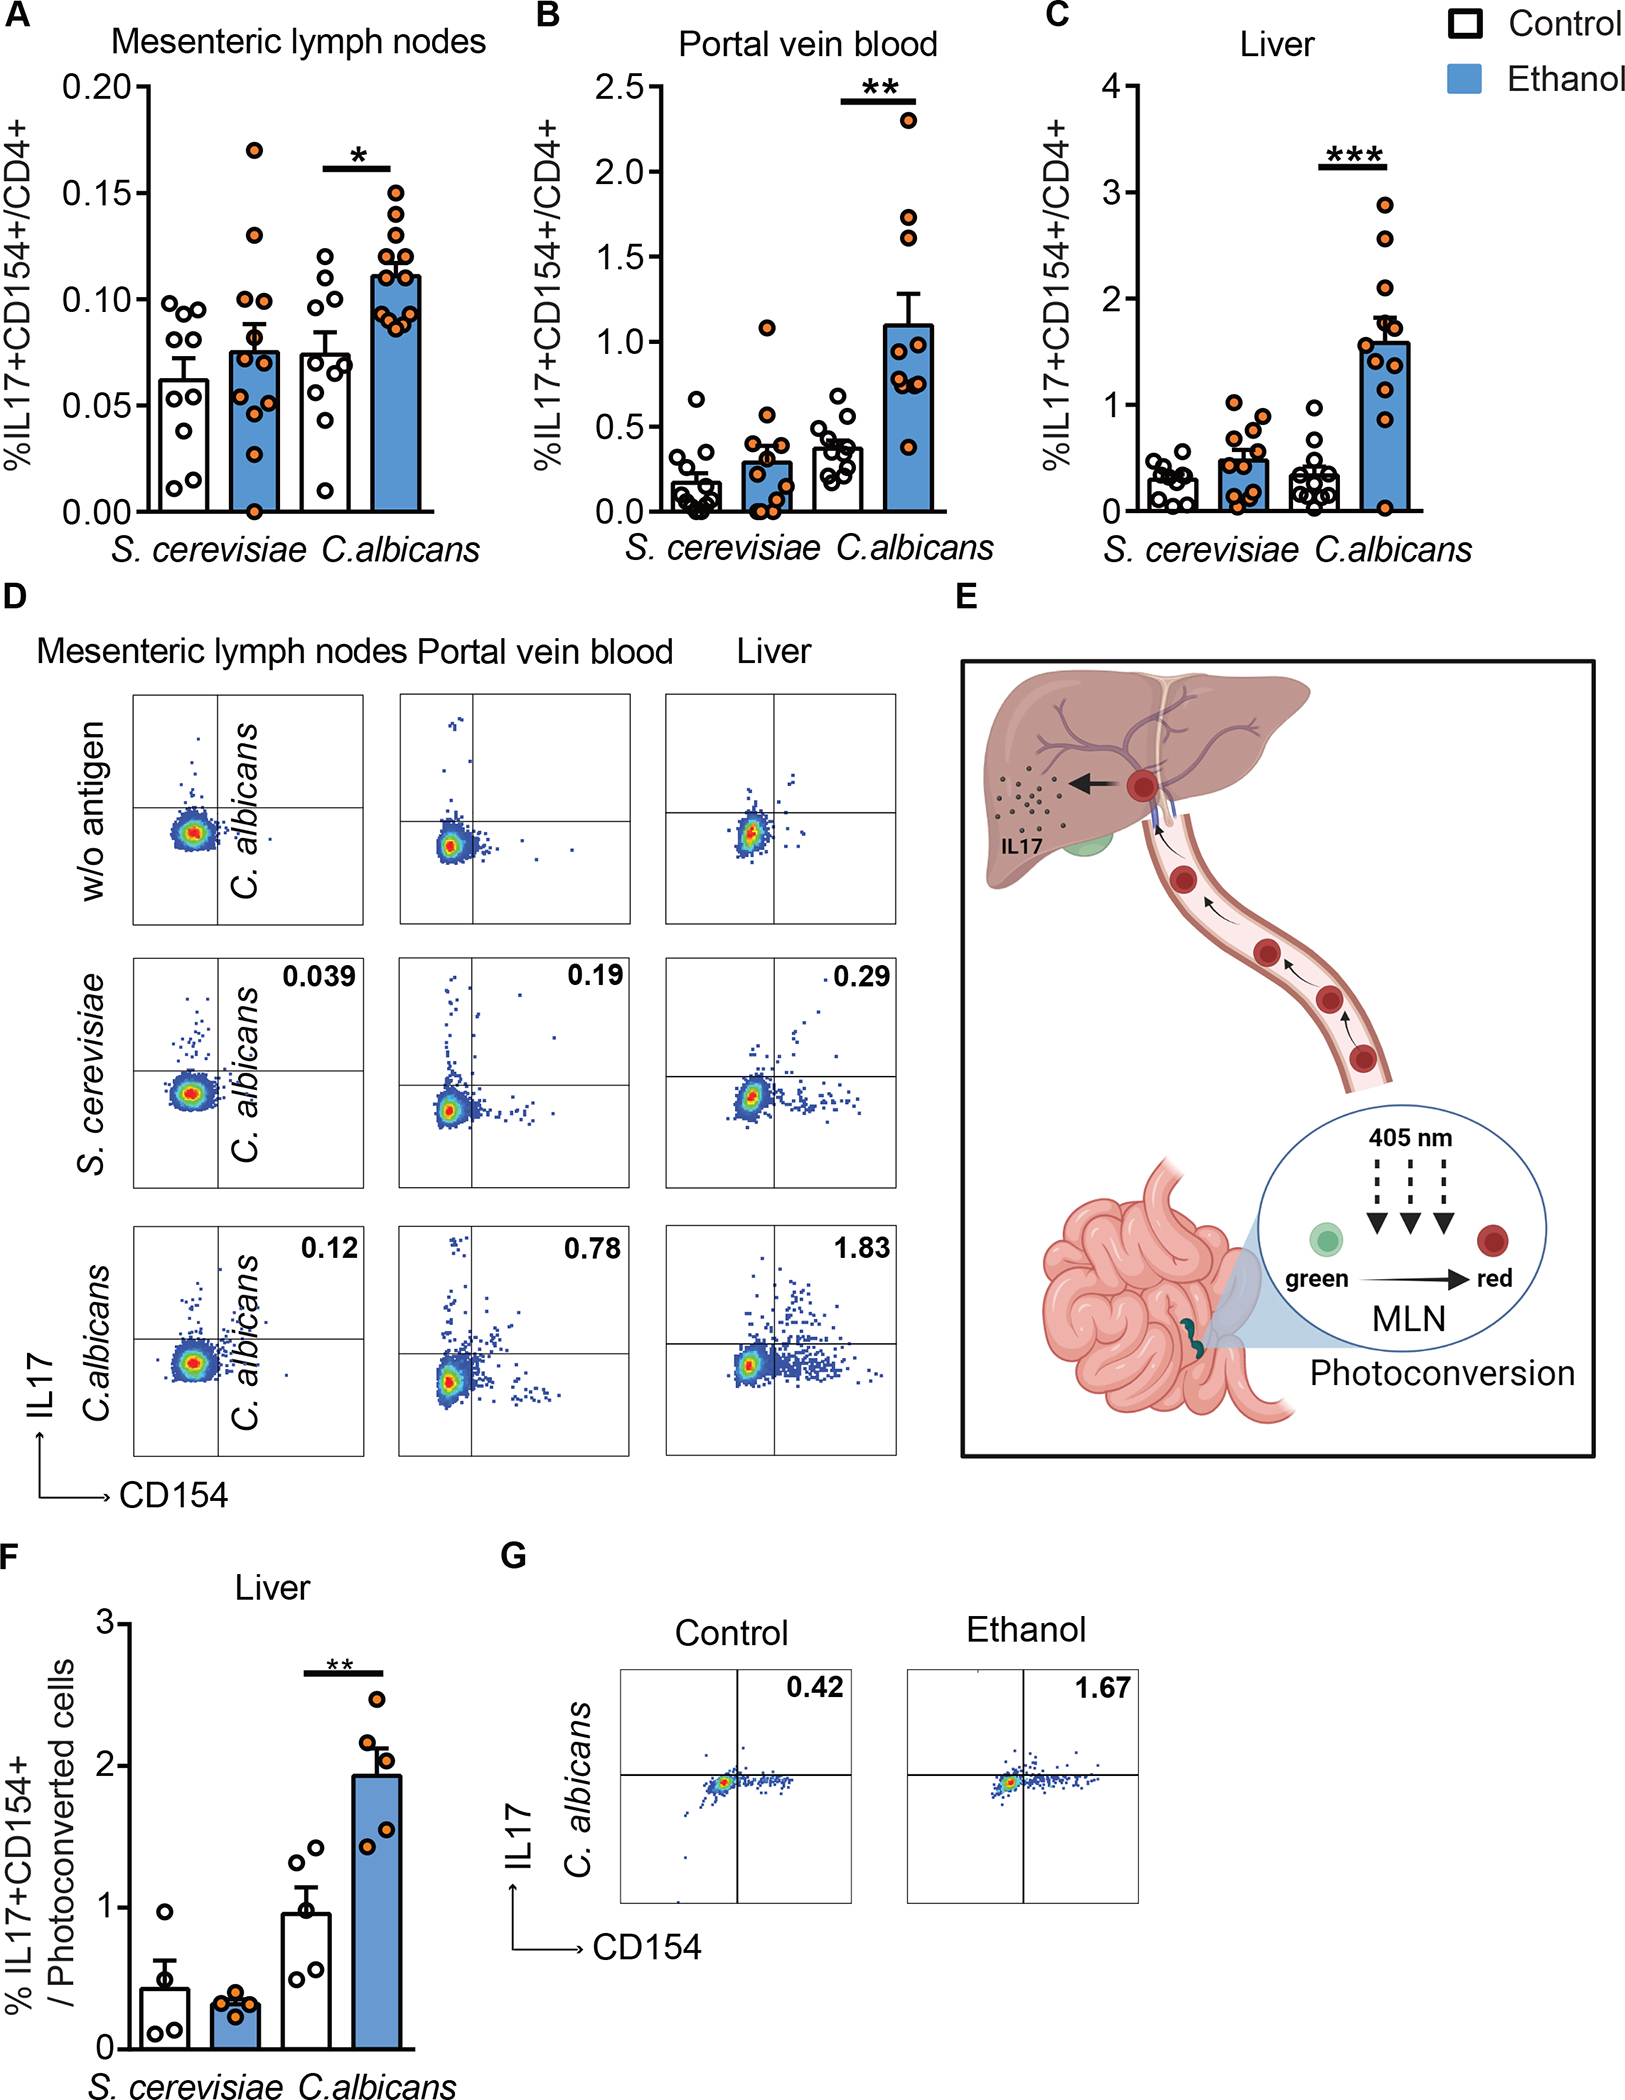
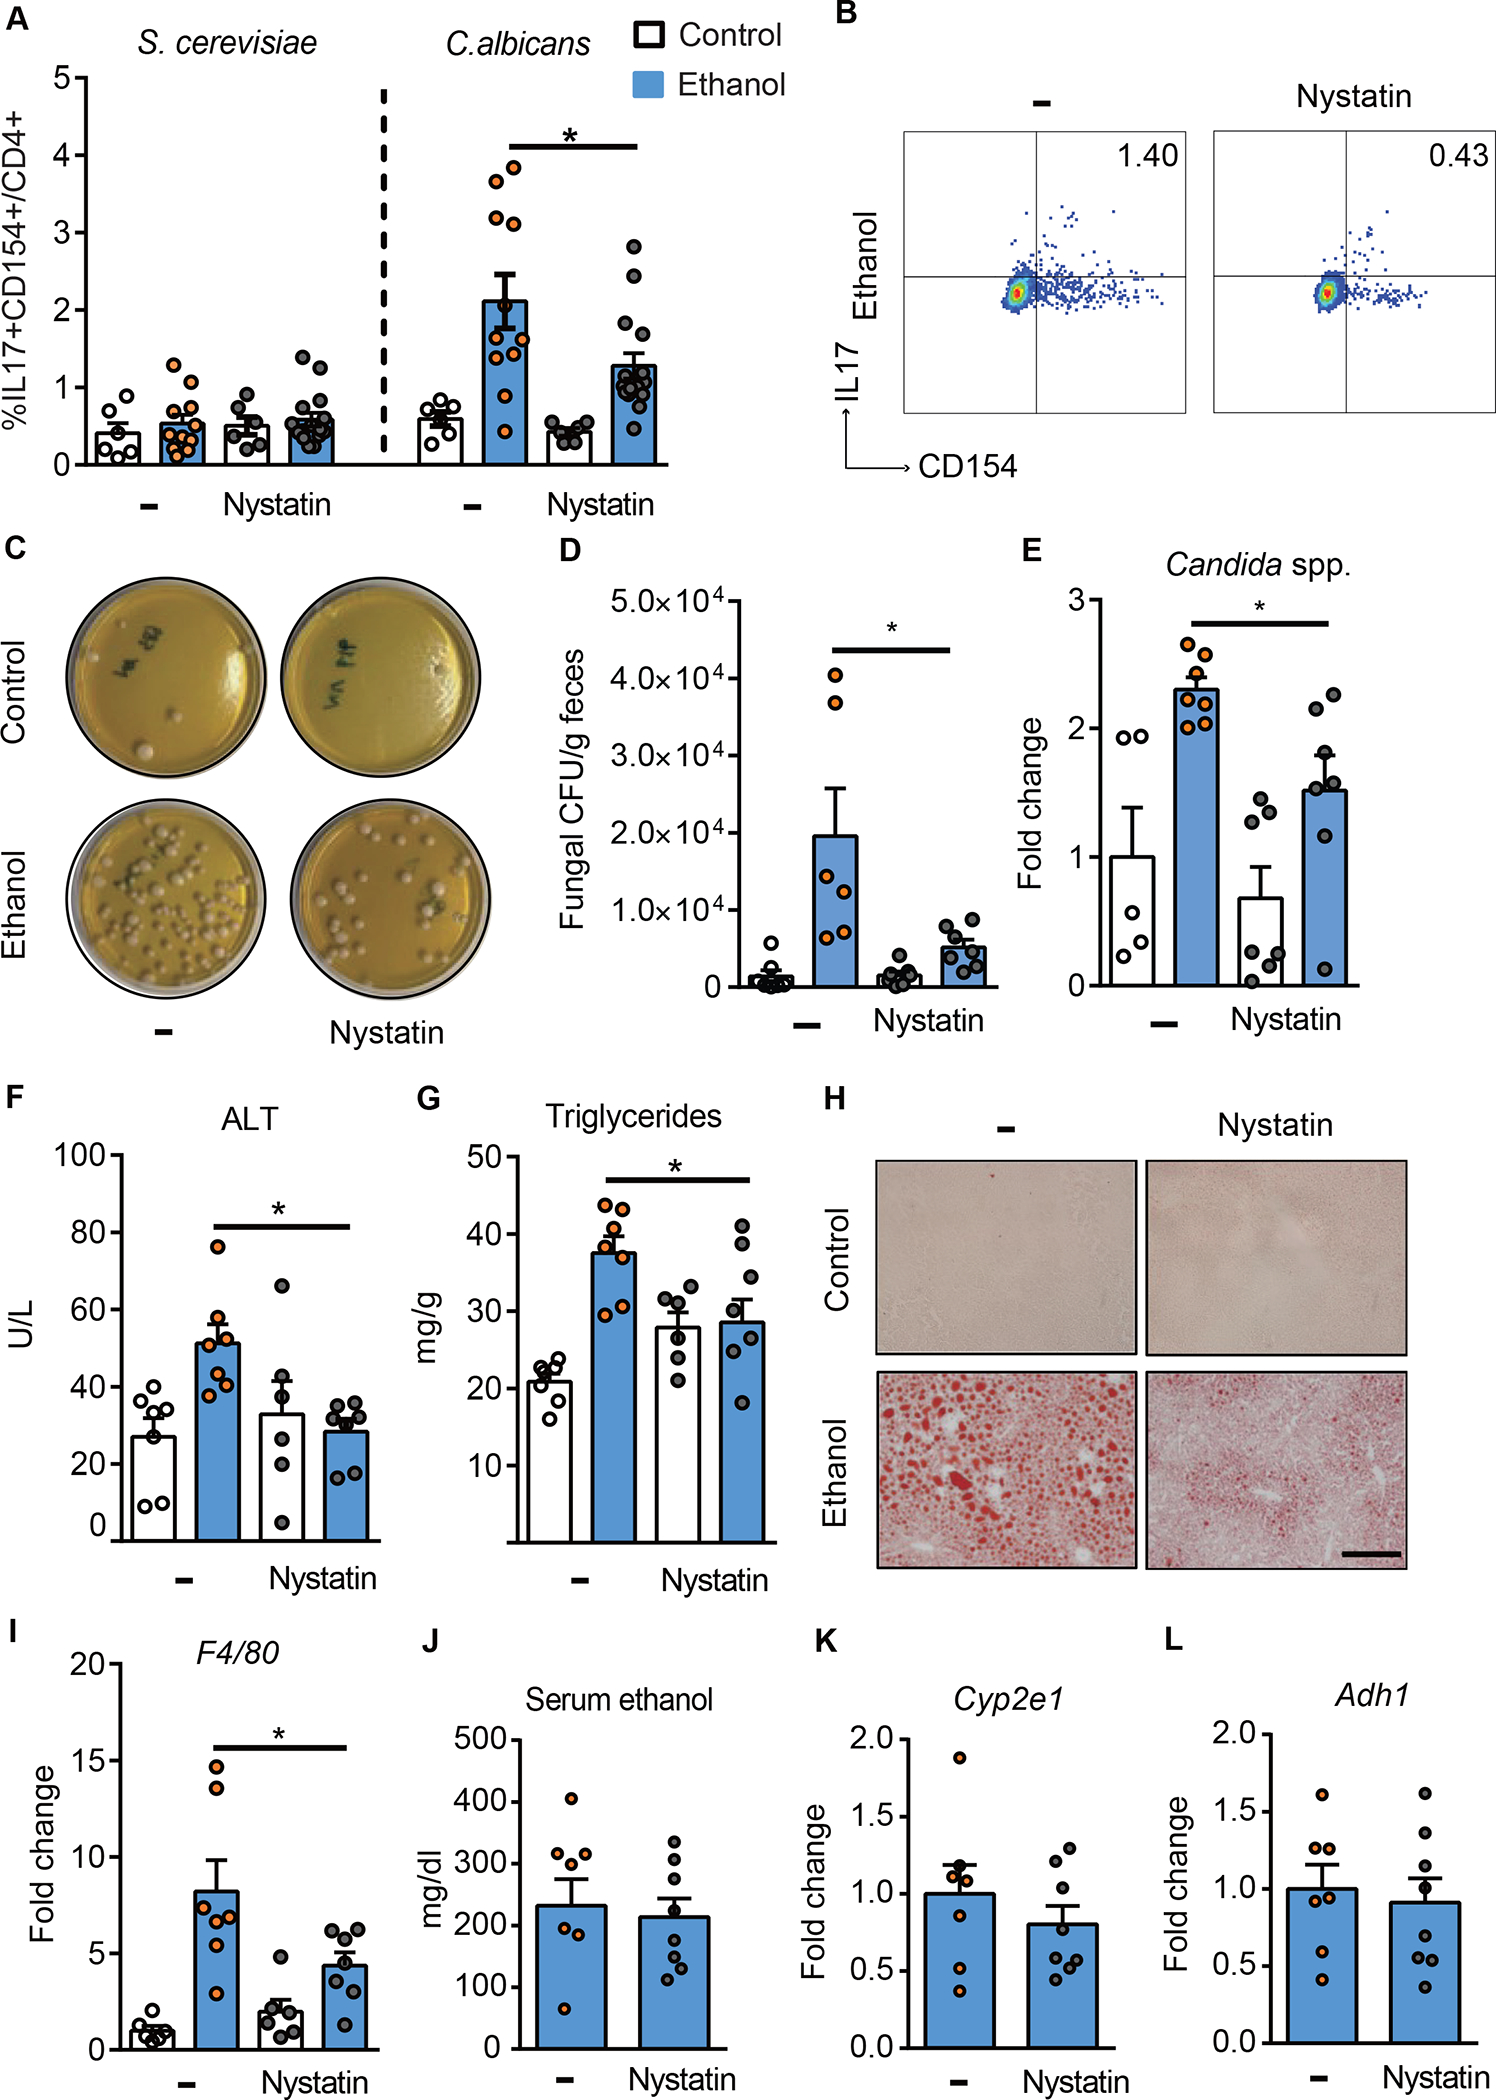
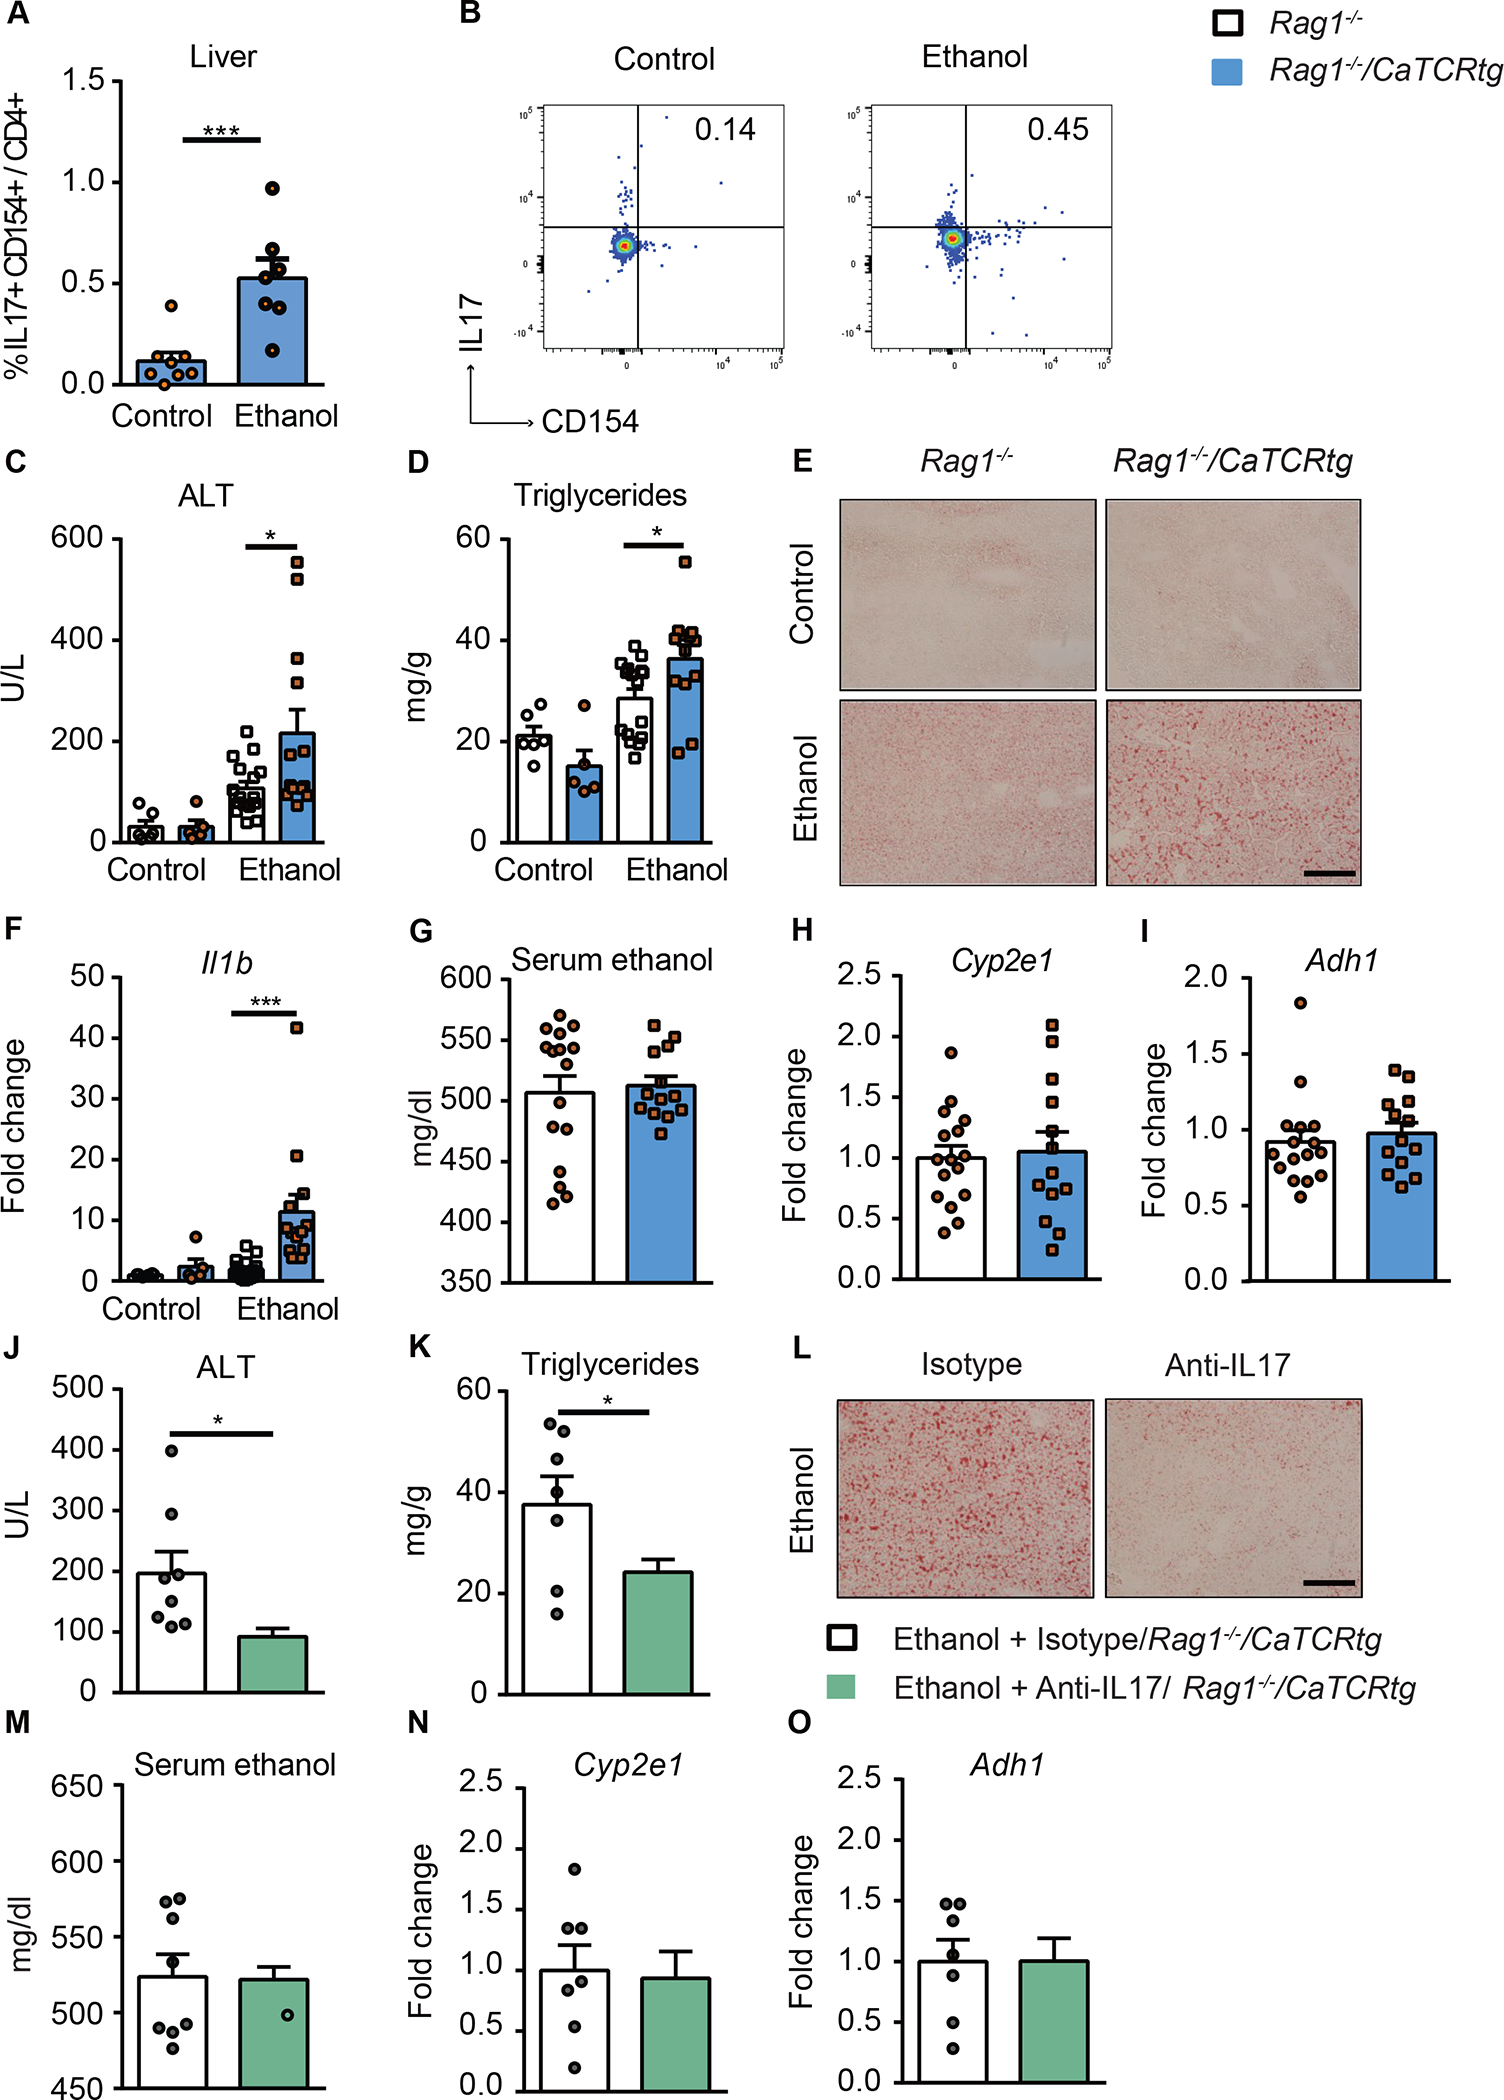
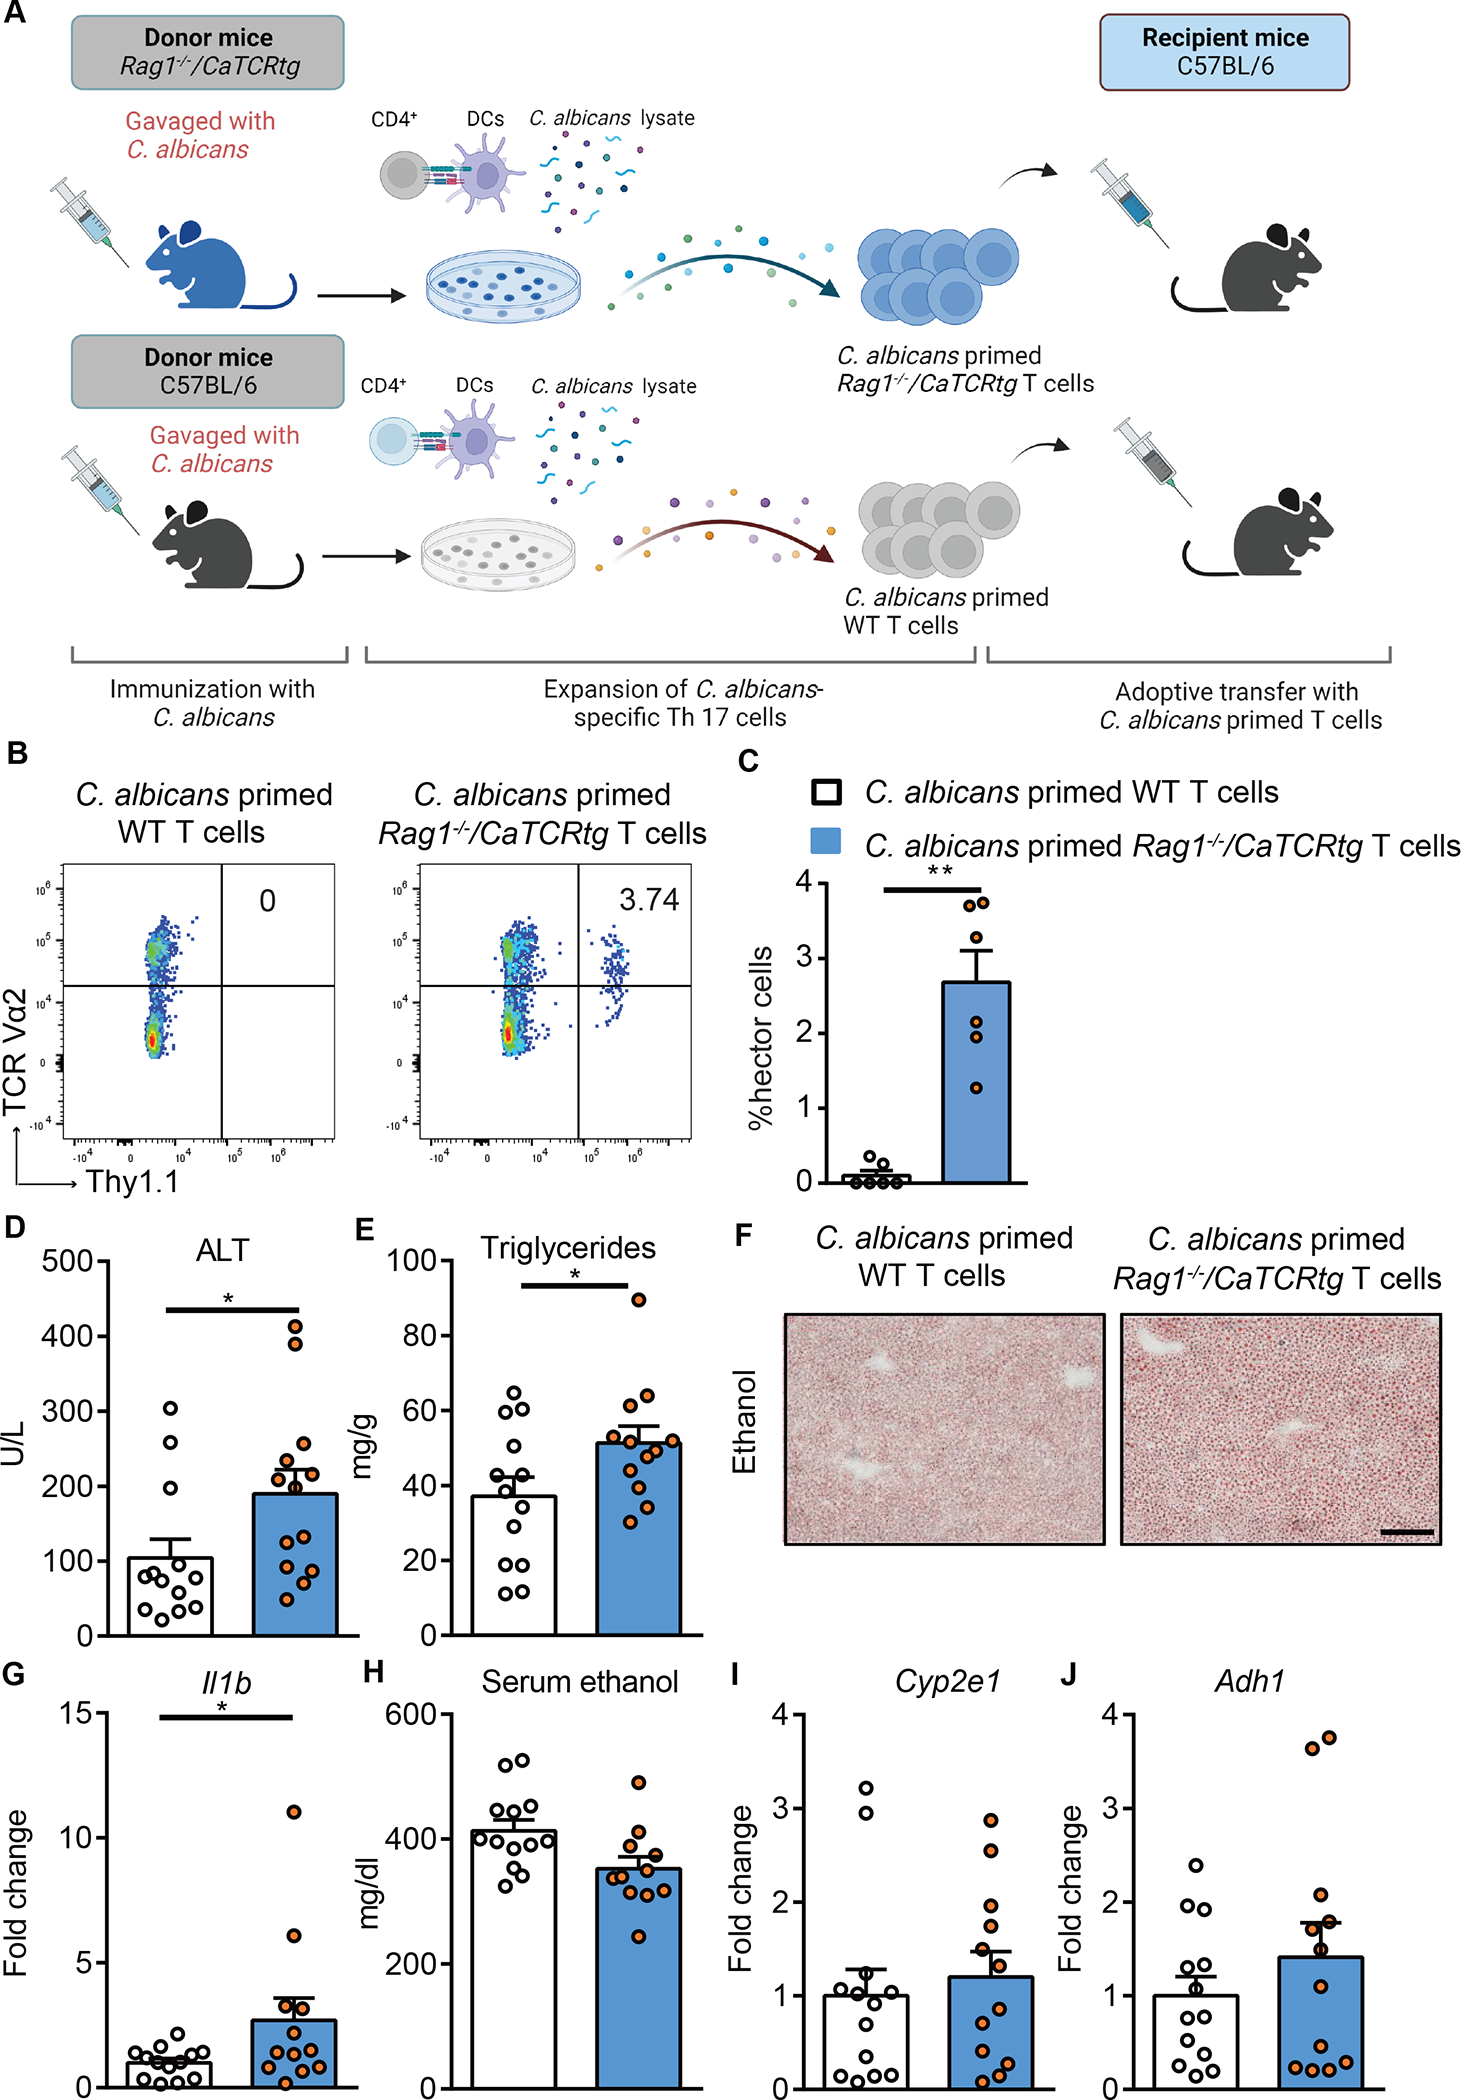
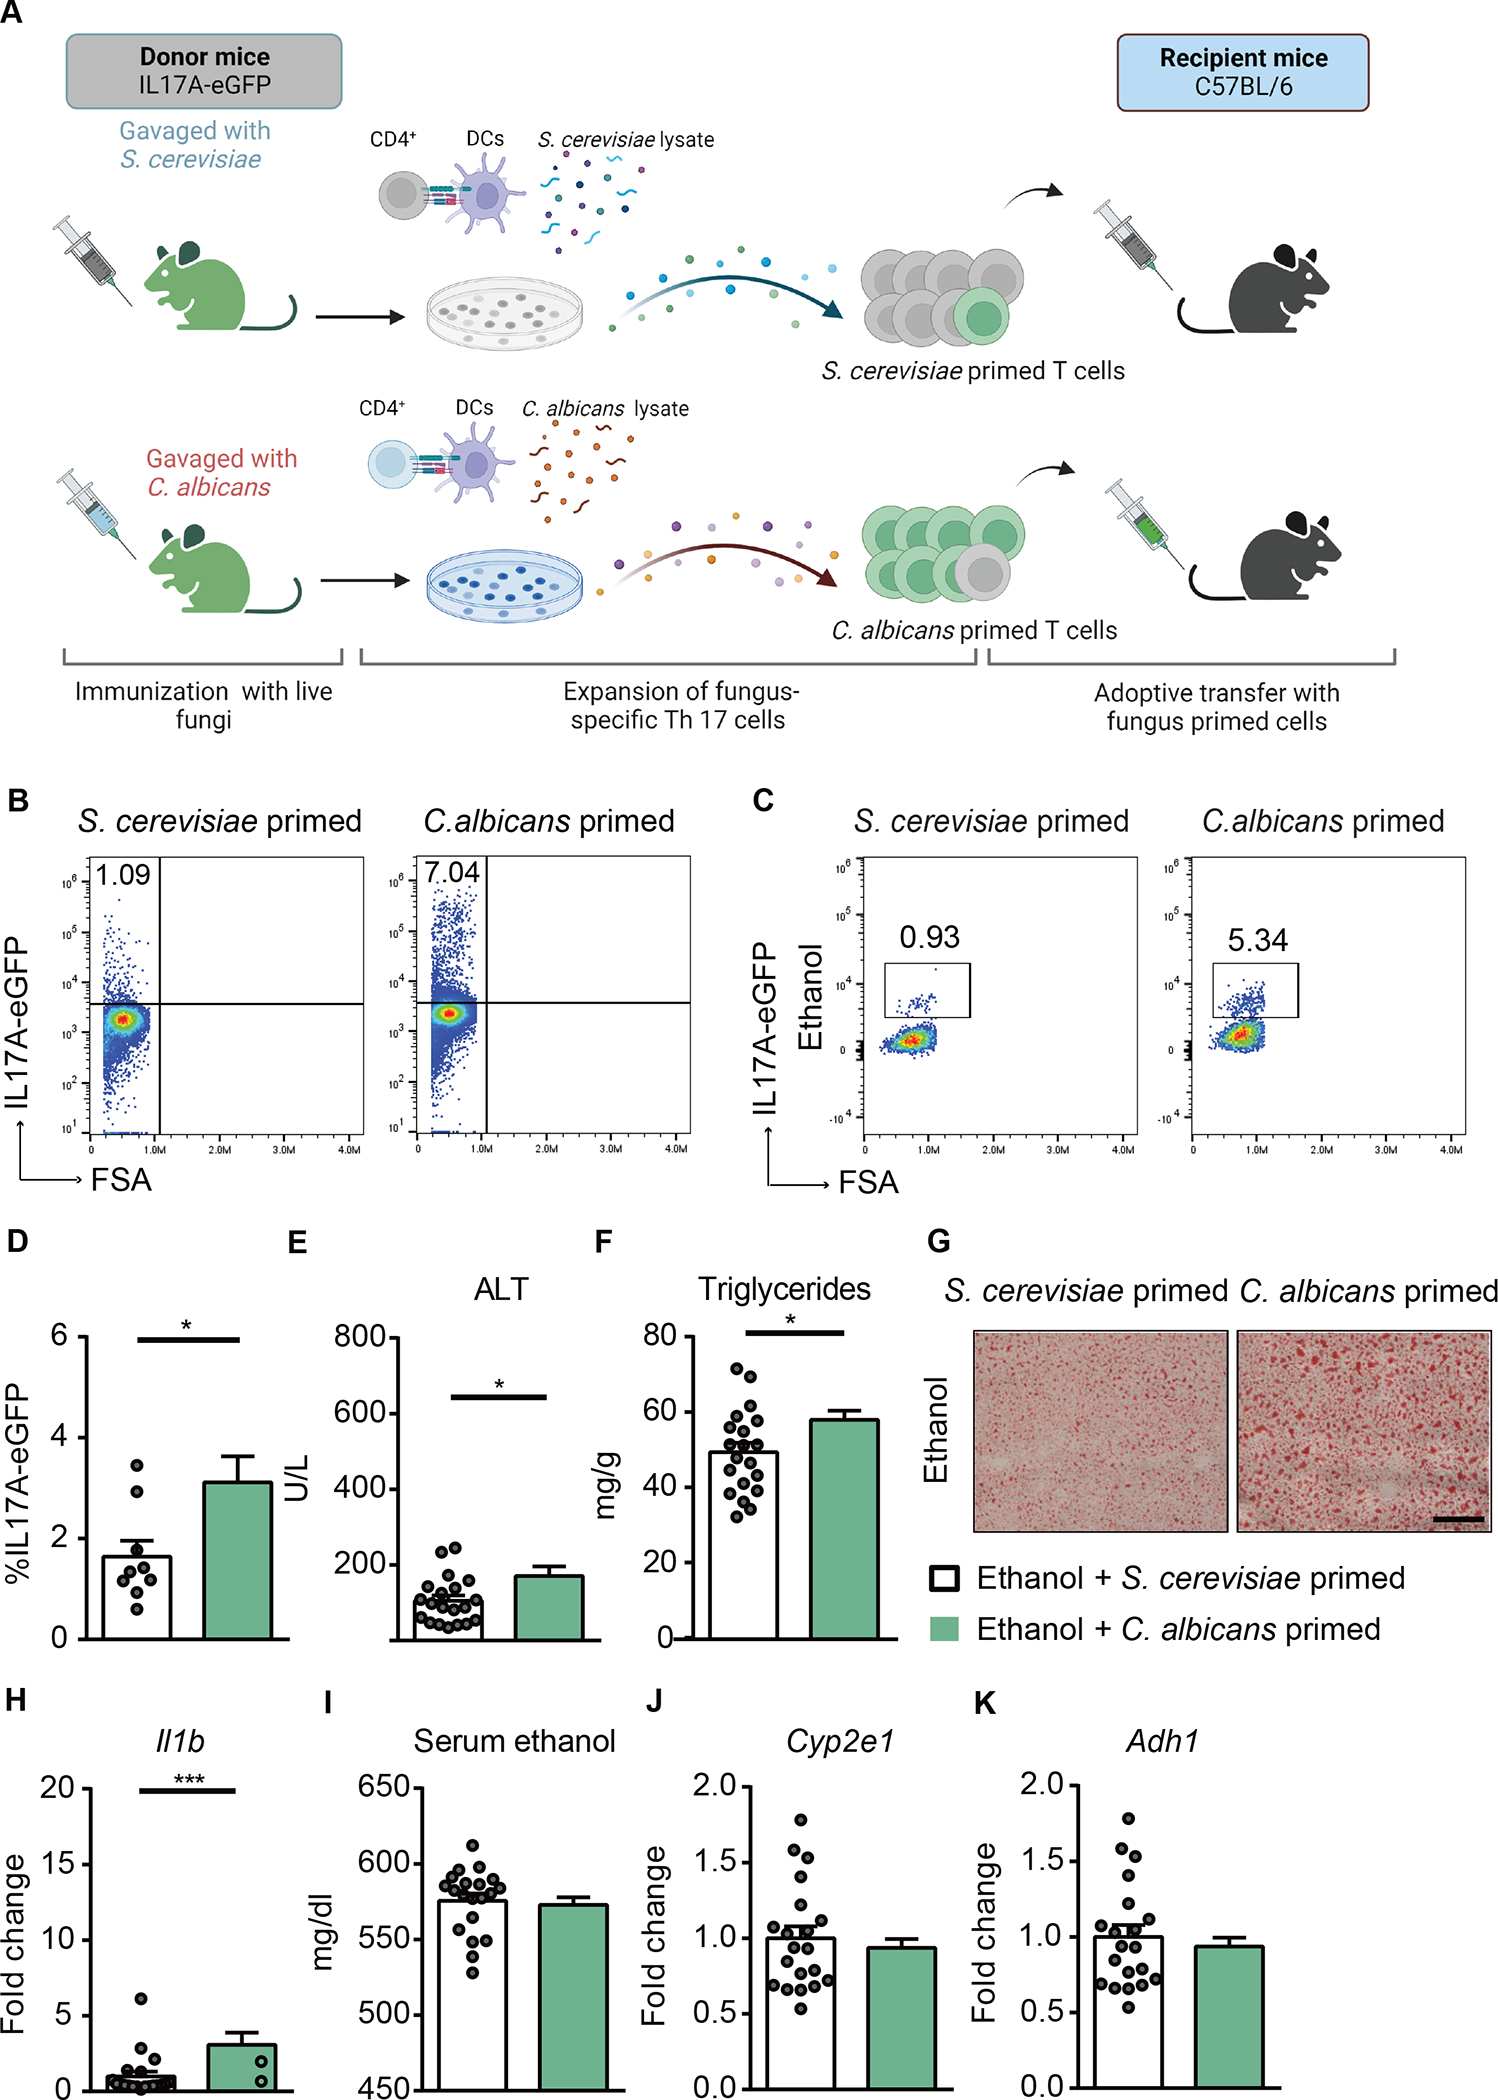
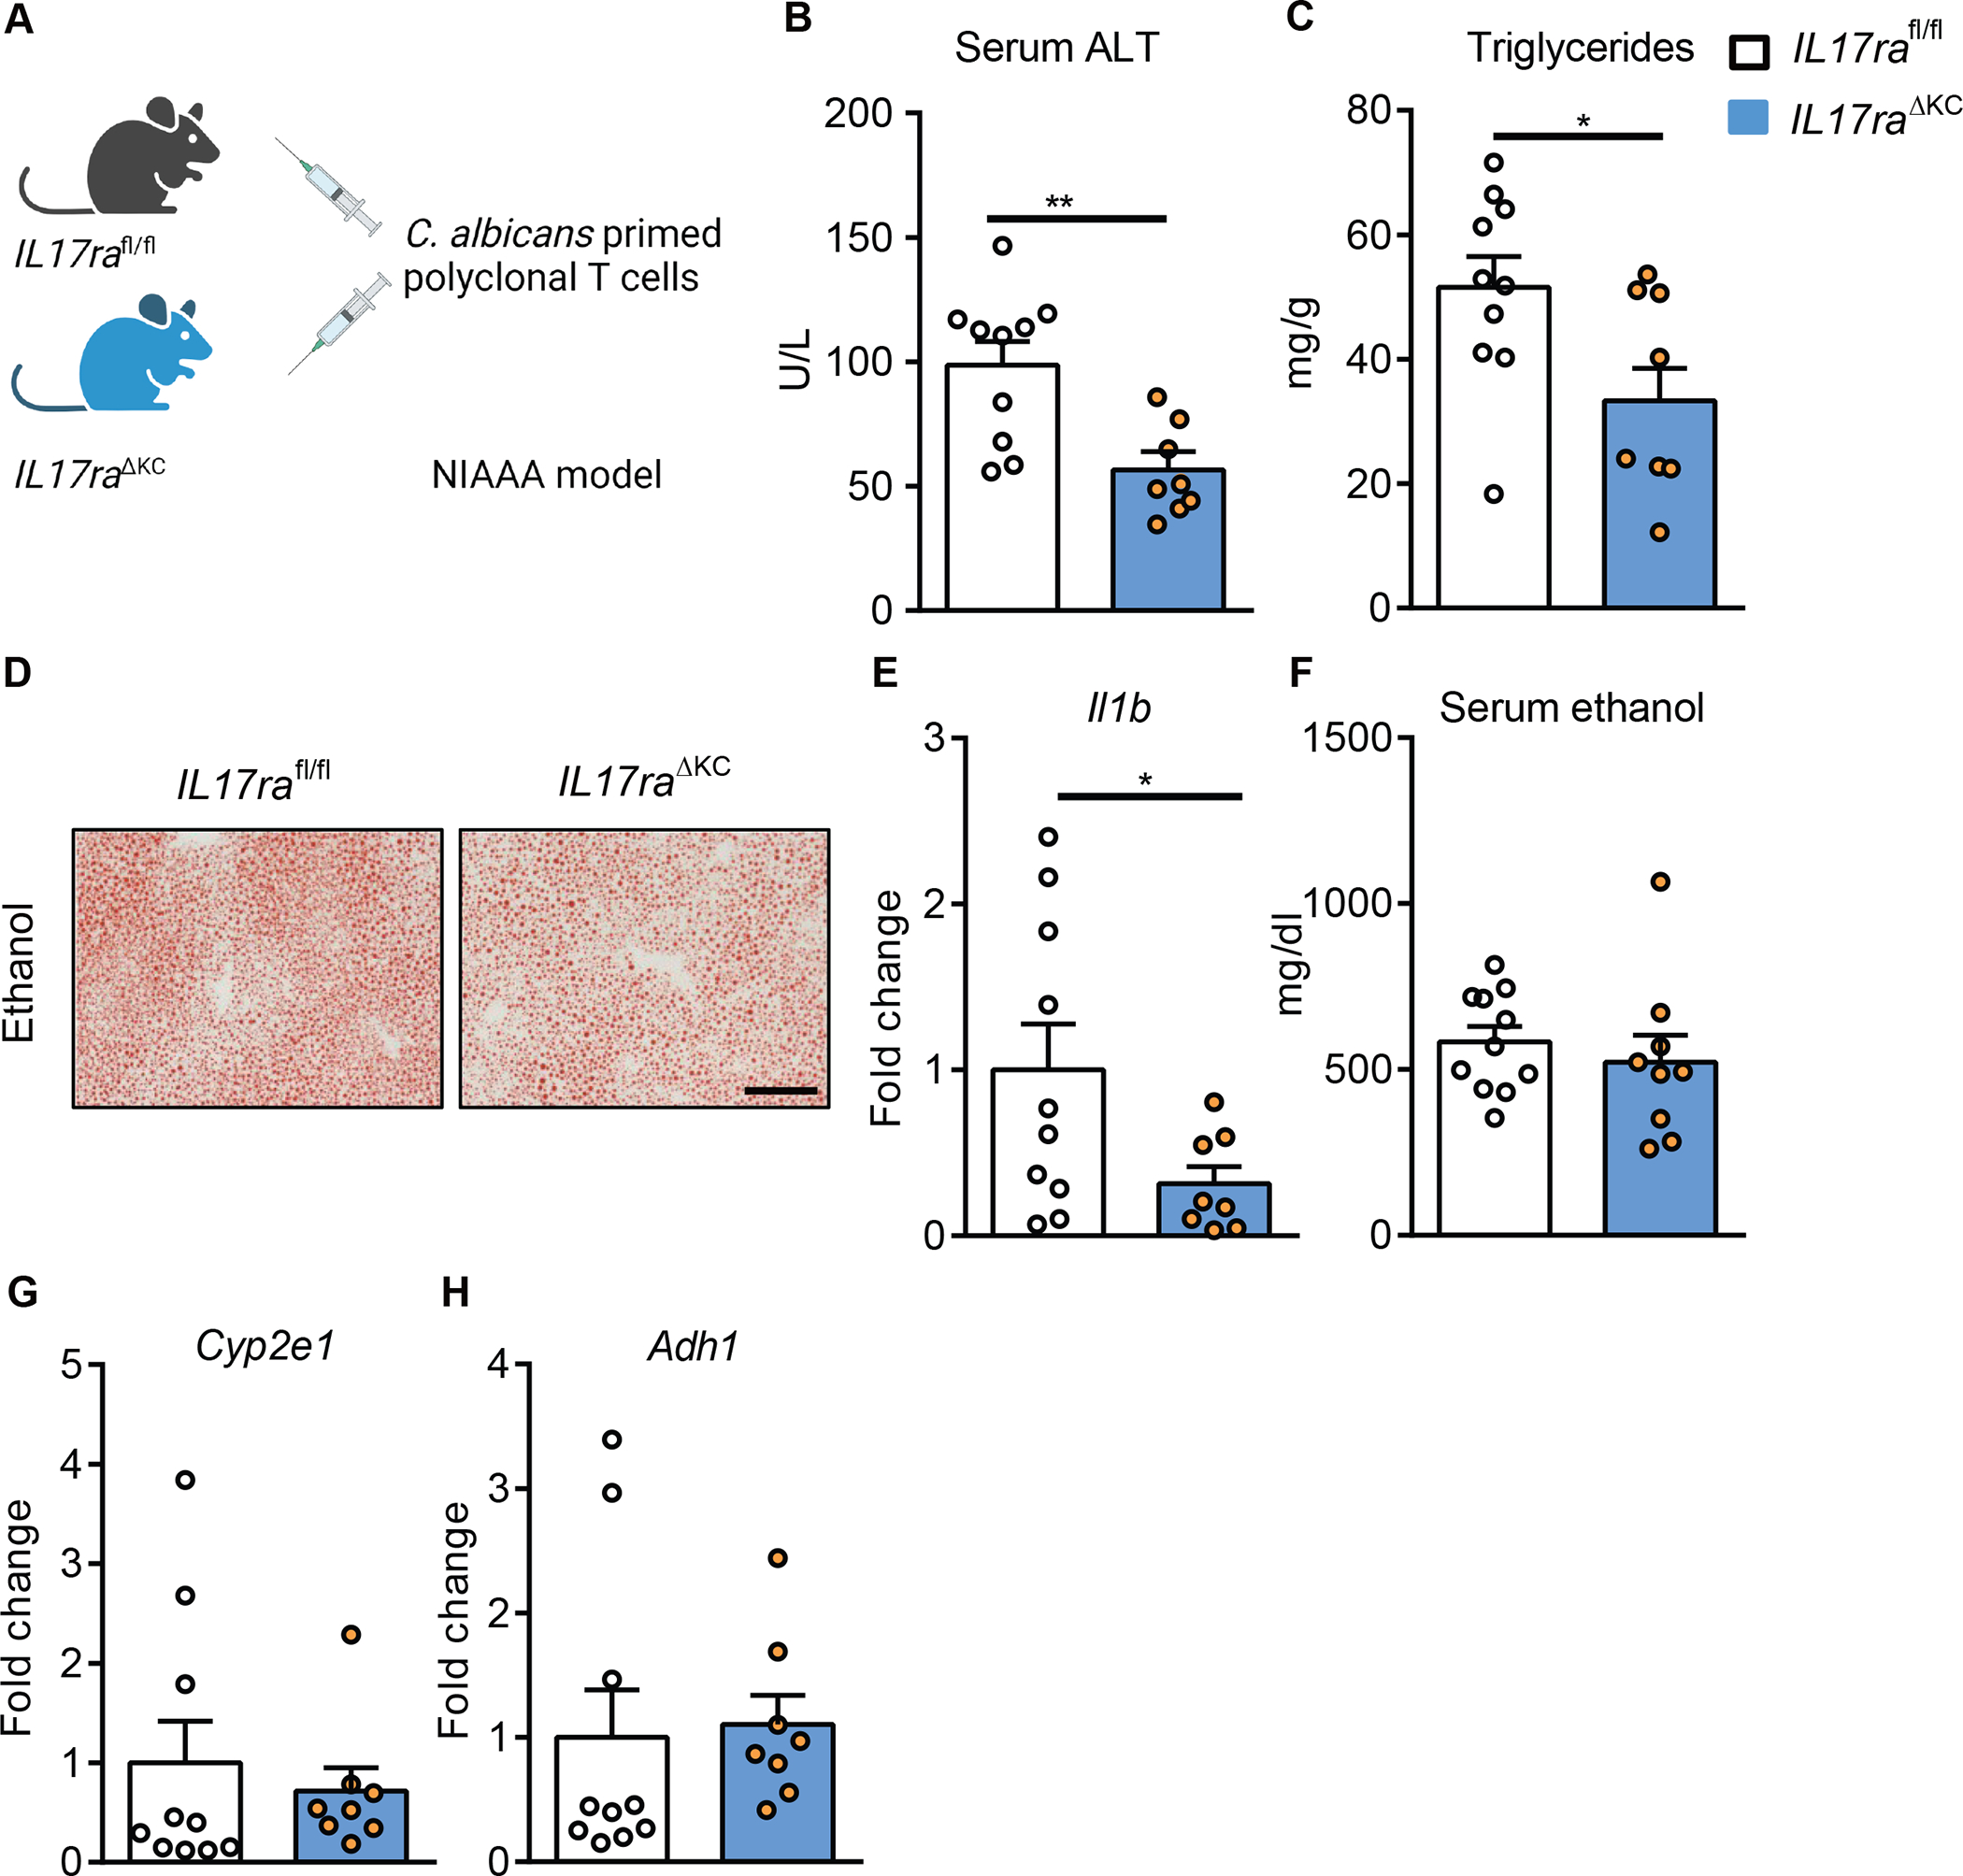
Alcohol-associated liver disease is accompanied by intestinal mycobiome dysbiosis, yet the impacts on liver disease are unclear. We demonstrate that Candida albicans-specific T helper 17 (Th17) cells are increased in circulation and present in the liver of patients with alcohol-associated liver disease. Chronic ethanol administration in mice causes migration of Candida albicans (C. albicans)-reactive Th17 cells from the intestine to the liver. The antifungal agent nystatin decreased C. albicans-specific Th17 cells in the liver and reduced ethanol-induced liver disease in mice. Transgenic mice expressing T cell receptors (TCRs) reactive to Candida antigens developed more severe ethanol-induced liver disease than transgene-negative littermates. Adoptively transferring Candida-specific TCR transgenic T cells or polyclonal C. albicans-primed T cells exacerbated ethanol-induced liver disease in wild-type mice. Interleukin-17 (IL-17) receptor A signaling in Kupffer cells was required for the effects of polyclonal C. albicans-primed T cells. Our findings indicate that ethanol increases C. albicans-specific Th17 cells, which contribute to alcohol-associated liver disease.

Keywords: ALD; alcoholic liver disease; microbiome; microbiota; mycobiome.


Conflict of interest statement

Declaration of interests B.S. has been consulting for Ambys Medicines, Ferring Research Institute, Gelesis, HOST Therabiomics, Intercept Pharmaceuticals, Mabwell Therapeutics, Patara Pharmaceuticals, and Takeda. B.S.’s institution UC San Diego has received research support from Artizan Biosciences, Axial Biotherapeutics, BiomX, CymaBay Therapeutics, NGM Biopharmaceuticals, Prodigy Biotech, and Synlogic Operating Company. B.S. is the founder of Nterica Bio. UC San Diego has filed several patents with B.S. and Y.D. as inventors related to this work. P.S. received grant support from Gilead Sciences Belgium.

Figures

Figure 1.
Figure 1.. Patients with alcohol use disorder and liver disease have increased C. albicans-reactive Th17 responses vs non-alcoholic controls
(A) Absolute frequencies of fungus-reactive CD154+CD45RA-memory CD4+ T cells (Tmem) in non-alcoholic controls (n=33) and patients with alcohol use disorder (AUD) and liver disease (n=36). (B) Flow cytometry plots of IL17A+CD154+ cells within CD4+ T cells. Numbers indicate percentage of IL17A+ cells within CD154+ memory T cells. (C) Absolute frequencies of fungus-reactive IL17A+ producers within total CD4+ T cells. (D) Cytokine production analyzed by ex-vivo fungus-reactive Tmem, from controls and patients with alcohol use disorder and liver disease, after stimulation with C. albicans or S. cerevisiae lysate. Relative frequencies of Ki67, IntB7, IL22, IL21, IL17F, IL17A, IL10, IL2, IFNG, GM-CSF within CD154+ Tmem are shown (%Marker+ / CD154+ Tmem). Significant differences are indicated by red text and asterisks. (E) C. albicans-stimulated CD154+ memory T cells from peripheral blood of patients with alcohol-associated liver disease (ALD) (n=2) were ex vivo FACS purified and analyzed by single-cell gene expression. UMAP visualization shows the subset composition of the C. albicans-stimulated cells colored by functional gene expression clusters. (F) Bubble plot visualization showing the gene expression of selected markers in each T cell cluster. Colors represent the Z-score normalized gene expression and the size of the bubbles indicates the proportion of cells expressing the respective genes. (G) Bulk TCR sequencing was performed from bulk liver biopsies and total CD4+ T cells from blood of the same individuals as the C. albicans scRNA seq dataset. Proportions of C. albicans-stimulated TCR-alpha and beta sequences within the liver and peripheral CD4+ T cells are shown for both donors. (H) C. albicans-stimulated TCR clonotypes showed identical TCR sequences with bulk TCR data from the liver samples are highlighted in the UMAP plot and color-coded according to the identified functional clusters. (I) Phenotype distribution of C. albicans-stimulated clonotypes showed identical TCR sequences with liver samples compared to total of C. albicans-stimulated clonotypes from PBMCs. Figure 1A–D was performed in 12 independent experiments with 2–5 patients and controls each time. Results are expressed as mean±SEM. P value determined by 1-way ANOVA with Holm-Sidak post-hoc test. **P<0.01, ***P<0.001. See also Figure S1.
Figure 2.
Figure 2.. Ethanol administration increases C. albicans-specific Th17 cells in mice
C57BL/6 mice were fed a chronic plus binge ethanol diet (ethanol, blue) or isocaloric diet (control, white). Fungus-activated Th17 cells in mesenteric lymph nodes (A), portal vein blood (B), and liver (C), detected after isolation of mononuclear cells following 6 hrs ex vivo stimulation with C. albicans or S. cerevisiae lysate. (D) Flow cytometry plots of IL17A+CD154+ cells among CD4+ T cells. Kaede mice were fed a chronic plus binge ethanol diet or isocaloric diet. (E) Migration of cells from mesenteric lymph nodes (MLN) to liver using Kaede mice. Photoconversion was performed in mesenteric lymph nodes, and livers were collected after 48 hrs. Created with BioRender.com. (F) Fungus-activated Th17 cells in liver, detected after isolation of mononuclear cells following 6 hrs ex vivo stimulation with C. albicans or S. cerevisiae lysate. (G) Flow cytometry plots of IL17A+CD154+ cells among migrated (photoconverted) cells after stimulation with C. albicans lysate. Figure 2A–C was performed in 3–4 independent experiments. Figure 2E–G was conducted in 2 independent experiments. Results are expressed as mean±SEM. P values among groups of mice fed with control diet or ethanol diet are determined by 1-way ANOVA with Tukeýs post-hoc test. *P<0.05, **P<0.01, ***P<0.001. See also Figure S2.
Figure 3.
Figure 3.. Antifungal agent reduces hepatic C. albicans-activated Th17 cells and attenuates ethanol-induced liver disease in mice
(A-B) C57BL/6 mice were fed a chronic plus-binge ethanol diet (NIAAA model) or an isocaloric (control) diet, with or without the anti-fungal drug nystatin. (A) Fungus-activated Th17 cells in liver detected after isolation of mononuclear cells, following 6 hrs ex vivo stimulation with C. albicans or S. cerevisiae lysate. (B) Flow cytometry plots of IL17A+CD154+ cells among CD4+ T cells. (C–L) C57BL/6 mice were placed on a chronic Lieber DeCarli diet or control diet for 8 weeks. Diets were supplemented with or without nystatin for the last 10 days. (C) Fecal samples from controls and ethanol-fed mice were cultured on YPD agar plates with antibiotics; representative agar plates are shown. (D) Colony forming units (CFUs) of fungi in fecal samples were counted. (E) Fecal fungal DNA was extracted, and the abundance of Candida spp. was detected by qPCR. Fold change was calculated relative to vehicle-treated mice on control diet. (F) Serum levels of ALT. (G) Hepatic triglyceride content. (H) Representative oil red O staining of liver sections (scale bar, 100 μm). (I) Hepatic levels of F4/80 mRNA. (J) Serum levels of ethanol. (K and L) Hepatic levels of Cyp2e1 and Adh1 mRNAs. Figure 3A–B was performed in 3 independent experiments. Figure 3C–L was conducted in 2 independent experiments. Results are expressed as mean±SEM. P values between groups of mice fed the ethanol diet, with vs without nystatin, were determined by 2-way ANOVA with Tukeýs post-hoc test (A, D, E, F, G, and I) or 2-sided Student t test (J-L). *P<0.05. See also Figure S3.
Figure 4.
Figure 4.. Candida-specific TCR transgenic mice develop more severe ethanol-induced liver disease
Candida-specific TCR transgenic mice (Rag1−/−/CaTCRtg) and their transgene-negative littermates (Rag1−/−) were fed a chronic plus binge ethanol diet or isocaloric diet. (A) Fungus-activated Th17 cells in liver were detected after isolation of hepatic mononuclear cells following 6 hrs ex vivo stimulation with C. albicans lysate. (B) Flow cytometry plots showing IL17A+ and CD154+ staining of CD4+ T cells. (C) Serum levels of ALT. (D) Hepatic triglyceride content. (E) Representative oil red O-stained liver sections (scale bar, 100 μm). (F) Hepatic levels of Il1b mRNA. (G) Serum levels of ethanol. (H and I) Hepatic levels of Cyp2e1 and Adh1 mRNAs. (J–O) Candida-specific TCR transgenic mice (Rag1−/−/CaTCR tg) were fed a chronic plus binge ethanol diet and given injections of an isotype antibody (control, white) or antibody against IL17A (green) 5 days before sacrifice. (J) Serum levels of ALT. (K) Hepatic triglyceride content. (L) Representative oil red O-stained liver sections (scale bar, 100 μm). (M) Serum levels of ethanol. (N and O) Hepatic levels of Cyp2e1 and Adh1 mRNAs. Figure 4A–B, Figure 4C–I and Figure 4J–O were conducted in 2 independent experiments. Results are expressed as mean±SEM. P values determined by 2-sided Student t test (A, G, H, I, J, K, M, N and O) and 2-way ANOVA with Tukeýs post-hoc test (C, D and F). *P<0.05, ***P<0.001. See also Figure S4.
Figure 5.
Figure 5.. Candida-specific TCR transgenic hector T cells promote ethanol-induced liver disease
(A) Diagram of adoptive transfer of C. albicans-primed Rag1−/−/CaTCRtg and wild-type T cells to wild-type mice. On day 0, Candida-specific TCR transgenic (Rag1−/−/CaTCRtg) and C57BL/6 donor mice were gavaged with C. albicans. On day 10, CD4+ T cells from lymph nodes and spleen of donor mice were co-cultured with bone marrow-derived dendritic cells in the presence of C. albicans lysate for 6 days. On day 16, CD4+ T cells were injected intravenously to C57BL/6 mice (day 13 of chronic plus binge ethanol feeding). Created with BioRender.com. (B and C) Thy1.1+ CD4+ Vα2+ hector T cells were detected in livers of ethanol-fed recipient mice at the time of collection. (D) Serum levels of ALT. (E) Hepatic triglyceride content. (F) Representative oil red O-stained liver sections (scale bar, 100 μm). (G) Hepatic levels of Il1b mRNA. (H) Serum levels of ethanol. (I and J) Hepatic levels of Cyp2e1 and Adh1 mRNAs. Figure 5 was conducted in 2 independent experiments. Results are expressed as mean±SEM. Fold change was calculated relative to mice that were adoptively transferred with C. albicans-primed CD4+ T cells from wild-type C57BL/6 mice. P values determined by 2-sided Student t test. *P<0.05. See also Figure S4.
Figure 6.
Figure 6.. C. albicans-primed polyclonal T cells exacerbate ethanol-induced liver disease
(A) Diagram of adoptive transfer of C. albicans-specific polyclonal T cells to mice. On day 0, IL17A-eGFP donor mice were gavaged with C. albicans or S. cerevisiae. On day 10, polyclonal CD4+ T cells from mesenteric lymph nodes and spleen of donor mice were co-cultured with bone marrow-derived dendritic cells in the presence of fungal lysates for 6 days. On day 16, polyclonal CD4+ T cells were injected intravenously to C57BL/6 mice (day 13 of chronic plus binge ethanol feeding). Created with BioRender.com. (B) The proportion of IL17A-eGFP+ cells among total CD4+ T cells after ex vivo stimulation for adoptive-transfer was assessed by flow cytometry. (C and D) IL17A-eGFP+ cells were detected in livers of ethanol-fed recipient mice at the time of collection. (E) Serum levels of ALT. (F) Hepatic triglyceride content. (G) Representative oil red O-stained liver sections (scale bar, 100 μm). (H) Hepatic levels of Il1b mRNA. (I) Serum levels of ethanol. (J and K) Hepatic levels of Cyp2e1 and Adh1 mRNAs. Figure 6 was conducted in 3 independent experiments. Results are expressed as mean±SEM. P values determined by 2-sided Student t test. *P<0.05, ***P<0.001. See also Figure S5.
Figure 7.
Figure 7.. Kupffer cells mediate the disease exacerbating effect of adoptively transferred polyclonal C. albicans-primed T cells
(A) Diagram of adoptive transfer of polyclonal C. albicans-primed T cells to mice lacking IL17ra on Kupffer cells (II17raΔKC) and their littermate II17rafl/fl mice. II17raΔKC and littermate II17rafl/fl mice were fed a chronic plus binge ethanol diet and injected C. albicans-primed polyclonal T cells intravenously 3 days before harvesting. (B) Serum levels of ALT. (C) Hepatic triglyceride content. (D) Representative oil red O-stained liver sections (scale bar, 100 μm). (E) Hepatic levels of Il1b mRNA. (F) Serum levels of ethanol. (G and H) Hepatic levels of Cyp2e1 and Adh1 mRNAs. Figure 7 was conducted in 2 independent experiments. Results are expressed as mean±SEM. P values determined by 2-sided Student t test. *P<0.05, **P<0.01. See also Figure S6 and Figure S7.

References

    1. Lackner C, and Tiniakos D (2019). Fibrosis and alcohol-related liver disease. J. Hepatol. 70, 294–304. 10.1016/j.jhep.2018.12.003. - DOI - PubMed
    1. Gustot T, and Jalan R (2019). Acute-on-chronic liver failure in patients with alcohol-related liver disease. J. Hepatol. 70, 319–327. 10.1016/j.jhep.2018.12.008. - DOI - PubMed
    1. Lee BP, Vittinghoff E, Dodge JL, Cullaro G, and Terrault NA (2019). National Trends and Long-term Outcomes of Liver Transplant for Alcohol-Associated Liver Disease in the United States. JAMA Intern. Med. 179, 340–348. 10.1001/jamainternmed.2018.6536. - DOI - PMC - PubMed
    1. Shield K, and Rehm J (2020). The importance of preventing alcohol-related liver disease in the USA. The Lancet. Public health 5, e298–e299. 10.1016/s2468-2667(20)30118-3. - DOI - PubMed
    1. Sarin SK, Pande A, and Schnabl B (2019). Microbiome as a therapeutic target in alcohol-related liver disease. J. Hepatol. 70, 260–272. 10.1016/j.jhep.2018.10.019. - DOI - PubMed